| Param | Original file | Final file |
|---|---|---|
| Filename | modeM0/AS1A05_140T01_9000002496_16810cztM0_level2.evt | modeM0/AS1A05_140T01_9000002496_16810cztM0_level2_quad_clean.evt |
| Size (bytes) | 620,481,600 | 90,590,400 |
| Size | 591.7 MB | 86.4 MB |
| Events in quadrant A | 4,399,670 | 564,260 |
| Events in quadrant B | 4,581,882 | 569,478 |
| Events in quadrant C | 4,098,689 | 547,538 |
| Events in quadrant D | 5,194,144 | 531,293 |
| Mode SS | |||
|---|---|---|---|
| Quadrant | BADHDUFLAG | Total packets | Discarded packets |
| A | 0 | 156 | 0 |
| B | 0 | 156 | 0 |
| C | 0 | 156 | 0 |
| D | 0 | 156 | 0 |
| Mode M0 | |||
|---|---|---|---|
| Quadrant | BADHDUFLAG | Total packets | Discarded packets |
| A | 0 | 18087 | 3 |
| B | 0 | 18631 | 2 |
| C | 0 | 17147 | 2 |
| D | 0 | 20507 | 2 |
| Mode M9 | |||
|---|---|---|---|
| Quadrant | BADHDUFLAG | Total packets | Discarded packets |
| A | 0 | 5 | 0 |
| B | 0 | 5 | 0 |
| C | 0 | 5 | 0 |
| D | 0 | 5 | 0 |
| Quadrant | Total seconds | Saturated seconds | Saturation percentage |
|---|---|---|---|
| A | 7624 | 303 | 3.974292% |
| B | 7624 | 278 | 3.646380% |
| C | 7624 | 165 | 2.164218% |
| D | 7624 | 431 | 5.653200% |
Noise dominated data is calculated using 1-second bins in cleaned event files. If a bin has >2000 counts, and if more than 50% of those come from <1% of pixels, then it is considered to be noise-dominated and hence unusable.
| Quadrant | # 1 sec bins | Bins with >0 counts | Bins with >2000 counts | High rate bins dominated by noise | Noise dominated (total time) | Noise dominated (detector-on time) | Marked lightcurve |
|---|---|---|---|---|---|---|---|
| A | 8235 | 7627 | 72 | 72 | 0.87% | 0.94% | 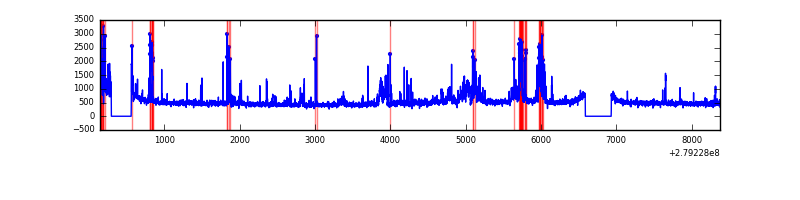 |
| B | 8235 | 7627 | 51 | 51 | 0.62% | 0.67% | 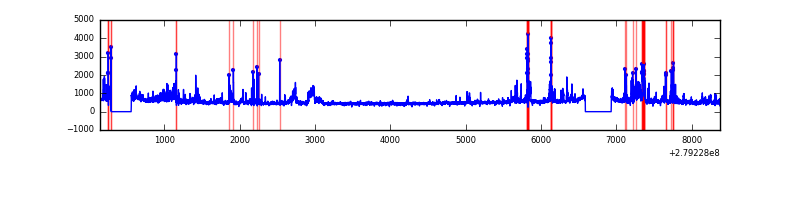 |
| C | 8235 | 7627 | 0 | 0 | 0.00% | 0.00% | 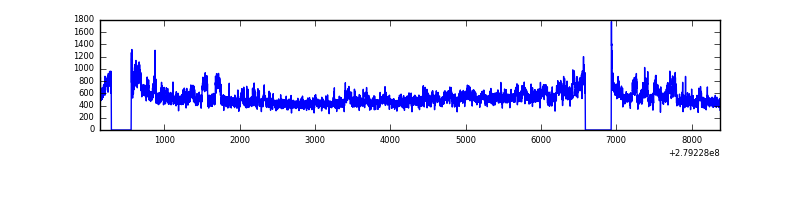 |
| D | 8235 | 7626 | 265 | 265 | 3.22% | 3.47% | 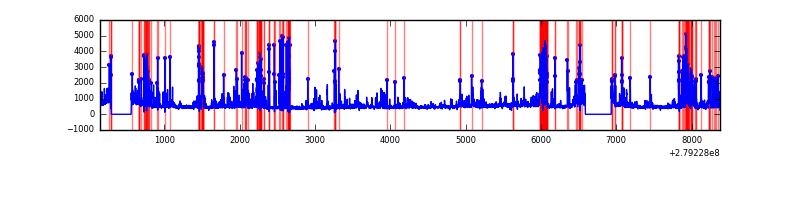 |
Top three noisy pixels from each quadrant. If the there are fewer than three noisy pixels in the level2.evt file, extra rows are filled as -1
| Pixel properties | Quadrant properties | ||||||
|---|---|---|---|---|---|---|---|
| Quadrant | DetID | PixID | Counts | Sigma | Mean | Median | Sigma |
| A | 15 | 174 | 784199 | 4124.33 | 931 | 910 | 189.9 |
| A | 9 | 143 | 38632 | 198.62 | 931 | 910 | 189.9 |
| A | 0 | 226 | 8304 | 38.93 | 931 | 910 | 189.9 |
| B | 15 | 35 | 454795 | 2496.95 | 934 | 908 | 181.8 |
| B | 4 | 216 | 138223 | 755.4 | 934 | 908 | 181.8 |
| B | 0 | 229 | 74239 | 403.41 | 934 | 908 | 181.8 |
| C | 3 | 233 | 451863 | 2143.33 | 894 | 900 | 210.4 |
| C | 14 | 238 | 135765 | 640.98 | 894 | 900 | 210.4 |
| C | 0 | 207 | 19415 | 88.0 | 894 | 900 | 210.4 |
| D | 1 | 52 | 951819 | 4339.45 | 890 | 862 | 219.1 |
| D | 15 | 0 | 339126 | 1543.58 | 890 | 862 | 219.1 |
| D | 12 | 218 | 287132 | 1306.32 | 890 | 862 | 219.1 |
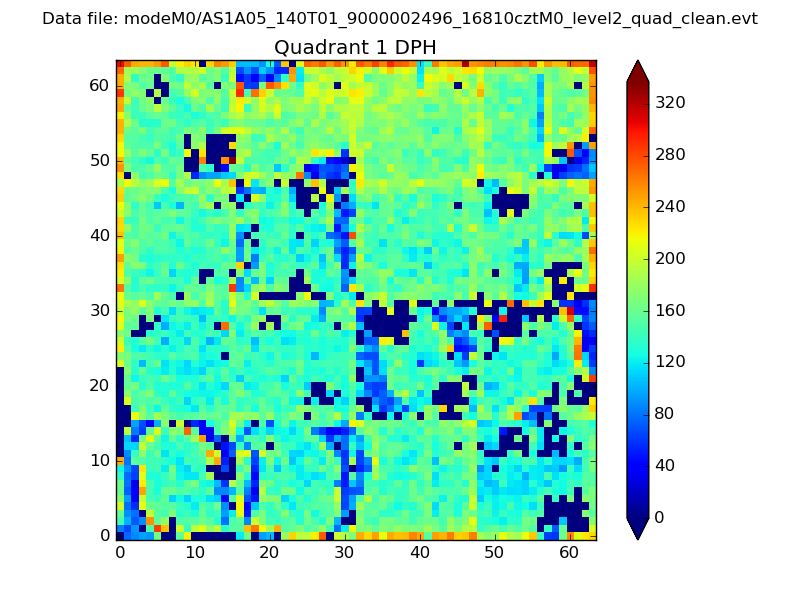
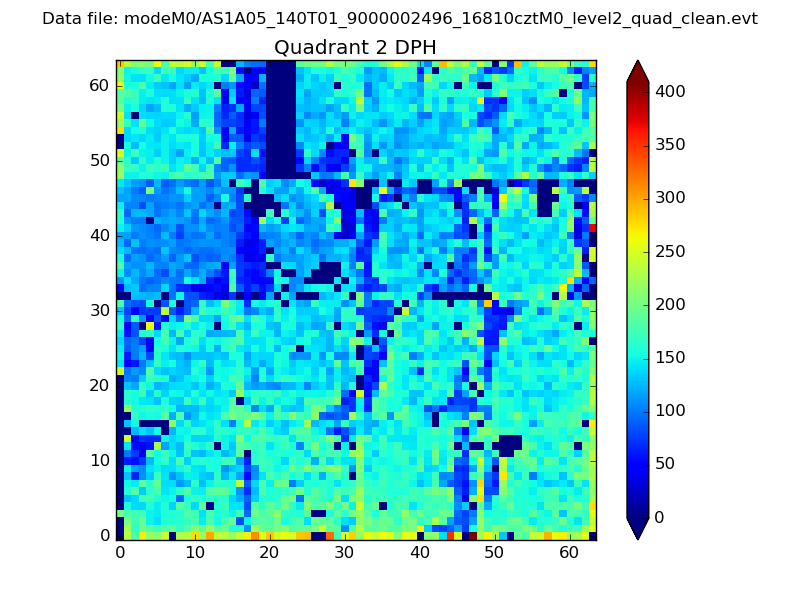
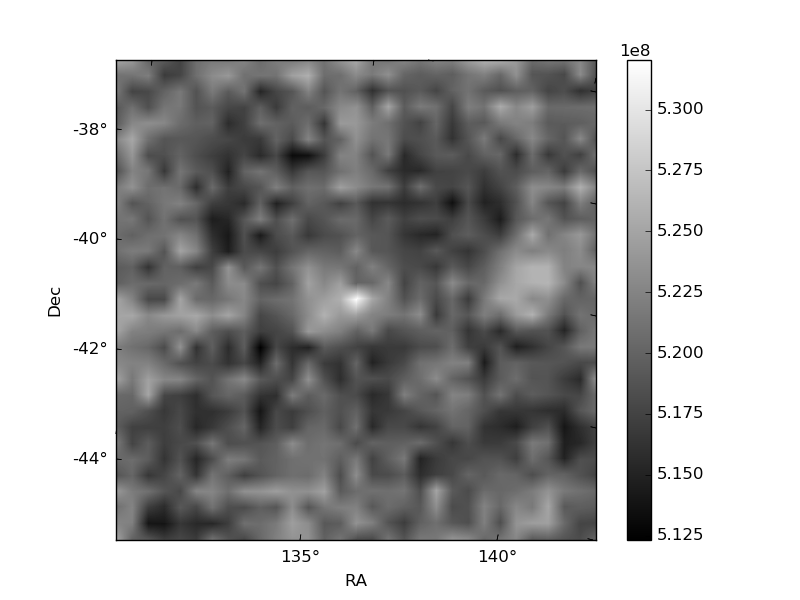
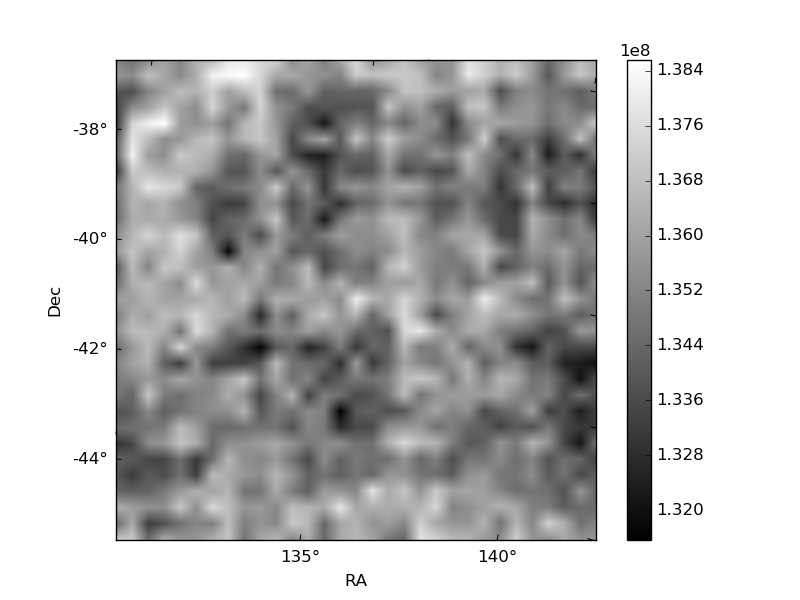
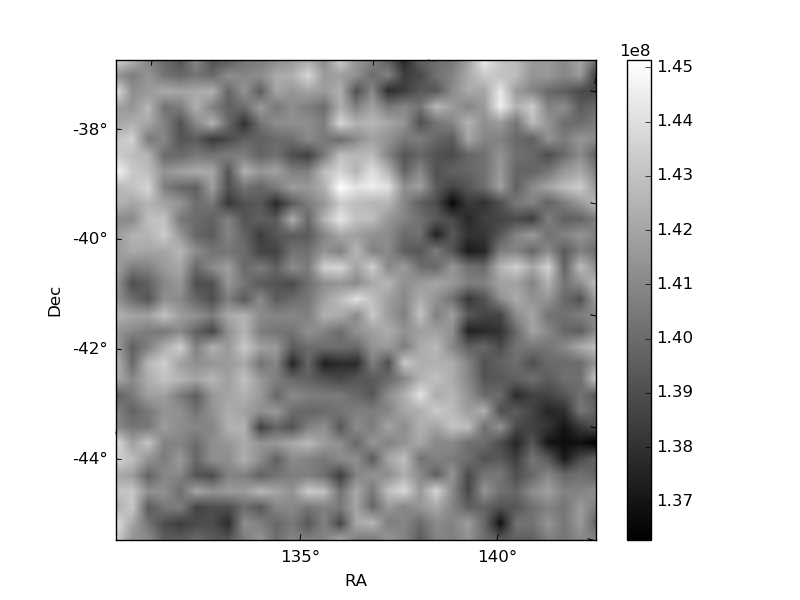
Histogram calculated using DETX and DETY for each event in the final _common_clean file
| Quadrant A |  |
 |
Quadrant B |
|---|---|---|---|
| Quadrant D | 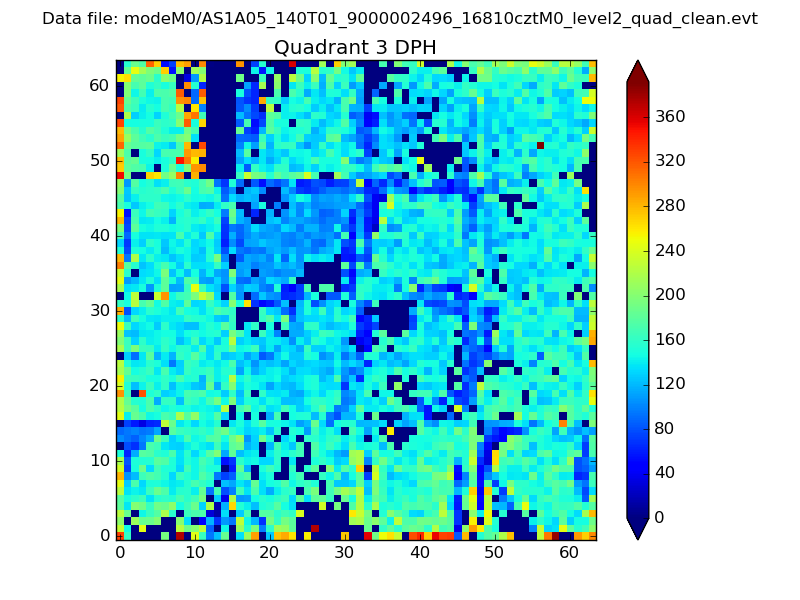 |
 |
Quadrant C |
| Plot type | Count rate plots | Images |
|---|---|---|
| Comparison with Poisson distribution Blue bars denote a histogram of data divided into 1 sec bins. Red curve is a Poisson curve with rate = median count rate of data. |
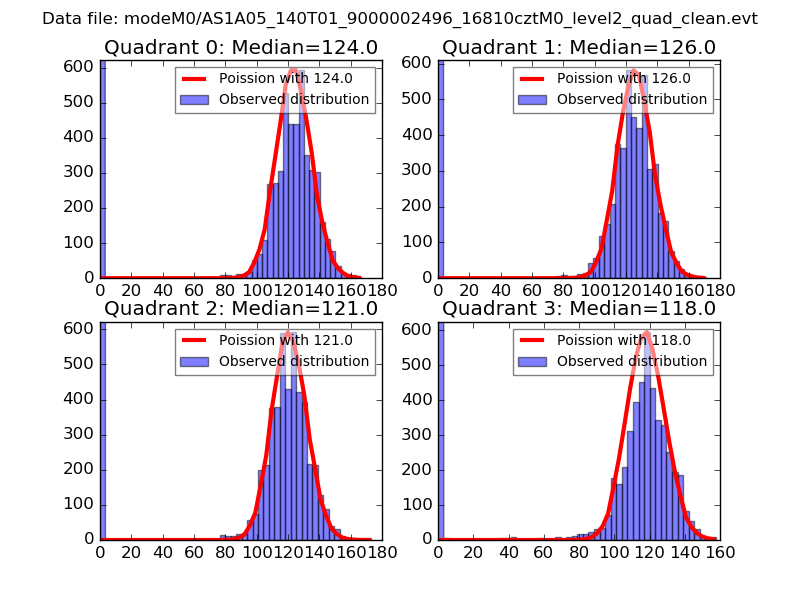 |
 |
| Quadrant-wise count rates Data is divided into 100 sec bins |
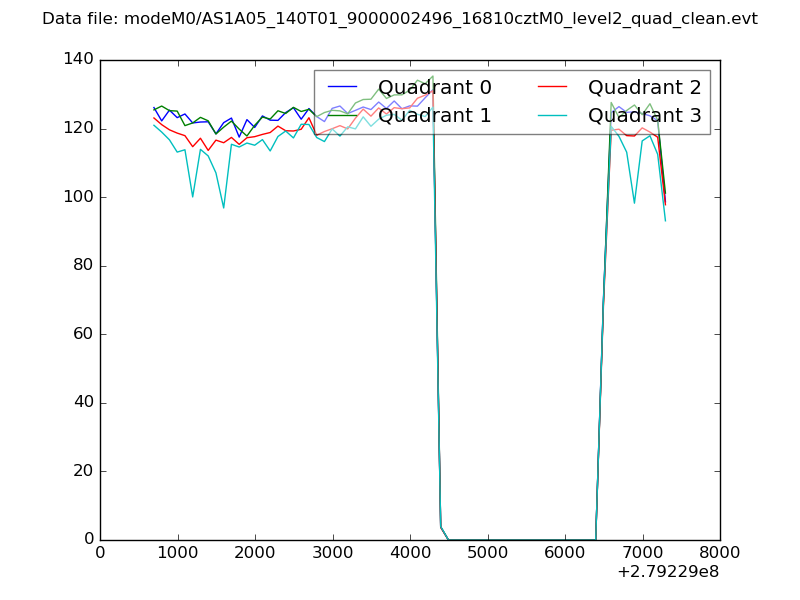 |
|
| Module-wise count rates for Quadrant A Data is divided into 100 sec bins |
 |
 |
| Module-wise count rates for Quadrant B Data is divided into 100 sec bins |
 |
 |
| Module-wise count rates for Quadrant C Data is divided into 100 sec bins |
 |
 |
| Module-wise count rates for Quadrant D Data is divided into 100 sec bins |
 |
 |
| Parameter | Plot |
|---|---|
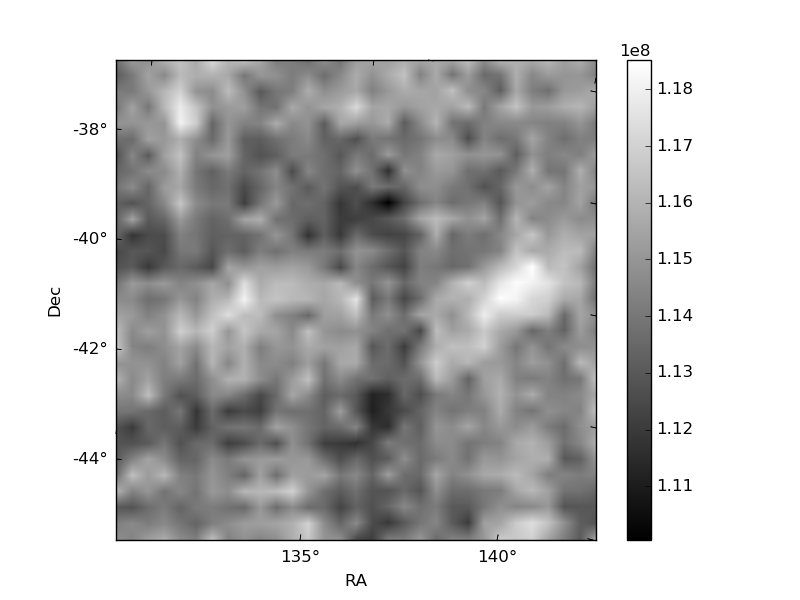
| CZT HV Monitor |  |
| D_VDD | 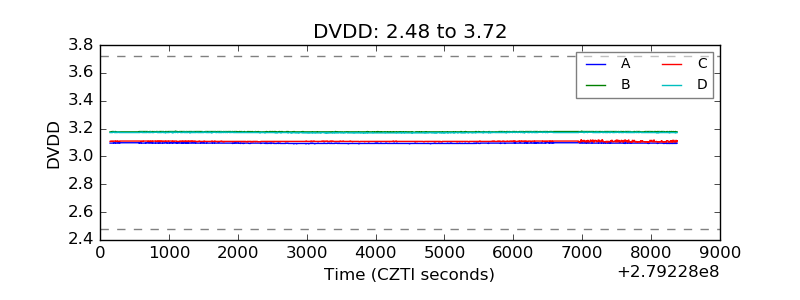 |
| Temperature 1 | 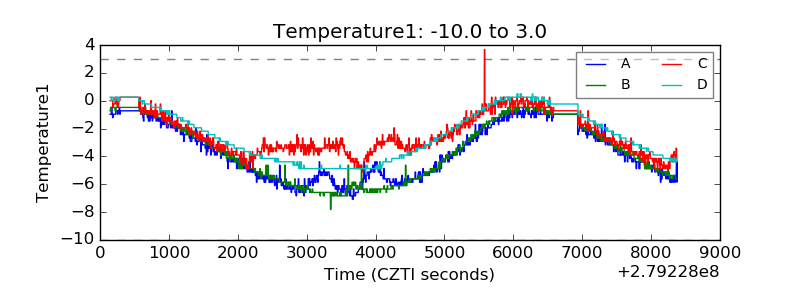 |
| Veto HV Monitor | 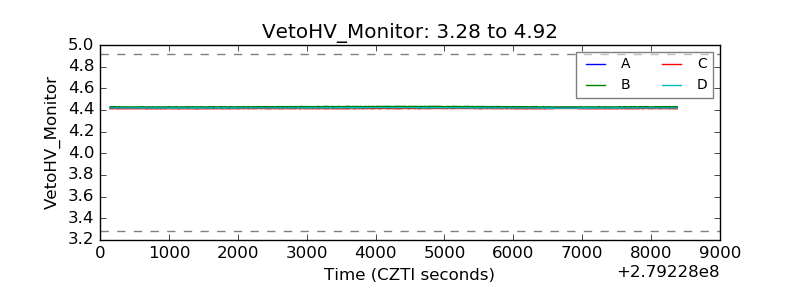 |
| Veto LLD | 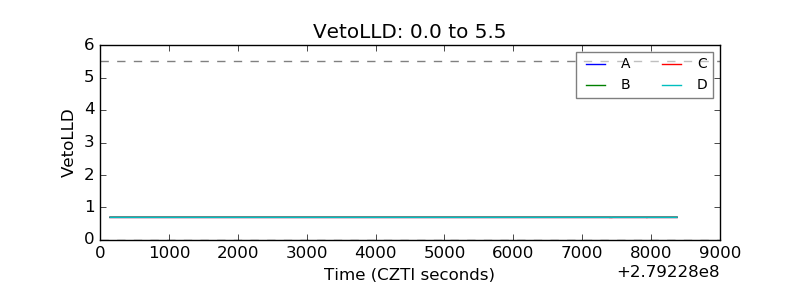 |
| Alpha Counter | 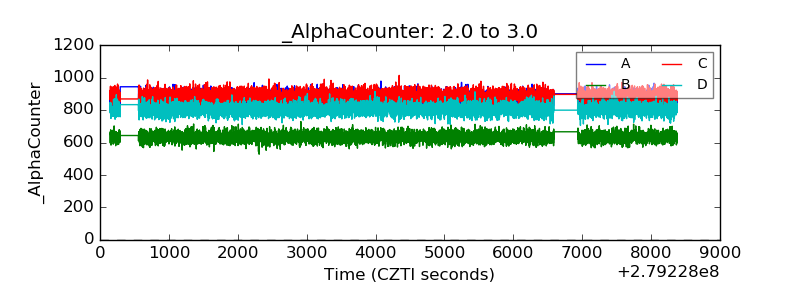 |
| _CPM_Rate | 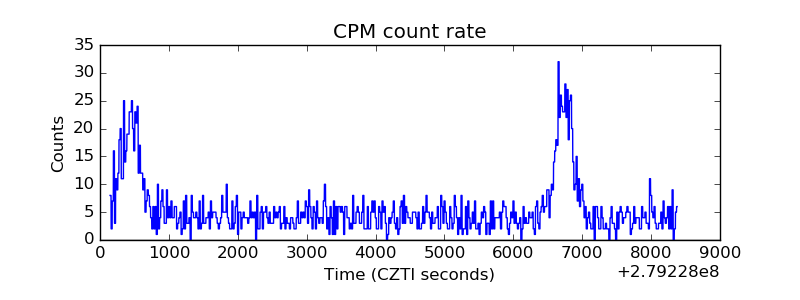 |
| CZT Counter | 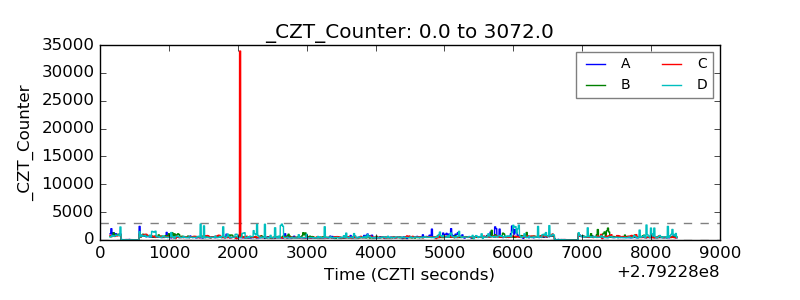 |
| +2.5 Volts monitor |  |
| +5 Volts monitor |  |
| _ROLL_ROT |  |
| _Roll_DEC | 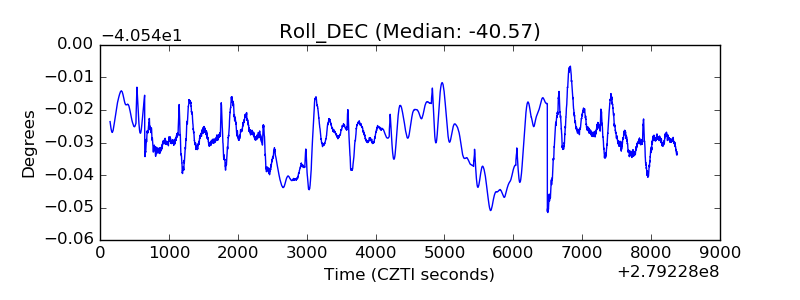 |
| _Roll_RA | 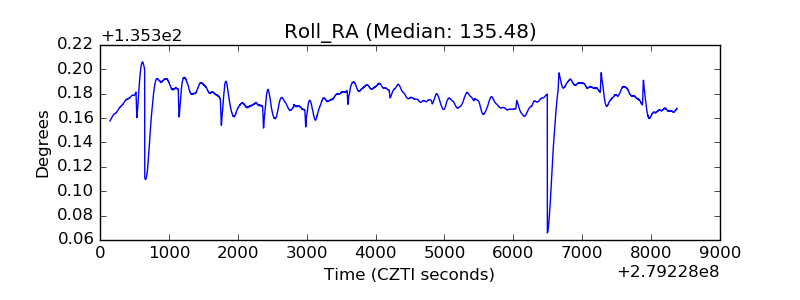 |
| Veto Counter | 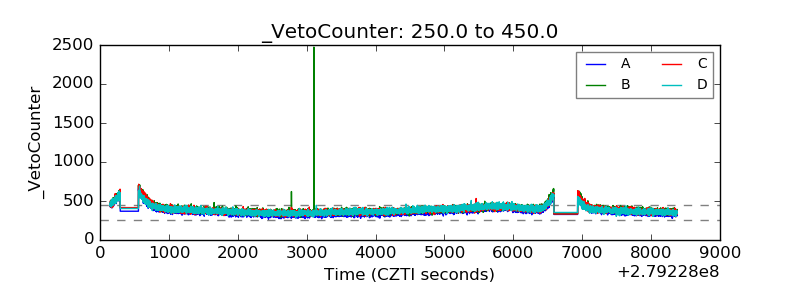 |