| Param | Original file | Final file |
|---|---|---|
| Filename | modeM0/AS1A05_140T01_9000002496_16814cztM0_level2.evt | modeM0/AS1A05_140T01_9000002496_16814cztM0_level2_quad_clean.evt |
| Size (bytes) | 798,747,840 | 141,563,520 |
| Size | 761.7 MB | 135.0 MB |
| Events in quadrant A | 4,888,559 | 908,680 |
| Events in quadrant B | 5,758,252 | 919,105 |
| Events in quadrant C | 5,863,730 | 880,092 |
| Events in quadrant D | 6,971,968 | 855,180 |
| Mode SS | |||
|---|---|---|---|
| Quadrant | BADHDUFLAG | Total packets | Discarded packets |
| A | 0 | 212 | 0 |
| B | 0 | 212 | 0 |
| C | 0 | 212 | 0 |
| D | 0 | 212 | 0 |
| Mode M0 | |||
|---|---|---|---|
| Quadrant | BADHDUFLAG | Total packets | Discarded packets |
| A | 0 | 21654 | 3 |
| B | 0 | 24001 | 2 |
| C | 0 | 24285 | 2 |
| D | 0 | 27750 | 2 |
| Mode M9 | |||
|---|---|---|---|
| Quadrant | BADHDUFLAG | Total packets | Discarded packets |
| A | 0 | 8 | 0 |
| B | 0 | 8 | 0 |
| C | 0 | 8 | 0 |
| D | 0 | 8 | 0 |
| Quadrant | Total seconds | Saturated seconds | Saturation percentage |
|---|---|---|---|
| A | 10458 | 61 | 0.583286% |
| B | 10458 | 200 | 1.912412% |
| C | 10458 | 146 | 1.396060% |
| D | 10458 | 427 | 4.082999% |
Noise dominated data is calculated using 1-second bins in cleaned event files. If a bin has >2000 counts, and if more than 50% of those come from <1% of pixels, then it is considered to be noise-dominated and hence unusable.
| Quadrant | # 1 sec bins | Bins with >0 counts | Bins with >2000 counts | High rate bins dominated by noise | Noise dominated (total time) | Noise dominated (detector-on time) | Marked lightcurve |
|---|---|---|---|---|---|---|---|
| A | 11314 | 10461 | 9 | 9 | 0.08% | 0.09% |  |
| B | 11314 | 10461 | 49 | 49 | 0.43% | 0.47% |  |
| C | 11314 | 10461 | 4 | 4 | 0.04% | 0.04% |  |
| D | 11314 | 10461 | 307 | 307 | 2.71% | 2.93% |  |
Top three noisy pixels from each quadrant. If the there are fewer than three noisy pixels in the level2.evt file, extra rows are filled as -1
| Pixel properties | Quadrant properties | ||||||
|---|---|---|---|---|---|---|---|
| Quadrant | DetID | PixID | Counts | Sigma | Mean | Median | Sigma |
| A | 15 | 174 | 114322 | 449.24 | 1234 | 1204 | 251.8 |
| A | 9 | 143 | 29248 | 111.37 | 1234 | 1204 | 251.8 |
| A | 0 | 226 | 10943 | 38.68 | 1234 | 1204 | 251.8 |
| B | 15 | 35 | 430364 | 1817.83 | 1234 | 1202 | 236.1 |
| B | 0 | 229 | 140627 | 590.57 | 1234 | 1202 | 236.1 |
| B | 0 | 189 | 105963 | 443.74 | 1234 | 1202 | 236.1 |
| C | 3 | 233 | 840713 | 3019.22 | 1186 | 1195 | 278.1 |
| C | 0 | 207 | 199169 | 711.99 | 1186 | 1195 | 278.1 |
| C | 14 | 238 | 179123 | 639.89 | 1186 | 1195 | 278.1 |
| D | 1 | 52 | 1857999 | 6373.93 | 1190 | 1154 | 291.3 |
| D | 12 | 218 | 415118 | 1421.0 | 1190 | 1154 | 291.3 |
| D | 13 | 248 | 55031 | 184.94 | 1190 | 1154 | 291.3 |
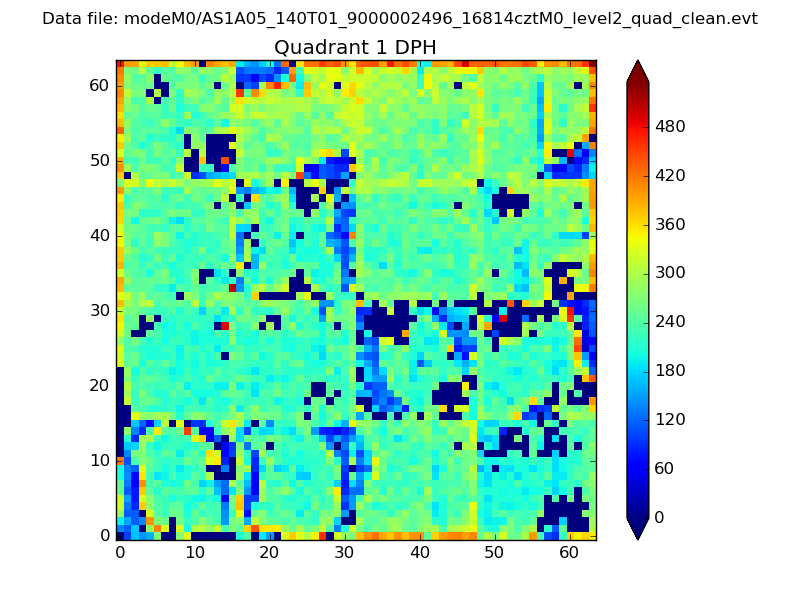
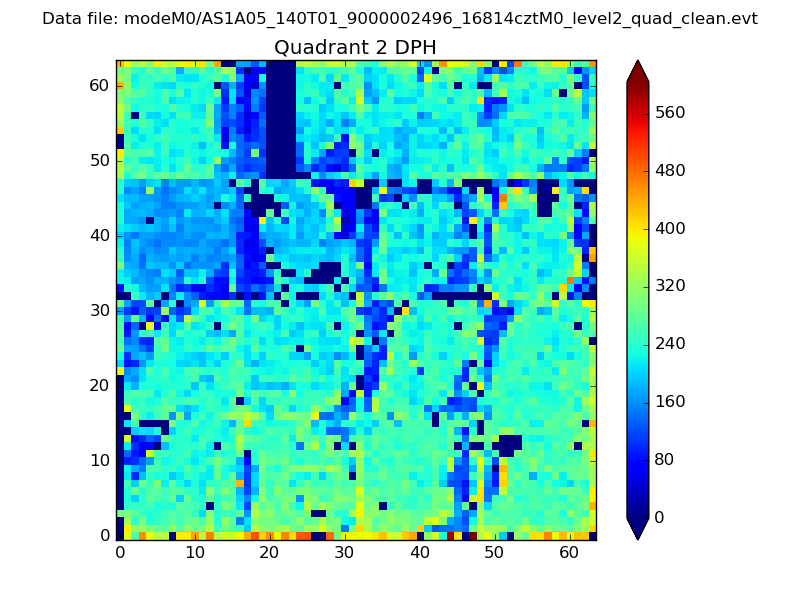
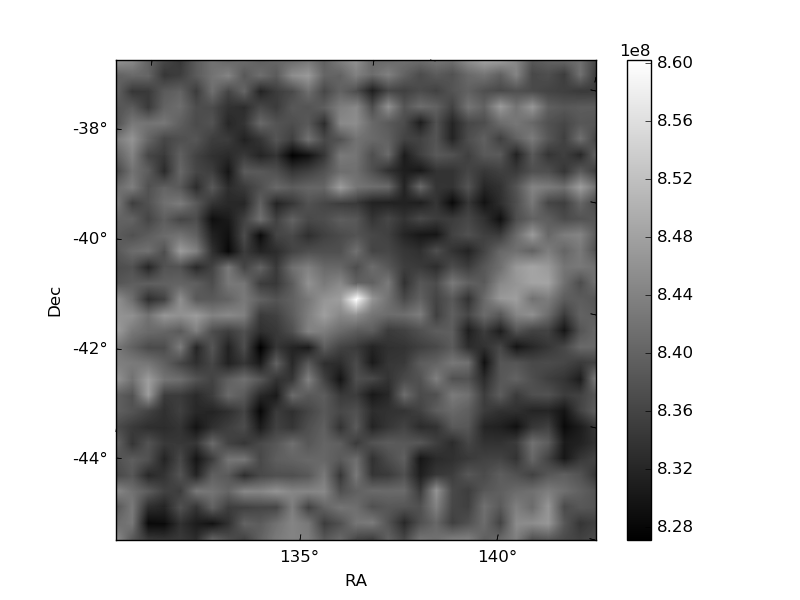
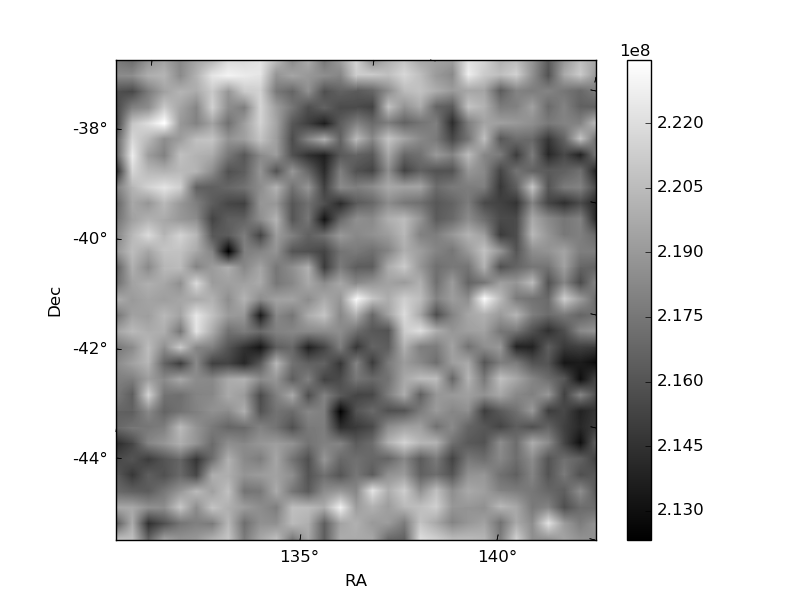
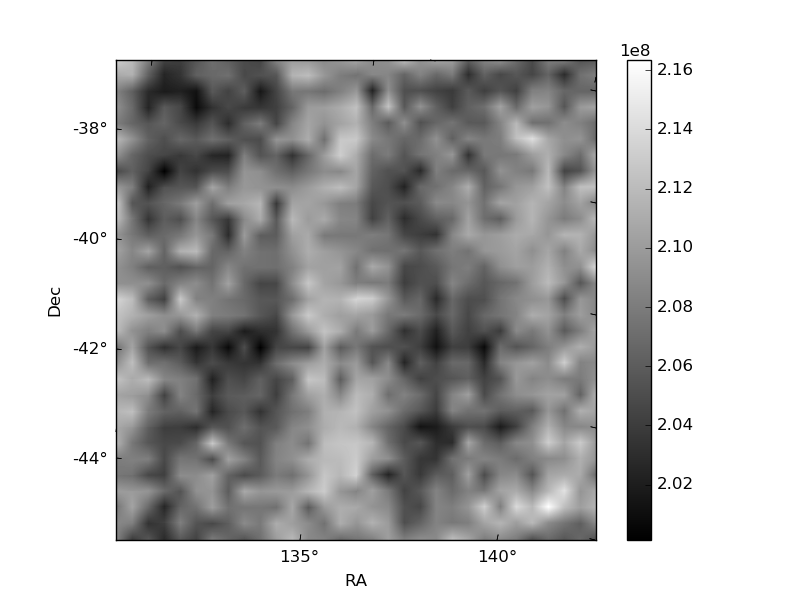
Histogram calculated using DETX and DETY for each event in the final _common_clean file
| Quadrant A |  |
 |
Quadrant B |
|---|---|---|---|
| Quadrant D | 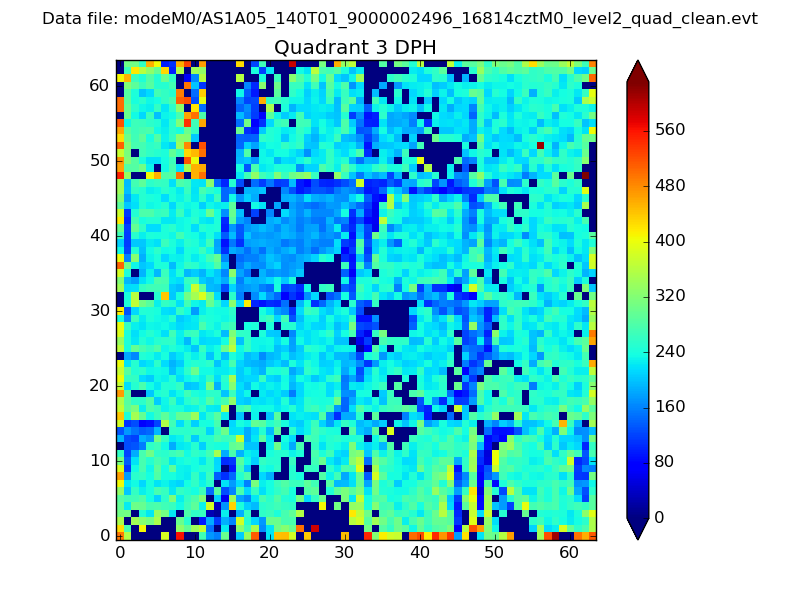 |
 |
Quadrant C |
| Plot type | Count rate plots | Images |
|---|---|---|
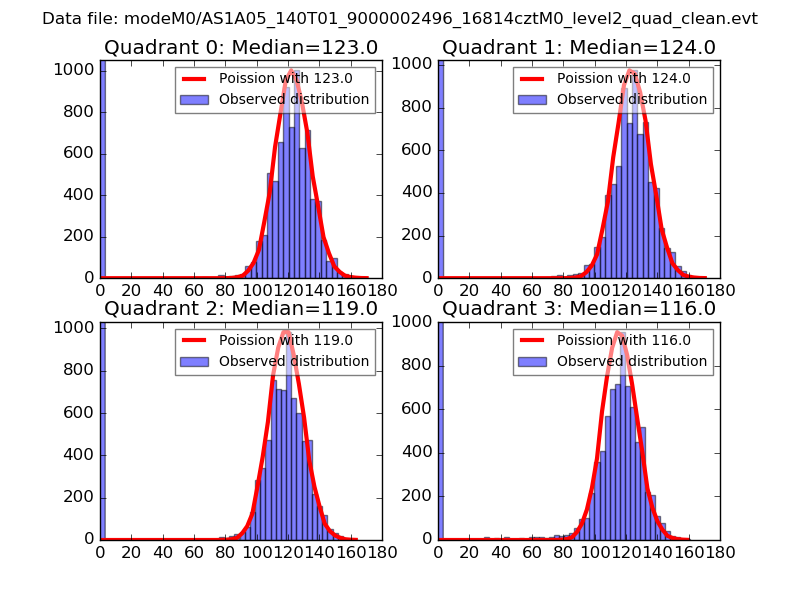
| Comparison with Poisson distribution Blue bars denote a histogram of data divided into 1 sec bins. Red curve is a Poisson curve with rate = median count rate of data. |
 |
 |
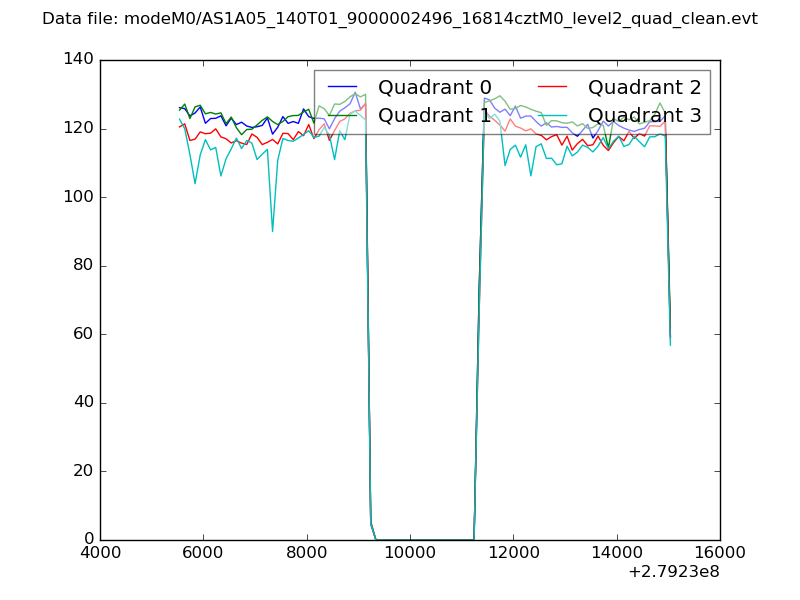
| Quadrant-wise count rates Data is divided into 100 sec bins |
 |
|
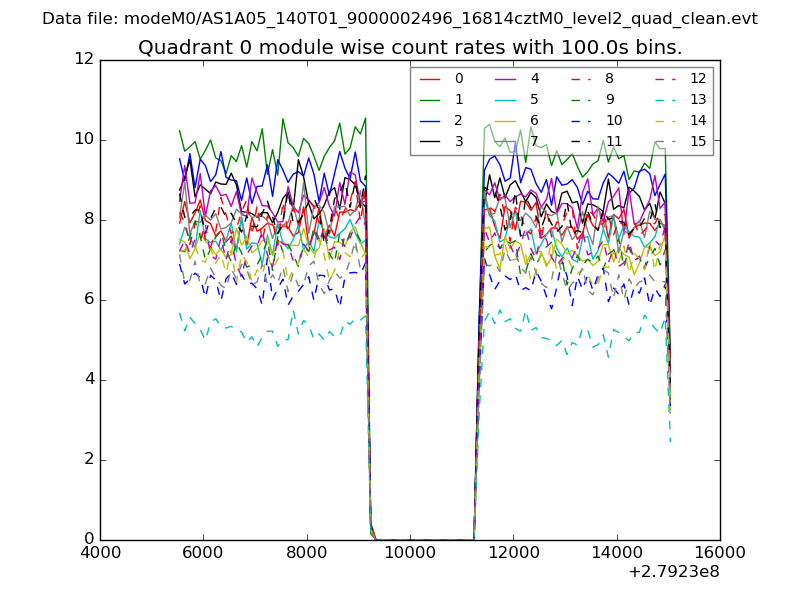
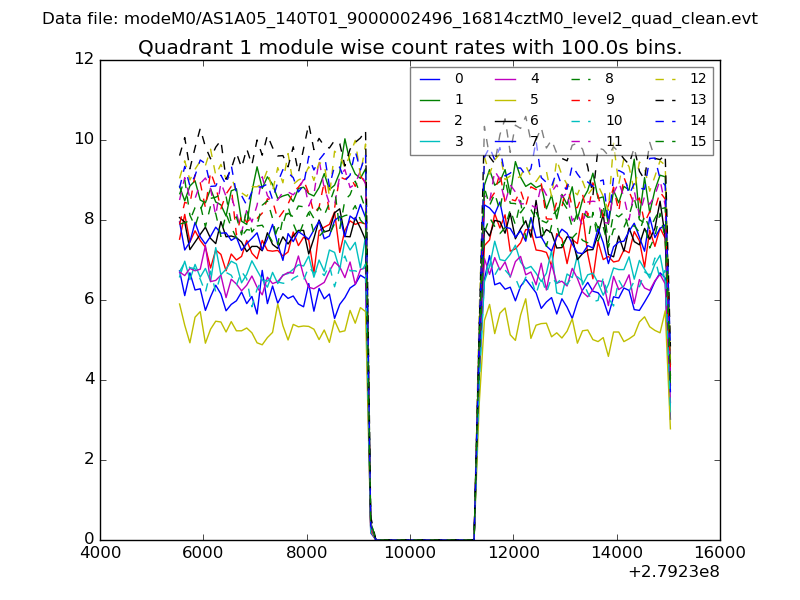
| Module-wise count rates for Quadrant A Data is divided into 100 sec bins |
 |
 |
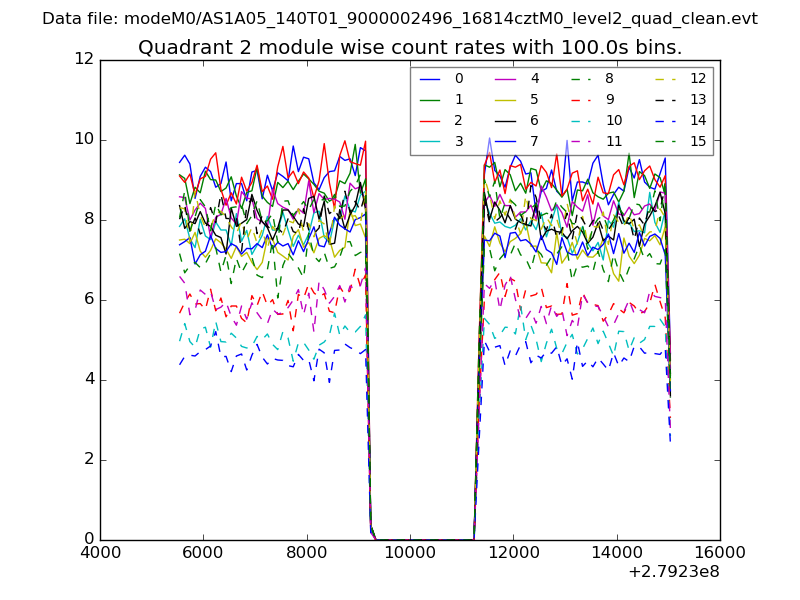
| Module-wise count rates for Quadrant B Data is divided into 100 sec bins |
 |
 |
| Module-wise count rates for Quadrant C Data is divided into 100 sec bins |
 |
 |
| Module-wise count rates for Quadrant D Data is divided into 100 sec bins |
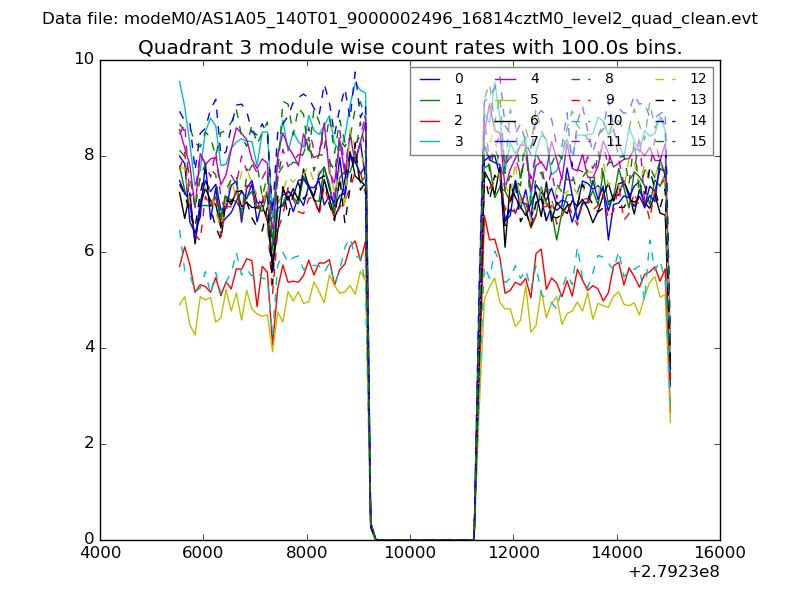 |
 |
| Parameter | Plot |
|---|---|
| CZT HV Monitor | 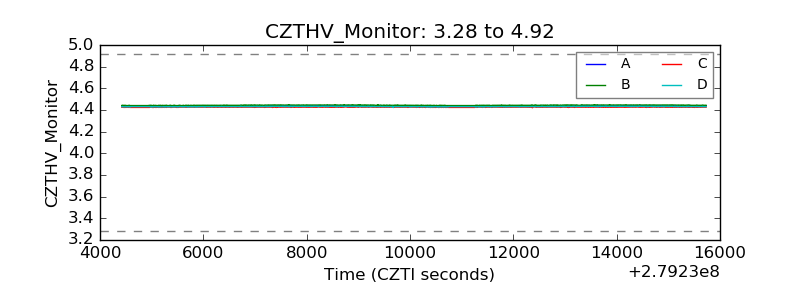 |
| D_VDD | 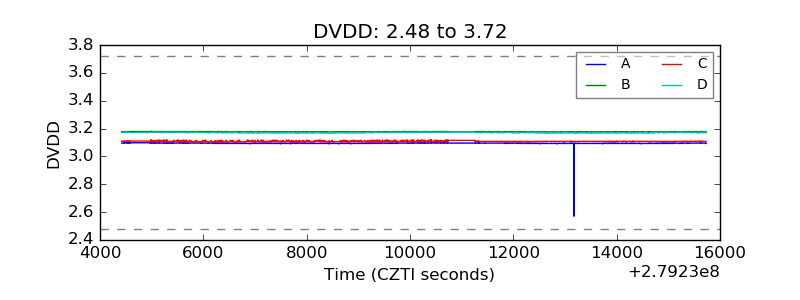 |
| Temperature 1 | 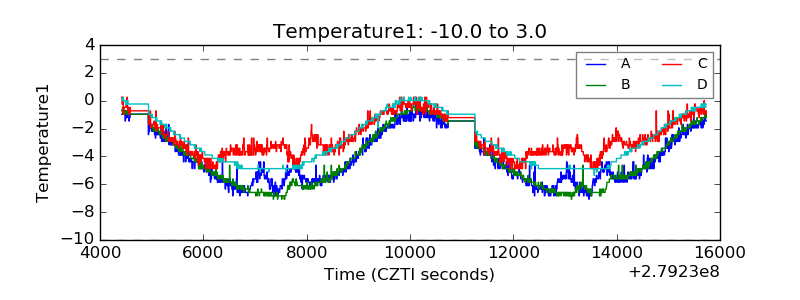 |
| Veto HV Monitor | 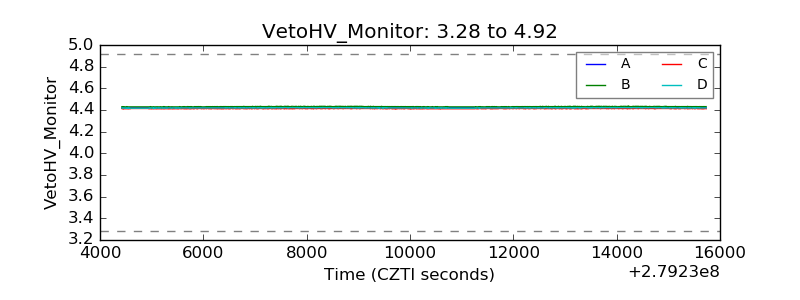 |
| Veto LLD | 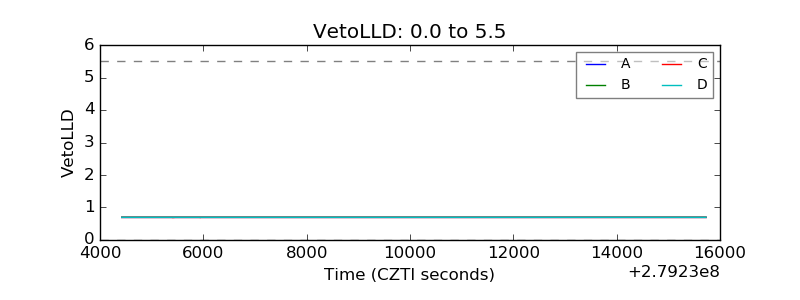 |
| Alpha Counter | 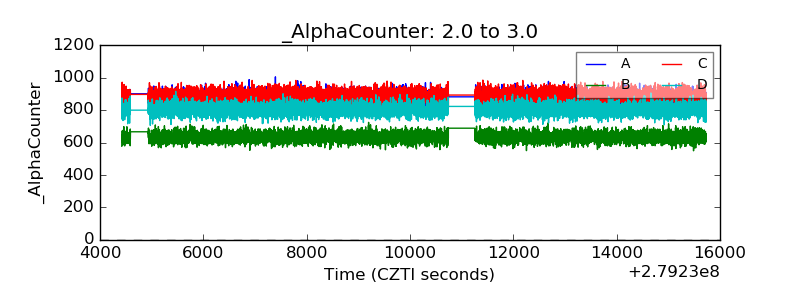 |
| _CPM_Rate | 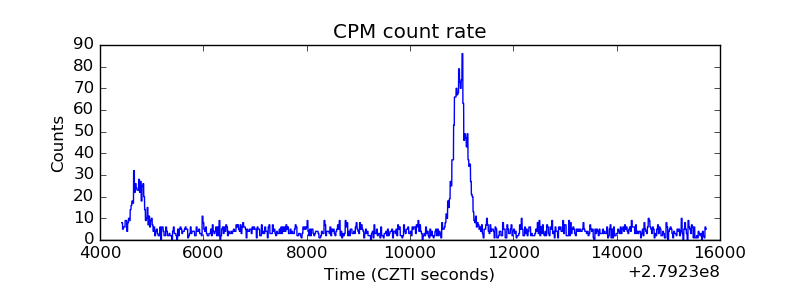 |
| CZT Counter | 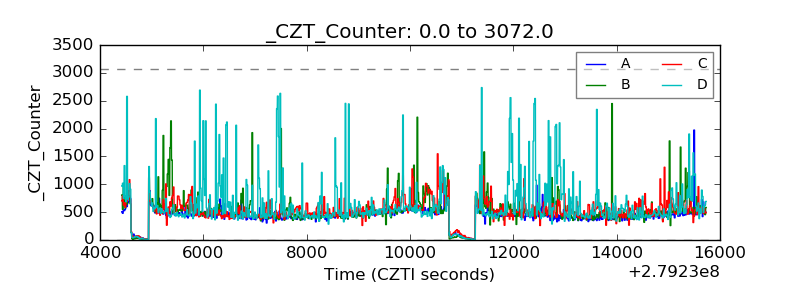 |
| +2.5 Volts monitor |  |
| +5 Volts monitor | 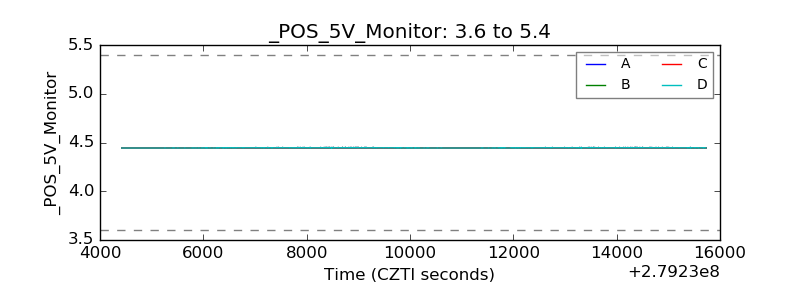 |
| _ROLL_ROT | 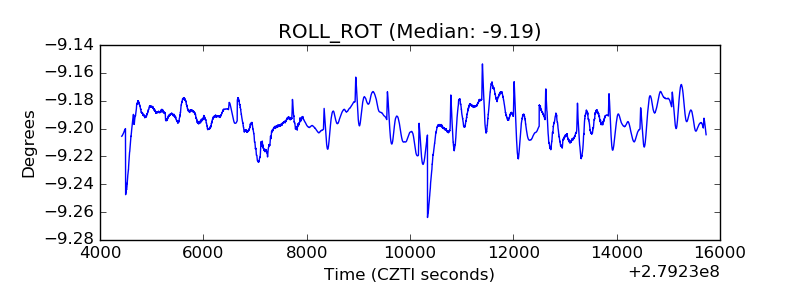 |
| _Roll_DEC | 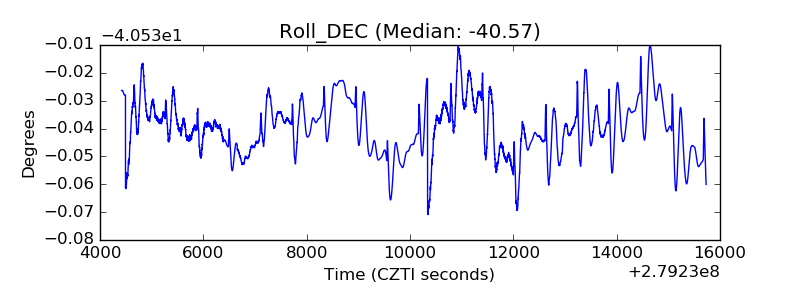 |
| _Roll_RA | 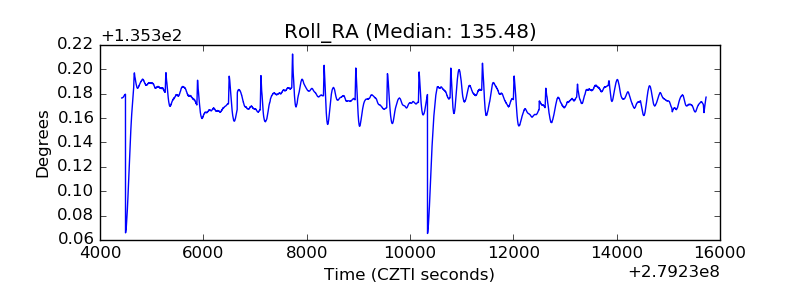 |
| Veto Counter | 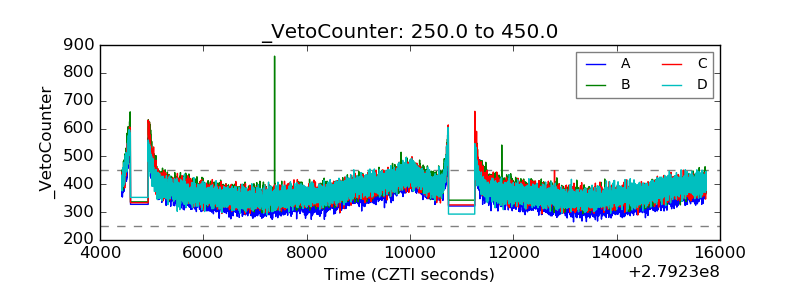 |