| Param | Original file | Final file |
|---|---|---|
| Filename | modeM0/AS1A05_140T01_9000002496_16817cztM0_level2.evt | modeM0/AS1A05_140T01_9000002496_16817cztM0_level2_quad_clean.evt |
| Size (bytes) | 764,694,720 | 104,054,400 |
| Size | 729.3 MB | 99.2 MB |
| Events in quadrant A | 6,314,901 | 635,975 |
| Events in quadrant B | 5,020,966 | 655,203 |
| Events in quadrant C | 4,960,224 | 630,907 |
| Events in quadrant D | 6,255,472 | 605,554 |
| Mode SS | |||
|---|---|---|---|
| Quadrant | BADHDUFLAG | Total packets | Discarded packets |
| A | 0 | 182 | 0 |
| B | 0 | 182 | 0 |
| C | 0 | 182 | 0 |
| D | 0 | 182 | 0 |
| Mode M0 | |||
|---|---|---|---|
| Quadrant | BADHDUFLAG | Total packets | Discarded packets |
| A | 0 | 24534 | 3 |
| B | 0 | 20840 | 2 |
| C | 0 | 20229 | 2 |
| D | 0 | 24616 | 2 |
| Mode M9 | |||
|---|---|---|---|
| Quadrant | BADHDUFLAG | Total packets | Discarded packets |
| A | 0 | 15 | 0 |
| B | 0 | 15 | 0 |
| C | 0 | 15 | 0 |
| D | 0 | 15 | 0 |
| Quadrant | Total seconds | Saturated seconds | Saturation percentage |
|---|---|---|---|
| A | 8986 | 632 | 7.033163% |
| B | 8986 | 95 | 1.057200% |
| C | 8986 | 106 | 1.179613% |
| D | 8986 | 396 | 4.406855% |
Noise dominated data is calculated using 1-second bins in cleaned event files. If a bin has >2000 counts, and if more than 50% of those come from <1% of pixels, then it is considered to be noise-dominated and hence unusable.
| Quadrant | # 1 sec bins | Bins with >0 counts | Bins with >2000 counts | High rate bins dominated by noise | Noise dominated (total time) | Noise dominated (detector-on time) | Marked lightcurve |
|---|---|---|---|---|---|---|---|
| A | 10477 | 8989 | 394 | 394 | 3.76% | 4.38% | 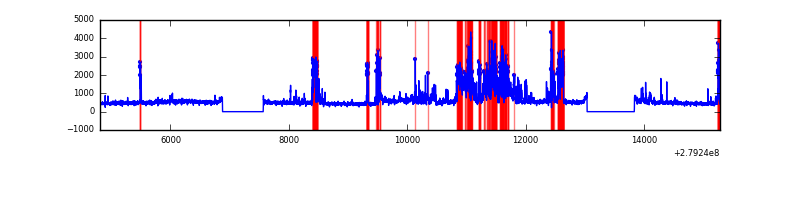 |
| B | 10477 | 8989 | 18 | 18 | 0.17% | 0.20% | 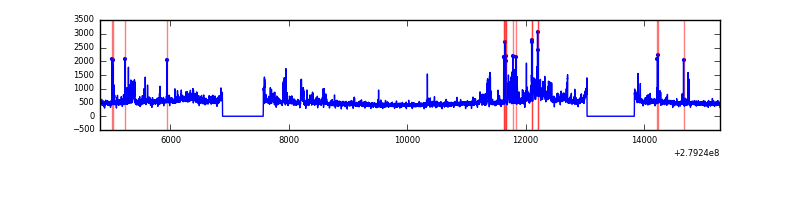 |
| C | 10477 | 8989 | 3 | 3 | 0.03% | 0.03% | 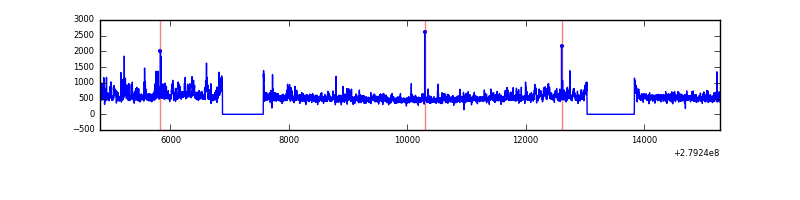 |
| D | 10477 | 8989 | 252 | 252 | 2.41% | 2.80% | 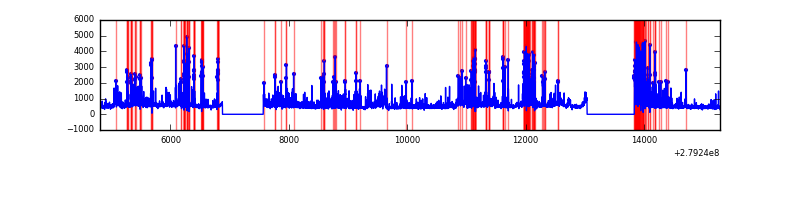 |
Top three noisy pixels from each quadrant. If the there are fewer than three noisy pixels in the level2.evt file, extra rows are filled as -1
| Pixel properties | Quadrant properties | ||||||
|---|---|---|---|---|---|---|---|
| Quadrant | DetID | PixID | Counts | Sigma | Mean | Median | Sigma |
| A | 15 | 174 | 2179177 | 9962.14 | 1072 | 1050 | 218.6 |
| A | 0 | 226 | 9426 | 38.31 | 1072 | 1050 | 218.6 |
| A | 9 | 143 | 9211 | 37.33 | 1072 | 1050 | 218.6 |
| B | 15 | 35 | 294811 | 1391.86 | 1099 | 1070 | 211.0 |
| B | 4 | 216 | 170864 | 804.55 | 1099 | 1070 | 211.0 |
| B | 0 | 229 | 55592 | 258.35 | 1099 | 1070 | 211.0 |
| C | 3 | 233 | 552968 | 2244.09 | 1055 | 1063 | 245.9 |
| C | 14 | 238 | 161853 | 653.78 | 1055 | 1063 | 245.9 |
| C | 0 | 207 | 130508 | 526.33 | 1055 | 1063 | 245.9 |
| D | 1 | 52 | 976962 | 3805.07 | 1052 | 1023 | 256.5 |
| D | 12 | 218 | 912367 | 3553.23 | 1052 | 1023 | 256.5 |
| D | 2 | 33 | 179998 | 697.8 | 1052 | 1023 | 256.5 |
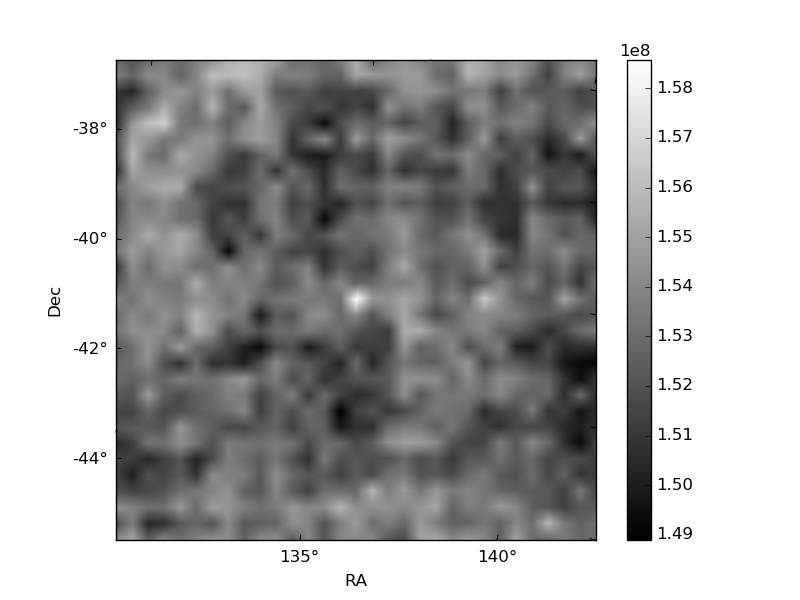
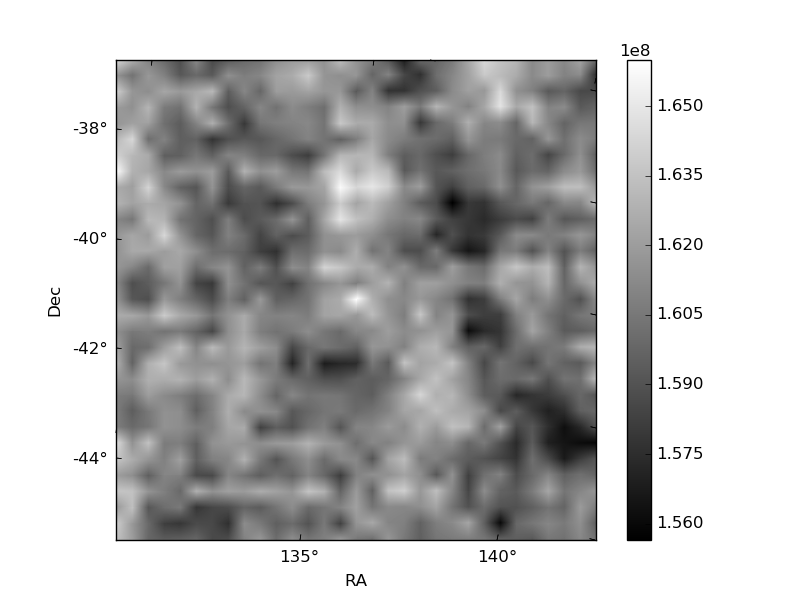
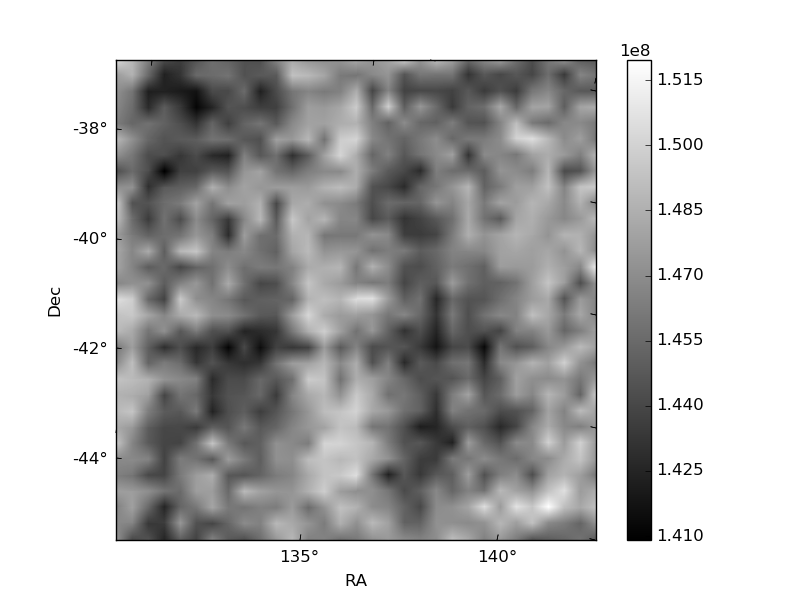
Histogram calculated using DETX and DETY for each event in the final _common_clean file
| Quadrant A | 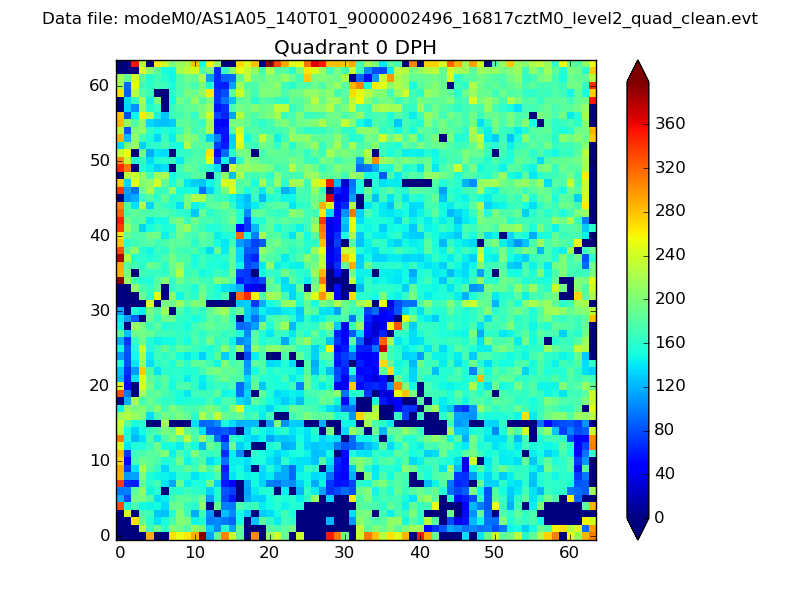 |
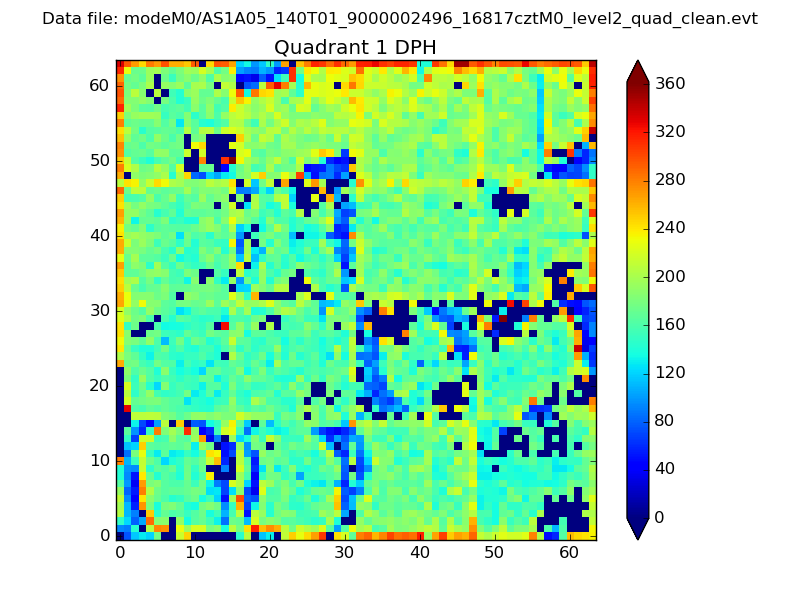 |
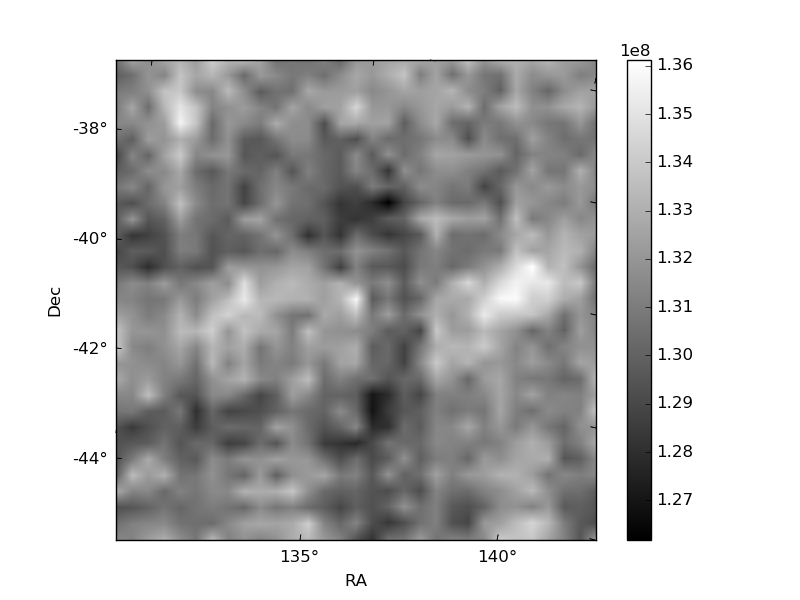
Quadrant B |
|---|---|---|---|
| Quadrant D |  |
 |
Quadrant C |
| Plot type | Count rate plots | Images |
|---|---|---|
| Comparison with Poisson distribution Blue bars denote a histogram of data divided into 1 sec bins. Red curve is a Poisson curve with rate = median count rate of data. |
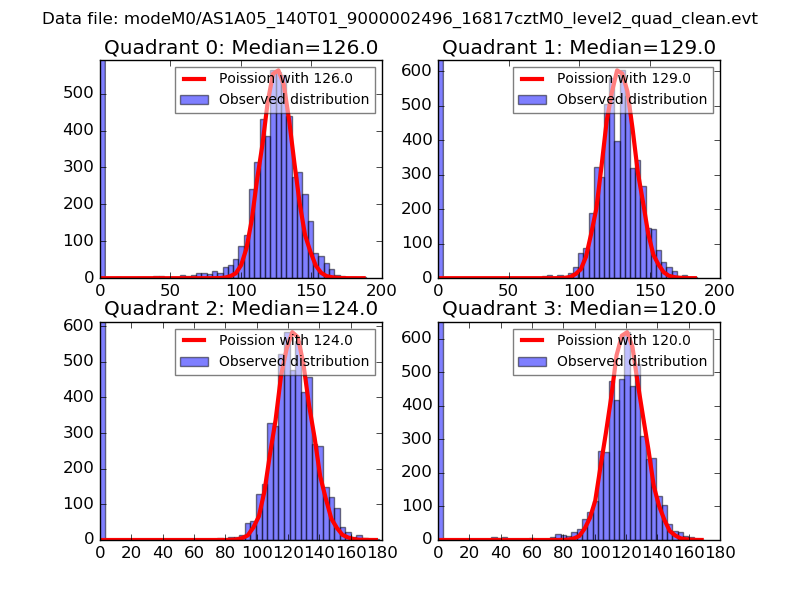 |
 |
| Quadrant-wise count rates Data is divided into 100 sec bins |
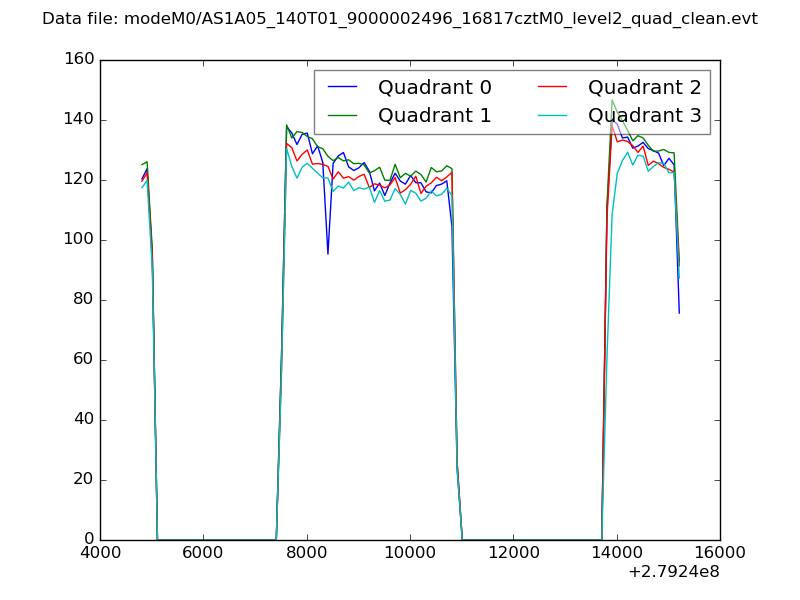 |
|
| Module-wise count rates for Quadrant A Data is divided into 100 sec bins |
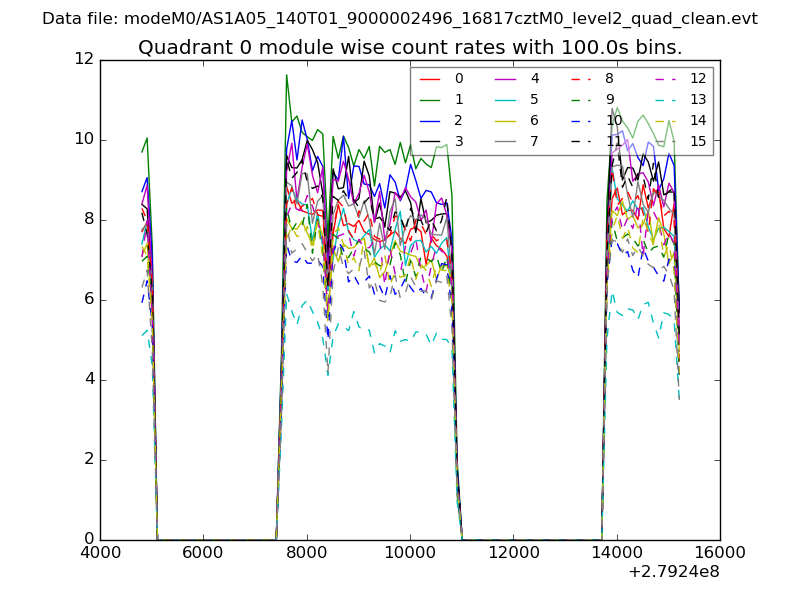 |
 |
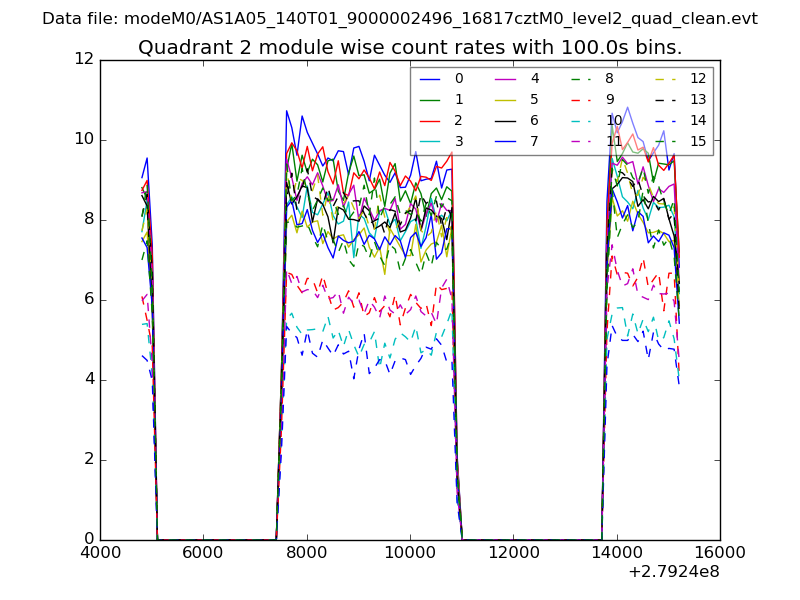
| Module-wise count rates for Quadrant B Data is divided into 100 sec bins |
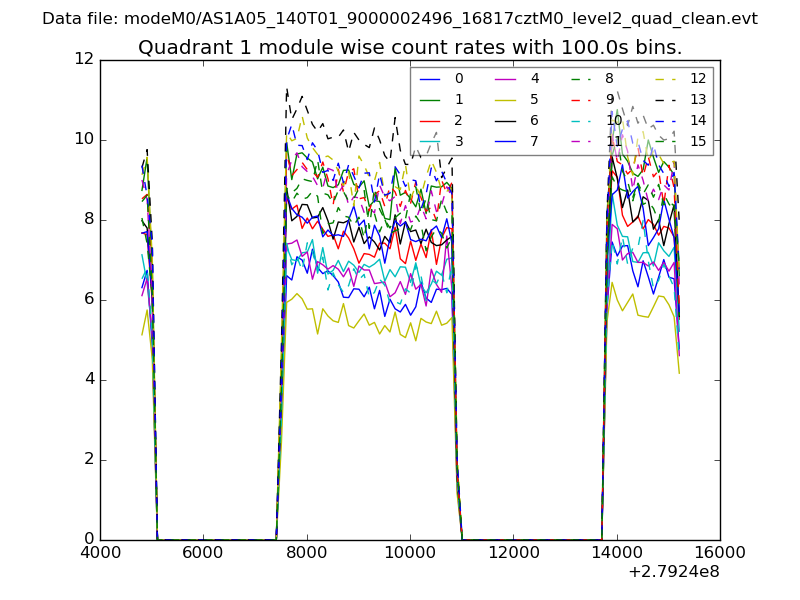 |
 |
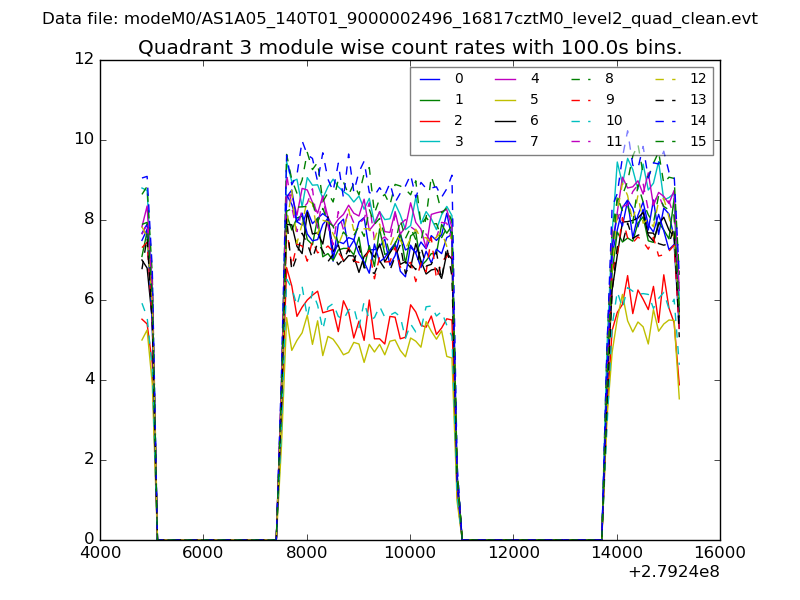
| Module-wise count rates for Quadrant C Data is divided into 100 sec bins |
 |
 |
| Module-wise count rates for Quadrant D Data is divided into 100 sec bins |
 |
 |
| Parameter | Plot |
|---|---|
| CZT HV Monitor | 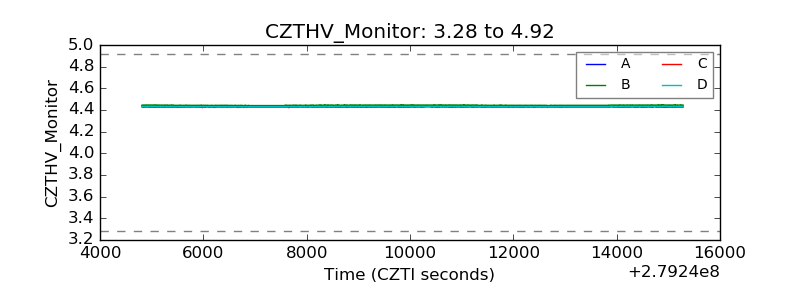 |
| D_VDD | 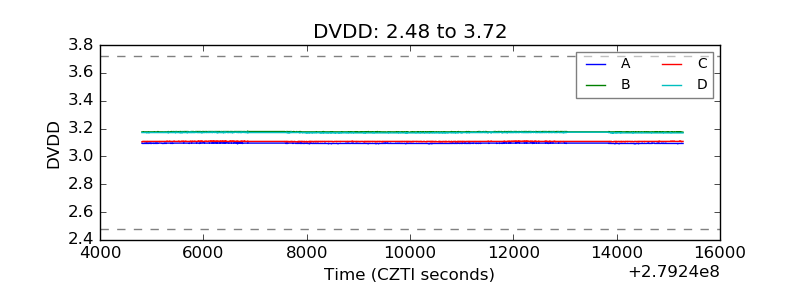 |
| Temperature 1 | 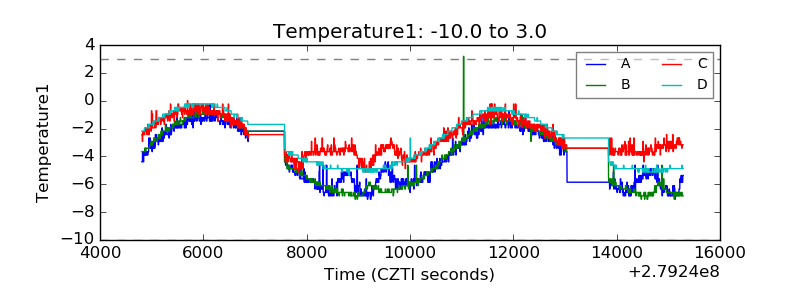 |
| Veto HV Monitor | 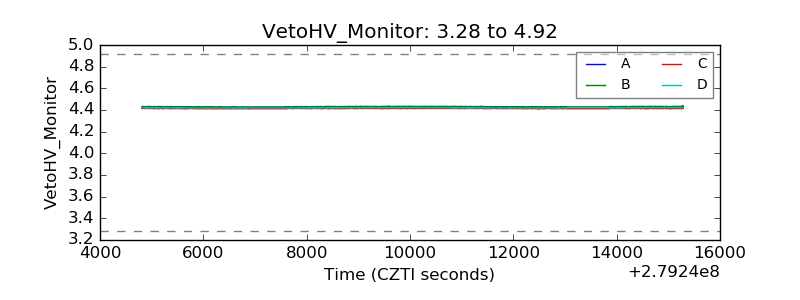 |
| Veto LLD | 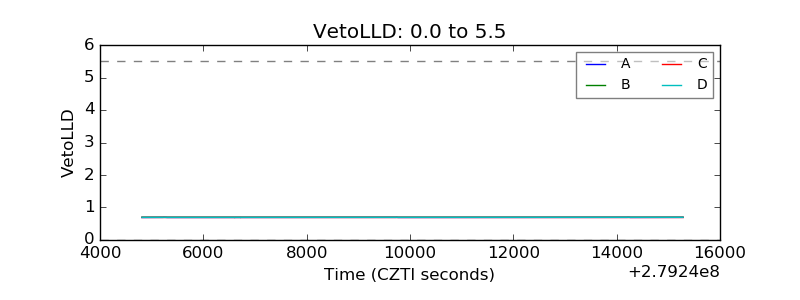 |
| Alpha Counter | 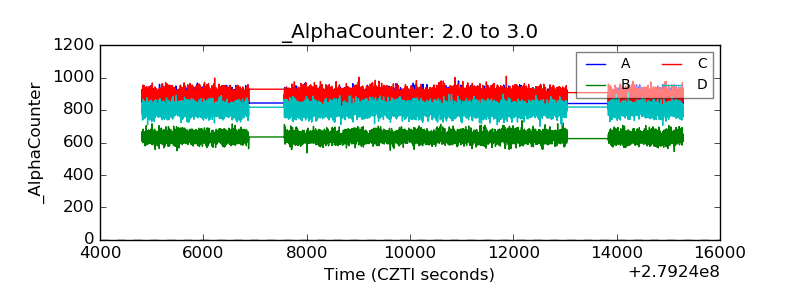 |
| _CPM_Rate | 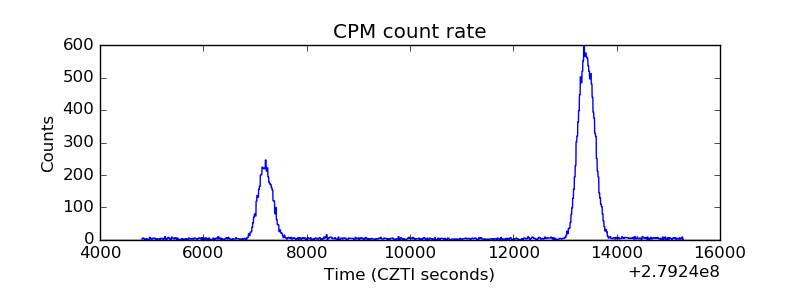 |
| CZT Counter |  |
| +2.5 Volts monitor |  |
| +5 Volts monitor | 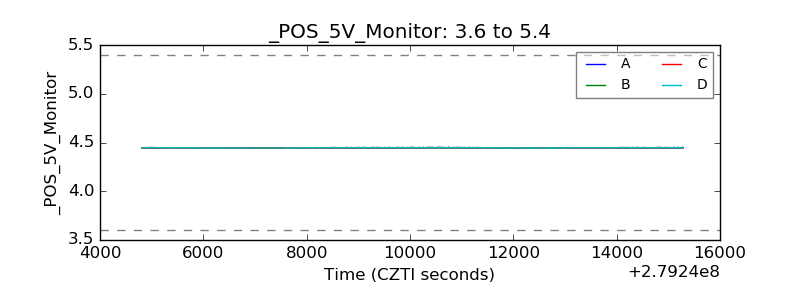 |
| _ROLL_ROT | 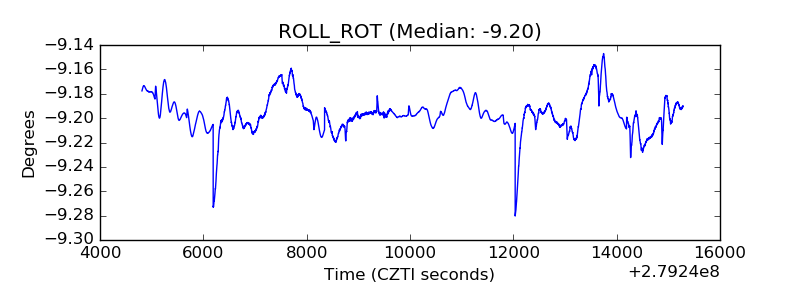 |
| _Roll_DEC | 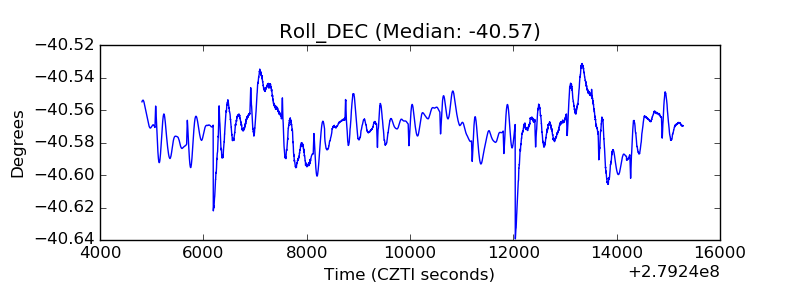 |
| _Roll_RA | 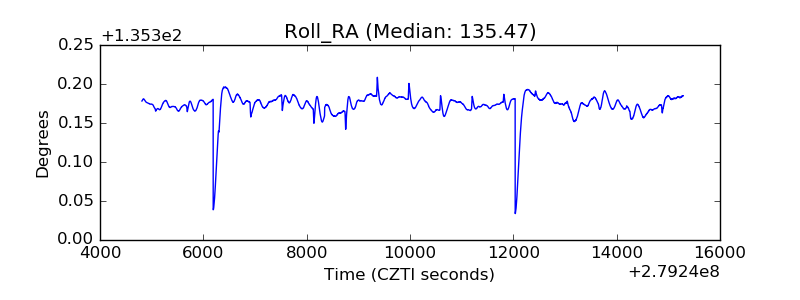 |
| Veto Counter | 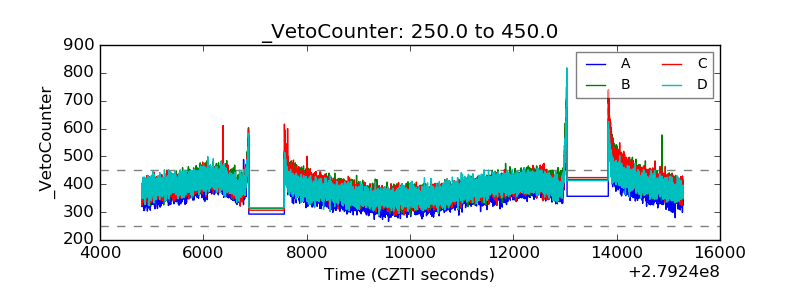 |