| Param | Original file | Final file |
|---|---|---|
| Filename | modeM0/AS1A05_140T01_9000002496_16818cztM0_level2.evt | modeM0/AS1A05_140T01_9000002496_16818cztM0_level2_quad_clean.evt |
| Size (bytes) | 1,769,466,240 | 278,452,800 |
| Size | 1.6 GB | 265.6 MB |
| Events in quadrant A | 12,704,268 | 1,761,449 |
| Events in quadrant B | 11,859,076 | 1,813,197 |
| Events in quadrant C | 11,236,877 | 1,746,182 |
| Events in quadrant D | 16,377,322 | 1,670,744 |
| Mode SS | |||
|---|---|---|---|
| Quadrant | BADHDUFLAG | Total packets | Discarded packets |
| A | 0 | 426 | 0 |
| B | 0 | 426 | 0 |
| C | 0 | 426 | 0 |
| D | 0 | 426 | 0 |
| Mode M0 | |||
|---|---|---|---|
| Quadrant | BADHDUFLAG | Total packets | Discarded packets |
| A | 0 | 50887 | 5 |
| B | 0 | 48380 | 4 |
| C | 0 | 46021 | 4 |
| D | 0 | 62676 | 4 |
| Mode M9 | |||
|---|---|---|---|
| Quadrant | BADHDUFLAG | Total packets | Discarded packets |
| A | 0 | 46 | 0 |
| B | 0 | 46 | 0 |
| C | 0 | 46 | 0 |
| D | 0 | 46 | 0 |
| Quadrant | Total seconds | Saturated seconds | Saturation percentage |
|---|---|---|---|
| A | 20944 | 722 | 3.447288% |
| B | 20944 | 317 | 1.513560% |
| C | 20944 | 272 | 1.298701% |
| D | 20944 | 1252 | 5.977846% |
Noise dominated data is calculated using 1-second bins in cleaned event files. If a bin has >2000 counts, and if more than 50% of those come from <1% of pixels, then it is considered to be noise-dominated and hence unusable.
| Quadrant | # 1 sec bins | Bins with >0 counts | Bins with >2000 counts | High rate bins dominated by noise | Noise dominated (total time) | Noise dominated (detector-on time) | Marked lightcurve |
|---|---|---|---|---|---|---|---|
| A | 25456 | 20949 | 400 | 400 | 1.57% | 1.91% | 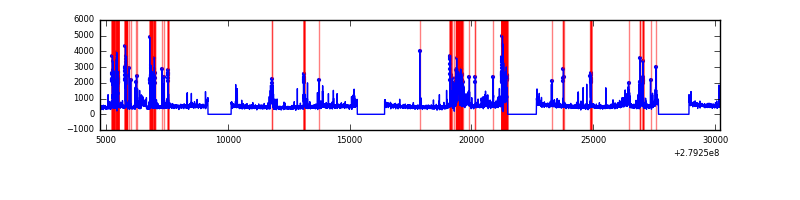 |
| B | 25456 | 20949 | 59 | 59 | 0.23% | 0.28% | 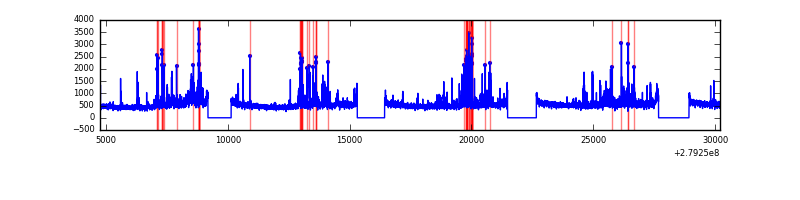 |
| C | 25456 | 20949 | 1 | 1 | 0.00% | 0.00% | 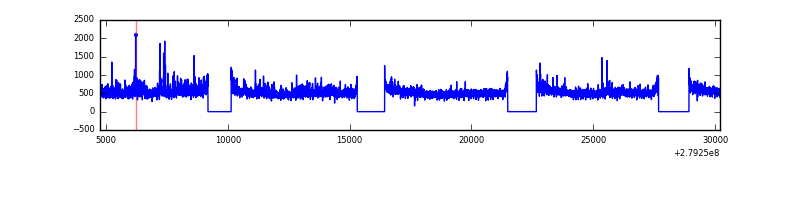 |
| D | 25456 | 20949 | 870 | 870 | 3.42% | 4.15% | 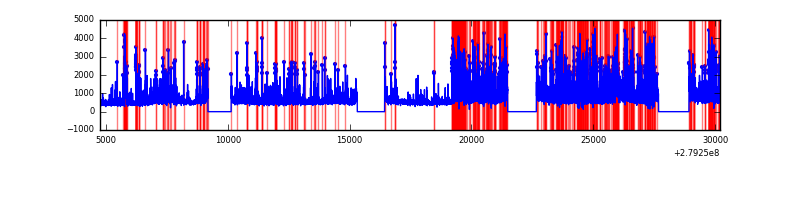 |
Top three noisy pixels from each quadrant. If the there are fewer than three noisy pixels in the level2.evt file, extra rows are filled as -1
| Pixel properties | Quadrant properties | ||||||
|---|---|---|---|---|---|---|---|
| Quadrant | DetID | PixID | Counts | Sigma | Mean | Median | Sigma |
| A | 15 | 174 | 2461776 | 4699.9 | 2623 | 2574 | 523.2 |
| A | 9 | 143 | 166632 | 313.54 | 2623 | 2574 | 523.2 |
| A | 0 | 226 | 22987 | 39.01 | 2623 | 2574 | 523.2 |
| B | 15 | 35 | 535535 | 1083.67 | 2629 | 2569 | 491.8 |
| B | 7 | 220 | 286454 | 577.22 | 2629 | 2569 | 491.8 |
| B | 0 | 189 | 233047 | 468.63 | 2629 | 2569 | 491.8 |
| C | 3 | 233 | 614103 | 1039.11 | 2558 | 2582 | 588.5 |
| C | 14 | 238 | 397163 | 670.48 | 2558 | 2582 | 588.5 |
| C | 0 | 207 | 248932 | 418.6 | 2558 | 2582 | 588.5 |
| D | 1 | 52 | 5202371 | 8359.5 | 2552 | 2479 | 622.0 |
| D | 15 | 0 | 525208 | 840.35 | 2552 | 2479 | 622.0 |
| D | 2 | 33 | 461111 | 737.31 | 2552 | 2479 | 622.0 |
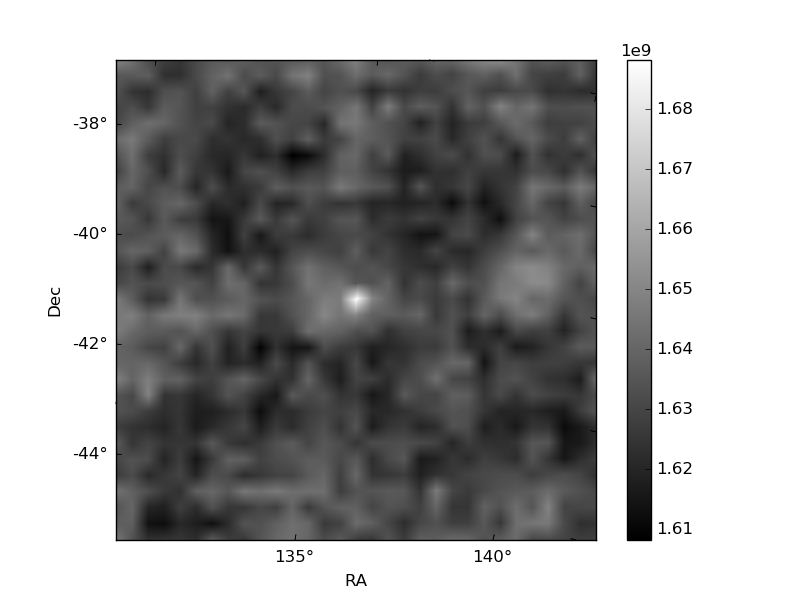
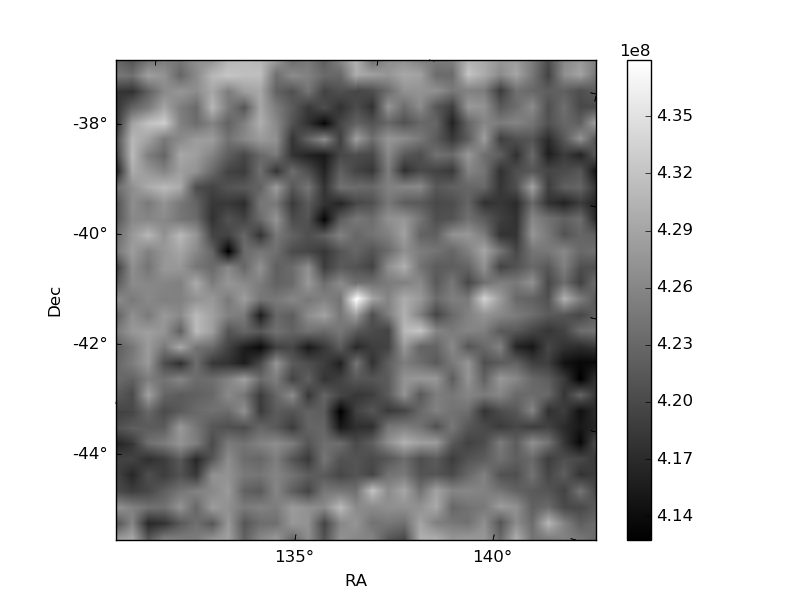
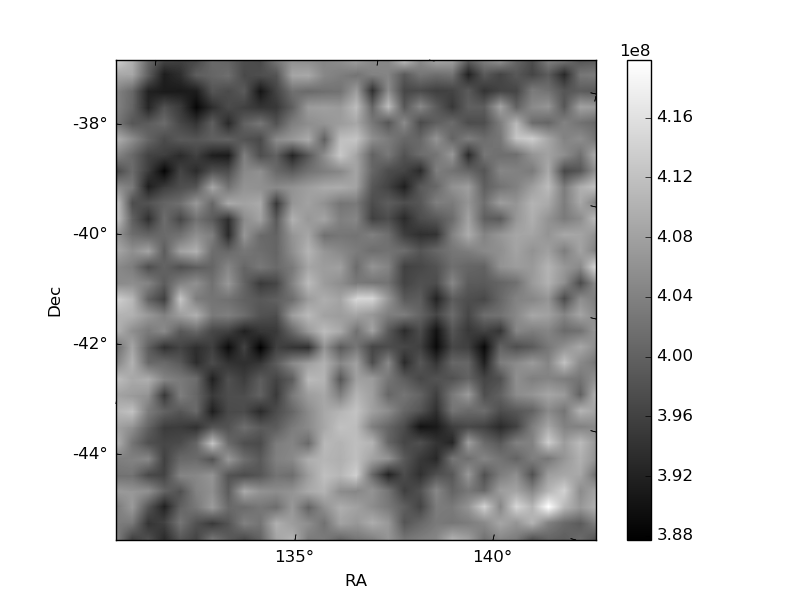
Histogram calculated using DETX and DETY for each event in the final _common_clean file
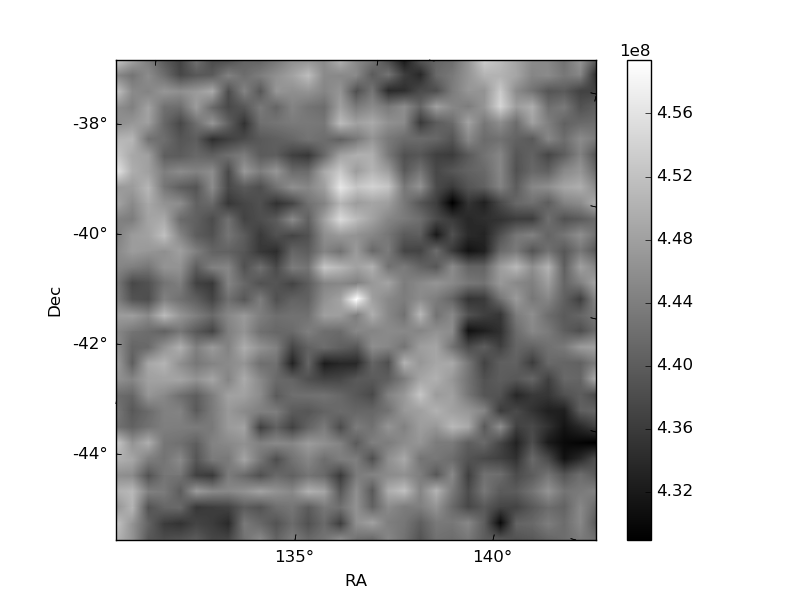
| Quadrant A | 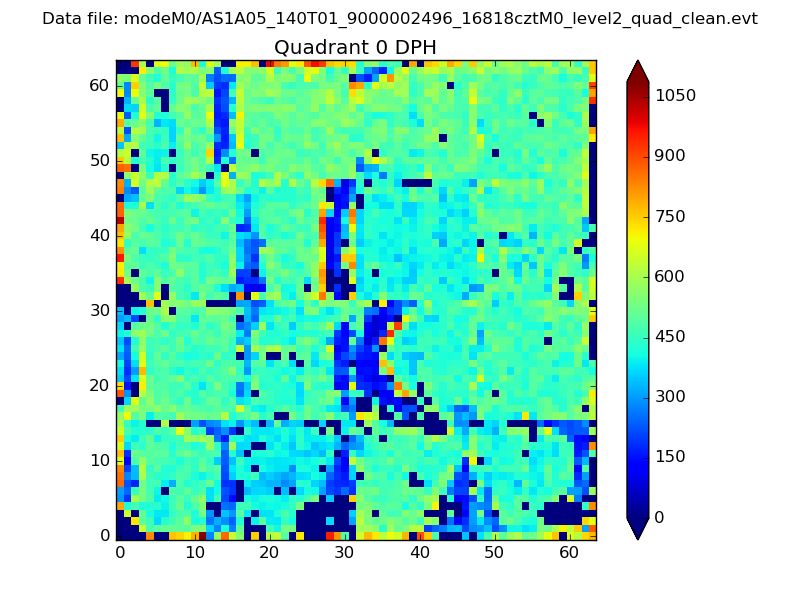 |
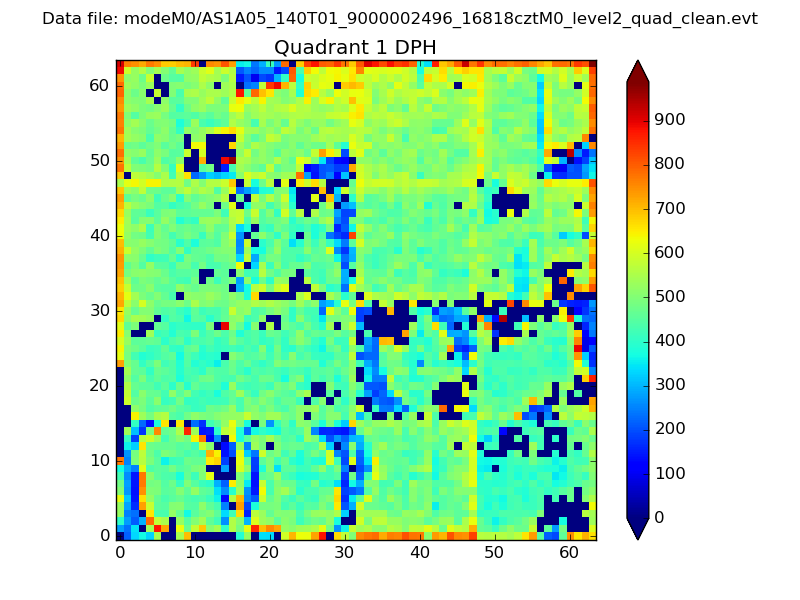 |
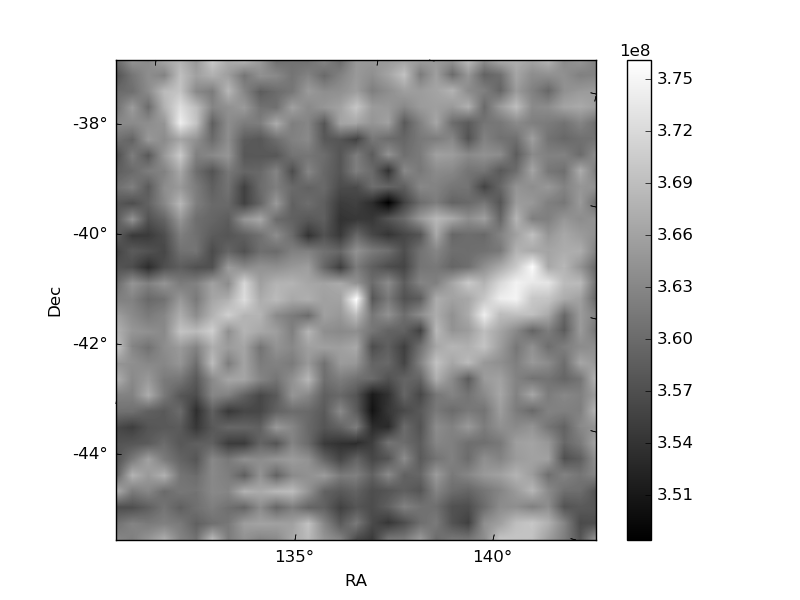
Quadrant B |
|---|---|---|---|
| Quadrant D | 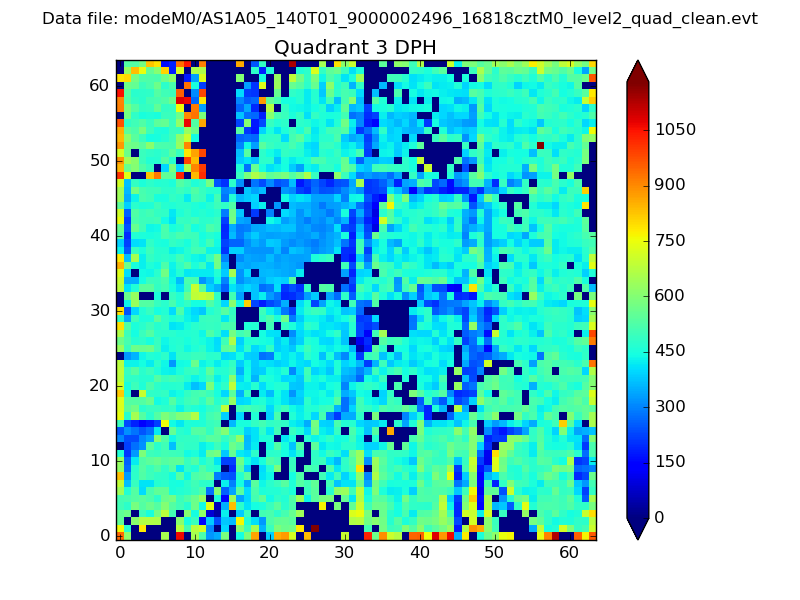 |
 |
Quadrant C |
| Plot type | Count rate plots | Images |
|---|---|---|
| Comparison with Poisson distribution Blue bars denote a histogram of data divided into 1 sec bins. Red curve is a Poisson curve with rate = median count rate of data. |
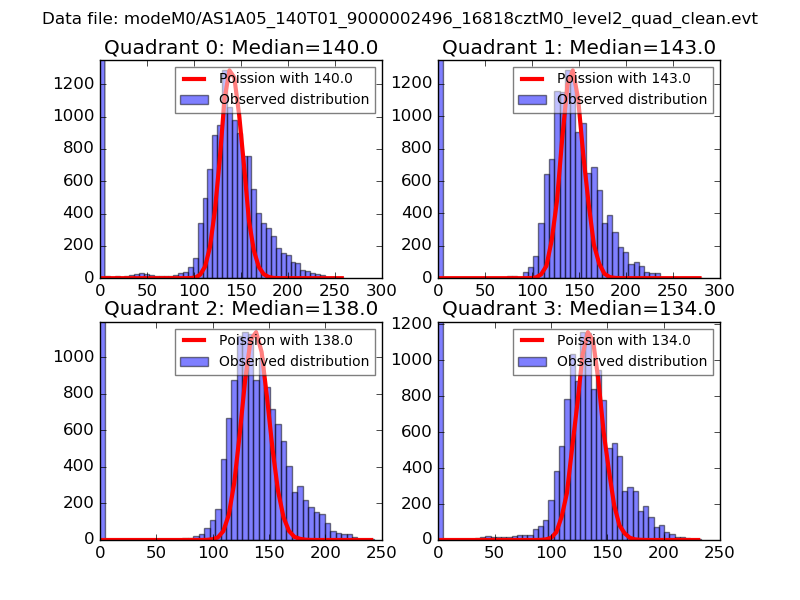 |
 |
| Quadrant-wise count rates Data is divided into 100 sec bins |
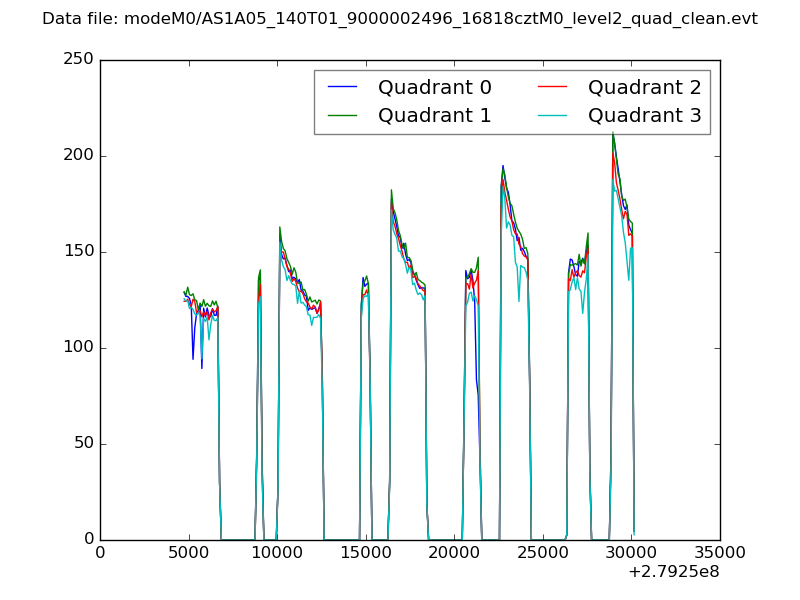 |
|
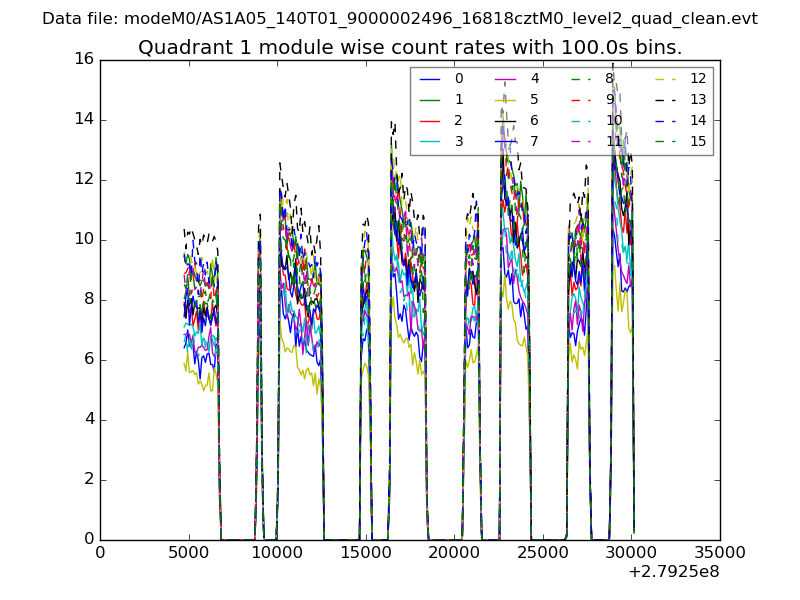
| Module-wise count rates for Quadrant A Data is divided into 100 sec bins |
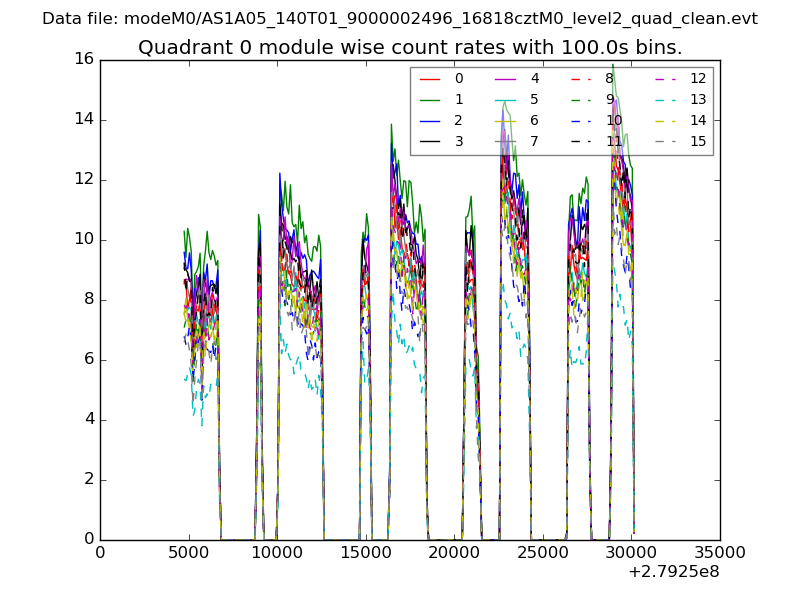 |
 |
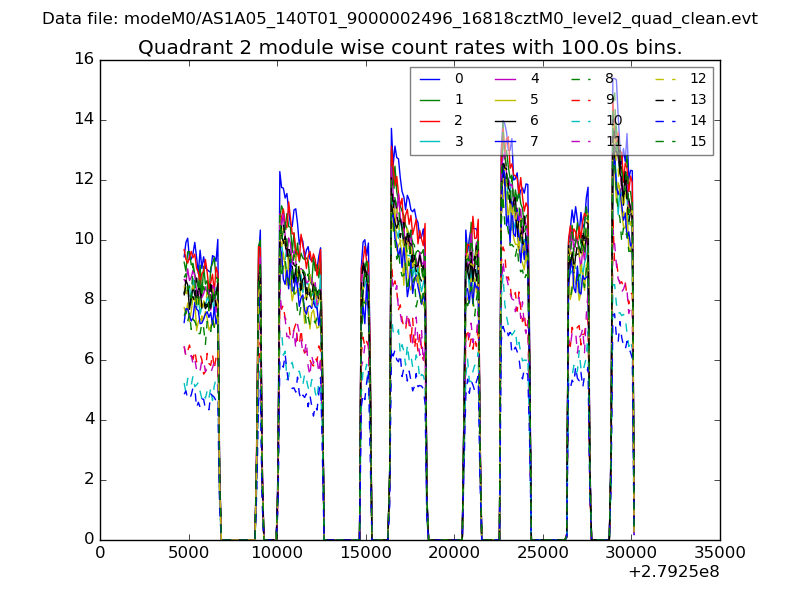
| Module-wise count rates for Quadrant B Data is divided into 100 sec bins |
 |
 |
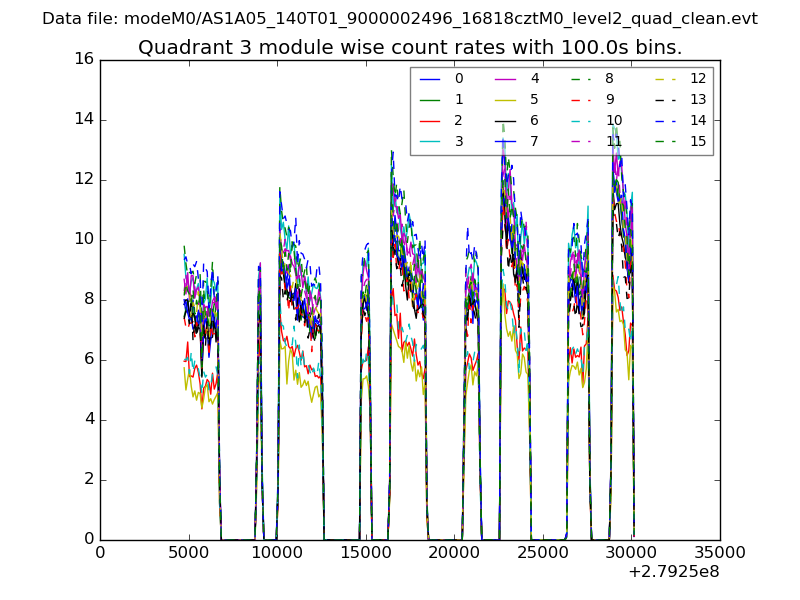
| Module-wise count rates for Quadrant C Data is divided into 100 sec bins |
 |
 |
| Module-wise count rates for Quadrant D Data is divided into 100 sec bins |
 |
 |
| Parameter | Plot |
|---|---|
| CZT HV Monitor | 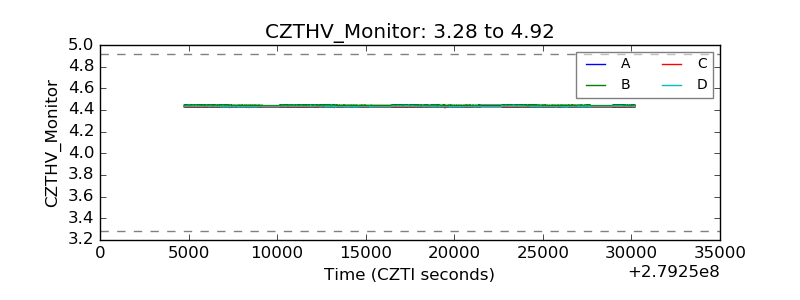 |
| D_VDD | 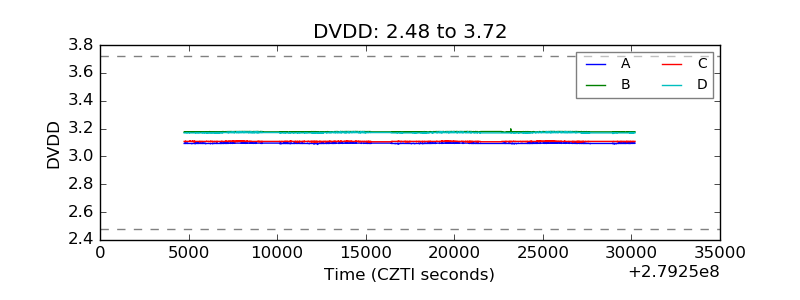 |
| Temperature 1 | 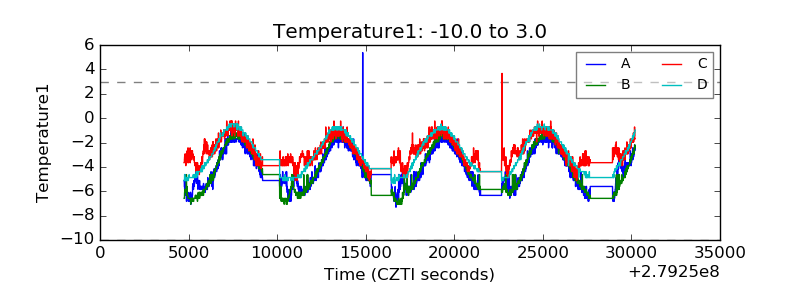 |
| Veto HV Monitor | 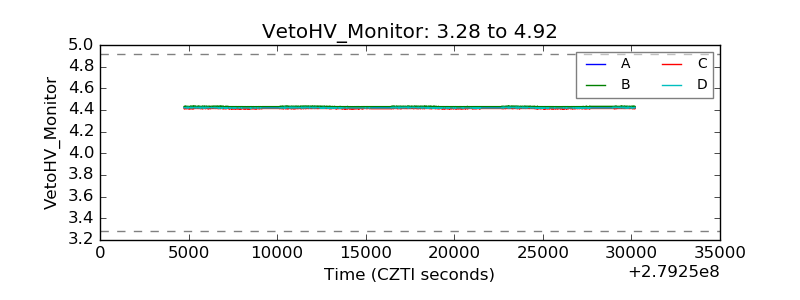 |
| Veto LLD | 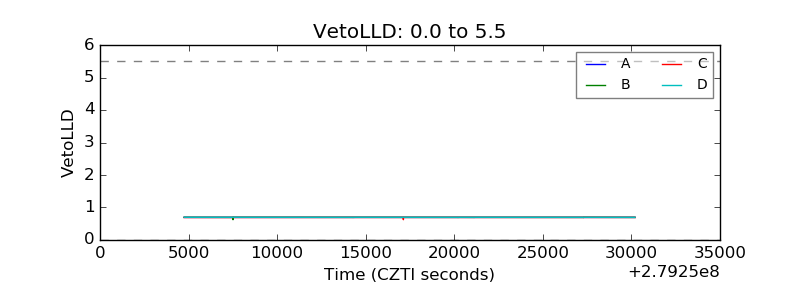 |
| Alpha Counter | 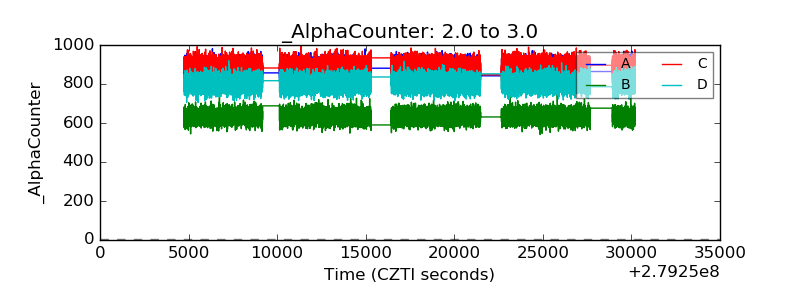 |
| _CPM_Rate | 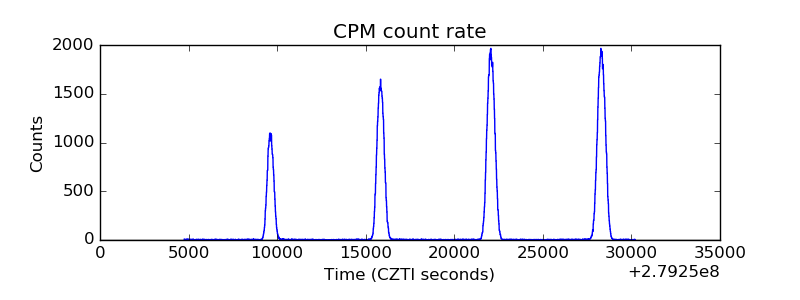 |
| CZT Counter |  |
| +2.5 Volts monitor |  |
| +5 Volts monitor |  |
| _ROLL_ROT | 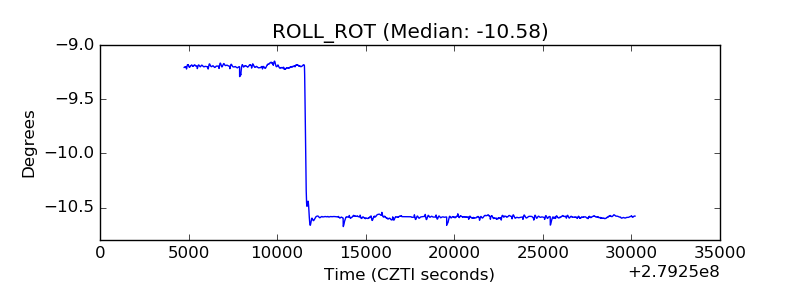 |
| _Roll_DEC | 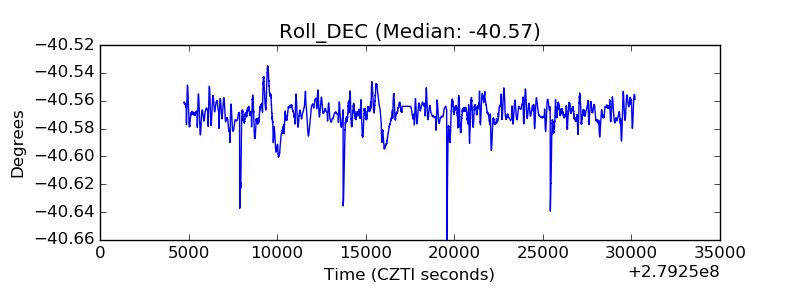 |
| _Roll_RA | 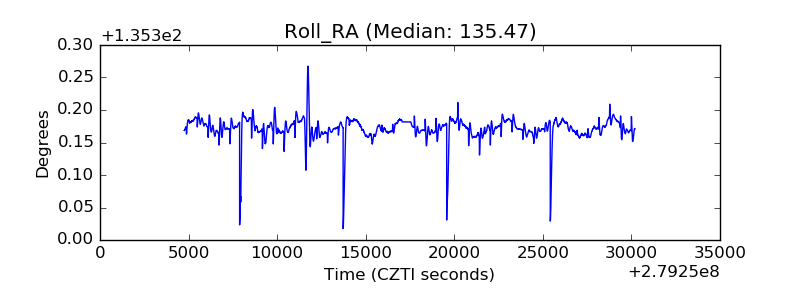 |
| Veto Counter | 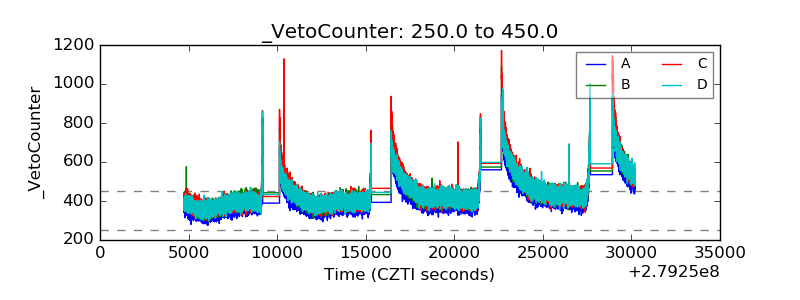 |