| Param | Original file | Final file |
|---|---|---|
| Filename | modeM0/AS1A05_140T01_9000002496_16820cztM0_level2.evt | modeM0/AS1A05_140T01_9000002496_16820cztM0_level2_quad_clean.evt |
| Size (bytes) | 662,711,040 | 71,893,440 |
| Size | 632.0 MB | 68.6 MB |
| Events in quadrant A | 5,281,183 | 433,137 |
| Events in quadrant B | 3,717,348 | 459,721 |
| Events in quadrant C | 4,363,640 | 431,780 |
| Events in quadrant D | 6,279,628 | 409,504 |
| Mode SS | |||
|---|---|---|---|
| Quadrant | BADHDUFLAG | Total packets | Discarded packets |
| A | 0 | 128 | 0 |
| B | 0 | 128 | 0 |
| C | 0 | 128 | 0 |
| D | 0 | 128 | 0 |
| Mode M0 | |||
|---|---|---|---|
| Quadrant | BADHDUFLAG | Total packets | Discarded packets |
| A | 0 | 19800 | 2 |
| B | 0 | 14834 | 1 |
| C | 0 | 16967 | 1 |
| D | 0 | 23010 | 1 |
| Mode M9 | |||
|---|---|---|---|
| Quadrant | BADHDUFLAG | Total packets | Discarded packets |
| A | 0 | 13 | 0 |
| B | 0 | 13 | 0 |
| C | 0 | 13 | 0 |
| D | 0 | 13 | 0 |
| Quadrant | Total seconds | Saturated seconds | Saturation percentage |
|---|---|---|---|
| A | 6339 | 708 | 11.168954% |
| B | 6339 | 138 | 2.177000% |
| C | 6339 | 447 | 7.051585% |
| D | 6339 | 837 | 13.203975% |
Noise dominated data is calculated using 1-second bins in cleaned event files. If a bin has >2000 counts, and if more than 50% of those come from <1% of pixels, then it is considered to be noise-dominated and hence unusable.
| Quadrant | # 1 sec bins | Bins with >0 counts | Bins with >2000 counts | High rate bins dominated by noise | Noise dominated (total time) | Noise dominated (detector-on time) | Marked lightcurve |
|---|---|---|---|---|---|---|---|
| A | 7585 | 6341 | 407 | 407 | 5.37% | 6.42% | 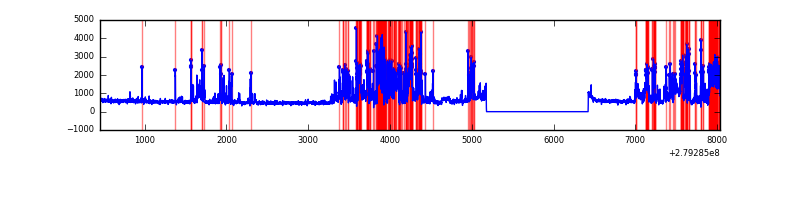 |
| B | 7585 | 6341 | 10 | 10 | 0.13% | 0.16% | 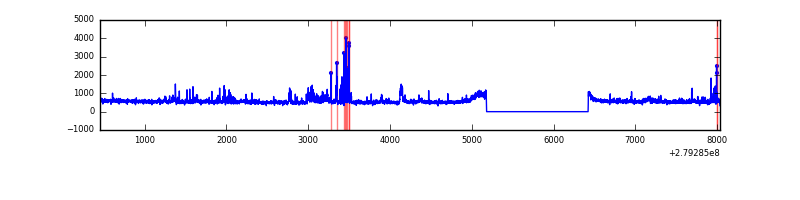 |
| C | 7585 | 6341 | 167 | 167 | 2.20% | 2.63% | 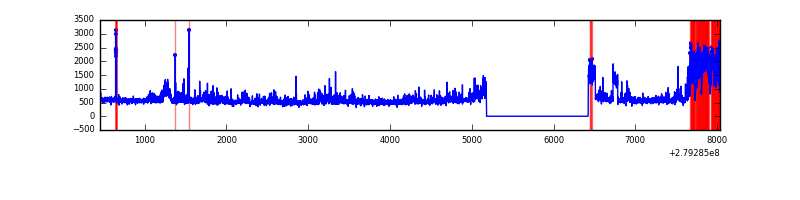 |
| D | 7585 | 6341 | 558 | 558 | 7.36% | 8.80% | 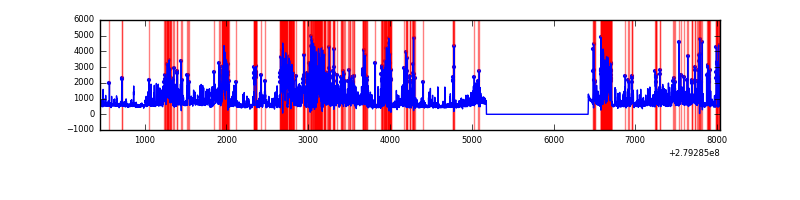 |
Top three noisy pixels from each quadrant. If the there are fewer than three noisy pixels in the level2.evt file, extra rows are filled as -1
| Pixel properties | Quadrant properties | ||||||
|---|---|---|---|---|---|---|---|
| Quadrant | DetID | PixID | Counts | Sigma | Mean | Median | Sigma |
| A | 15 | 174 | 2113525 | 12838.54 | 820 | 806 | 164.6 |
| A | 9 | 143 | 16443 | 95.02 | 820 | 806 | 164.6 |
| A | 0 | 226 | 7390 | 40.01 | 820 | 806 | 164.6 |
| B | 15 | 35 | 119751 | 755.88 | 836 | 820 | 157.3 |
| B | 0 | 189 | 86414 | 544.0 | 836 | 820 | 157.3 |
| B | 10 | 16 | 48520 | 303.16 | 836 | 820 | 157.3 |
| C | 3 | 233 | 939900 | 5130.75 | 791 | 798 | 183.0 |
| C | 0 | 207 | 211247 | 1149.78 | 791 | 798 | 183.0 |
| C | 14 | 238 | 125225 | 679.8 | 791 | 798 | 183.0 |
| D | 1 | 52 | 2962176 | 15645.39 | 783 | 762 | 189.3 |
| D | 15 | 0 | 268929 | 1416.75 | 783 | 762 | 189.3 |
| D | 2 | 33 | 44042 | 228.65 | 783 | 762 | 189.3 |
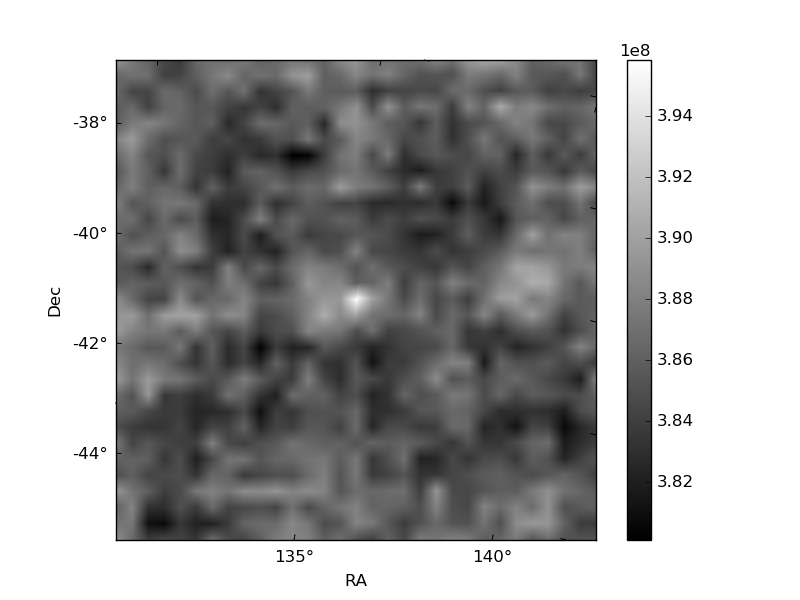
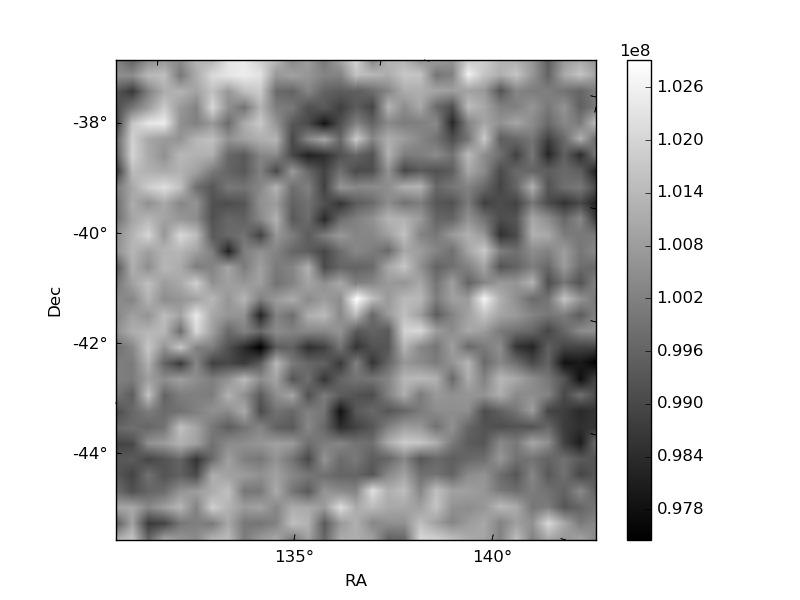
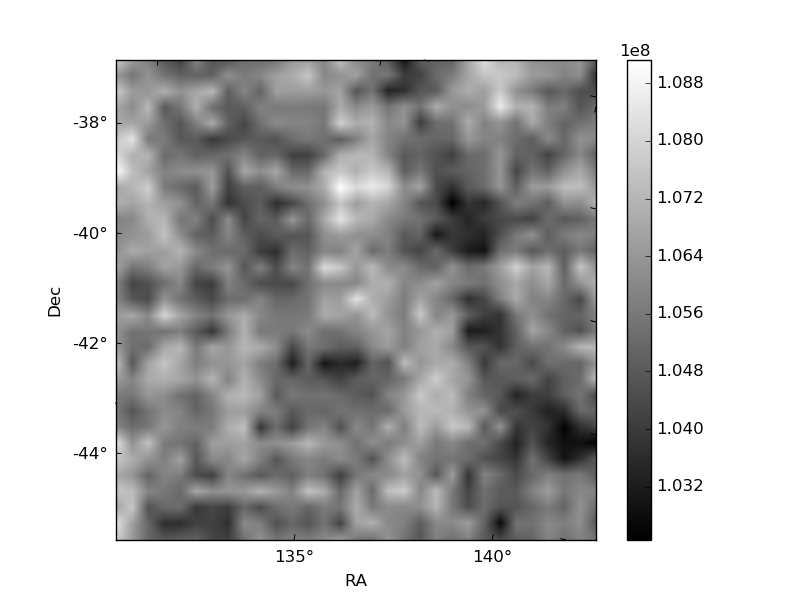
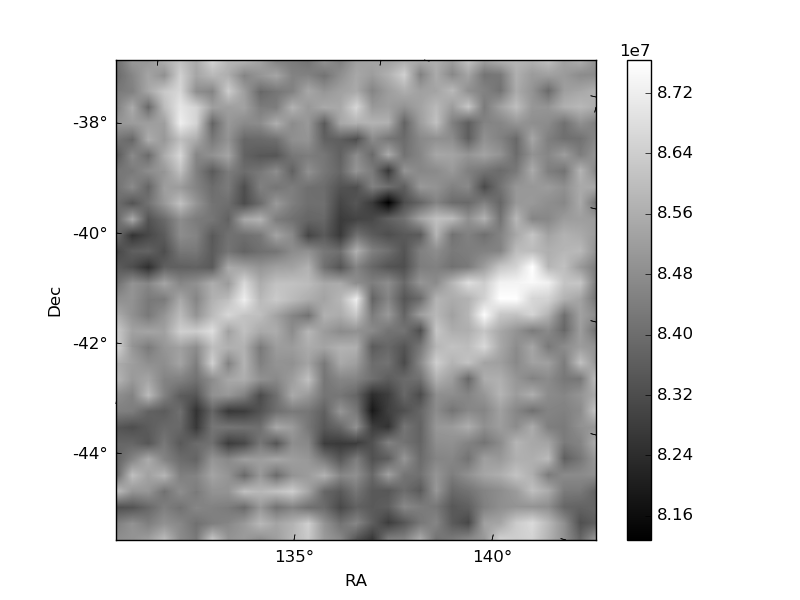
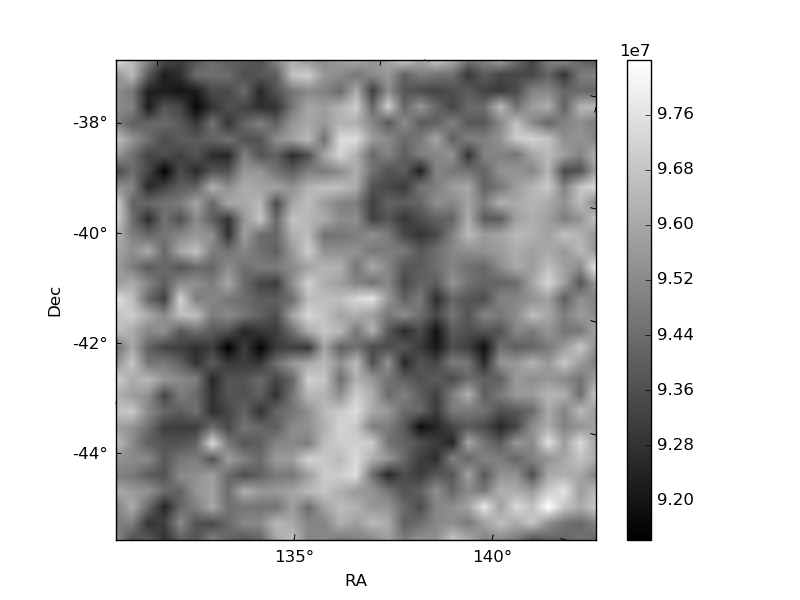
Histogram calculated using DETX and DETY for each event in the final _common_clean file
| Quadrant A | 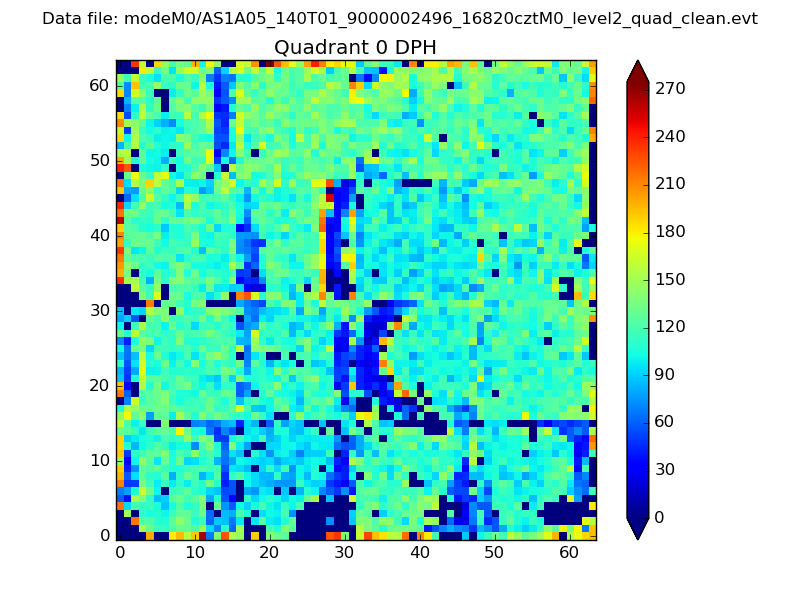 |
 |
Quadrant B |
|---|---|---|---|
| Quadrant D | 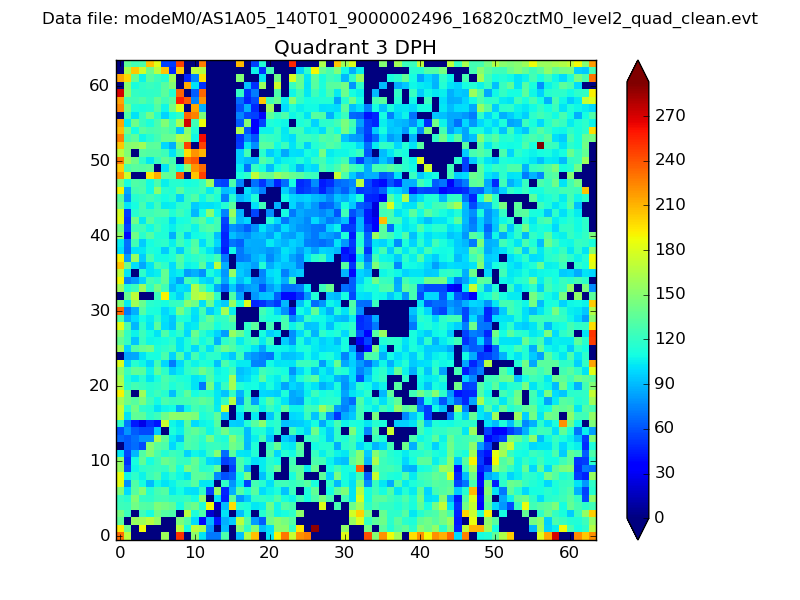 |
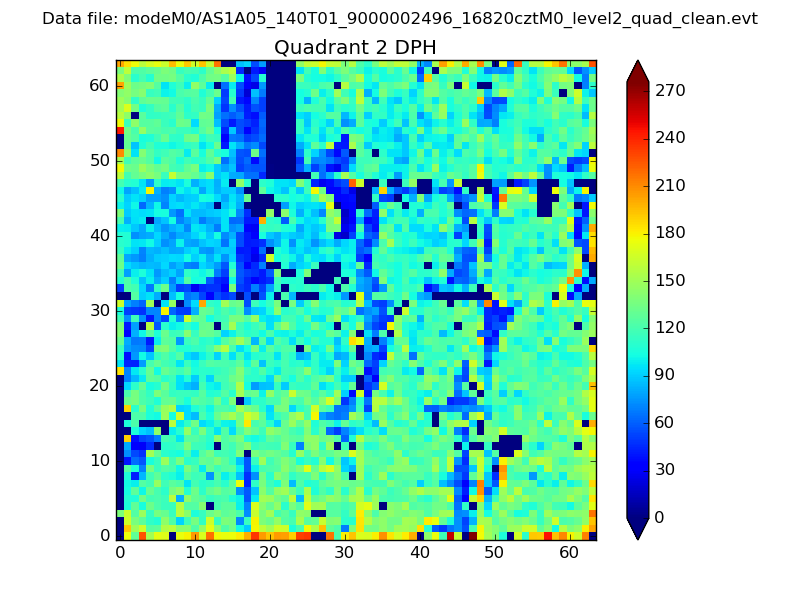 |
Quadrant C |
| Plot type | Count rate plots | Images |
|---|---|---|
| Comparison with Poisson distribution Blue bars denote a histogram of data divided into 1 sec bins. Red curve is a Poisson curve with rate = median count rate of data. |
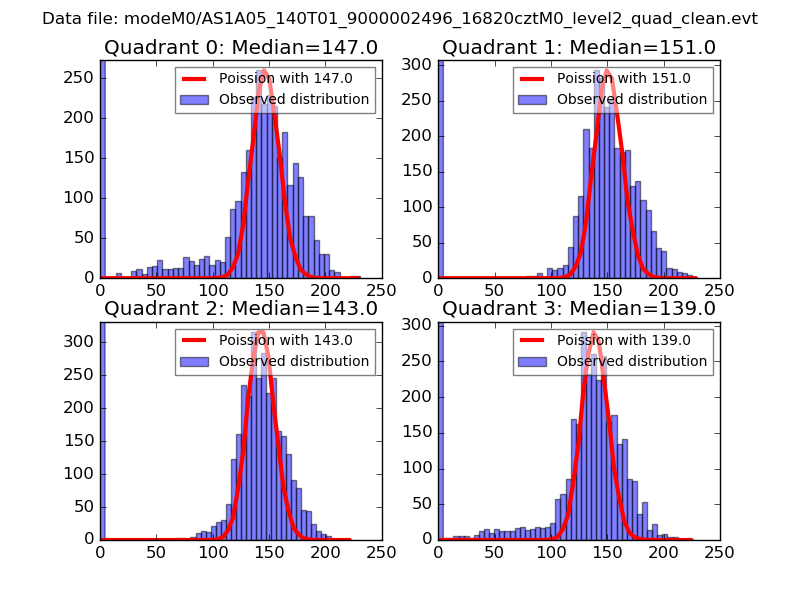 |
 |
| Quadrant-wise count rates Data is divided into 100 sec bins |
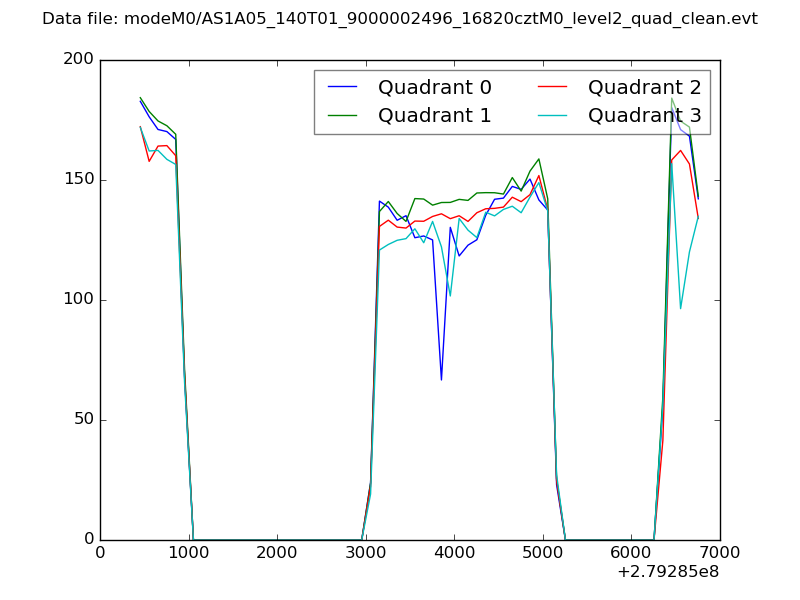 |
|
| Module-wise count rates for Quadrant A Data is divided into 100 sec bins |
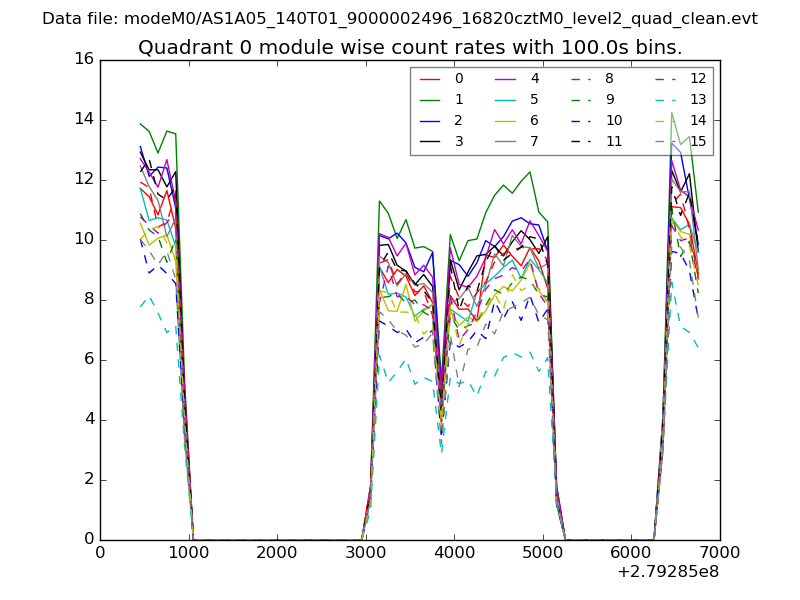 |
 |
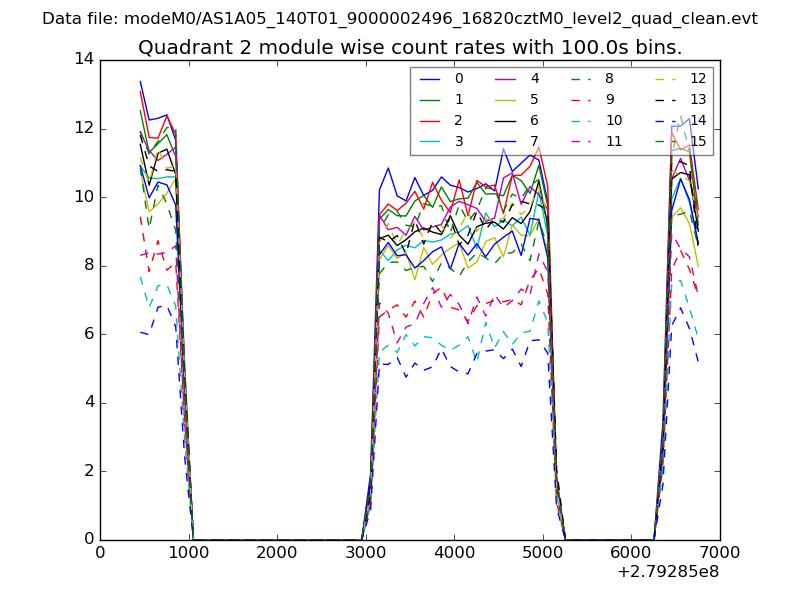
| Module-wise count rates for Quadrant B Data is divided into 100 sec bins |
 |
 |
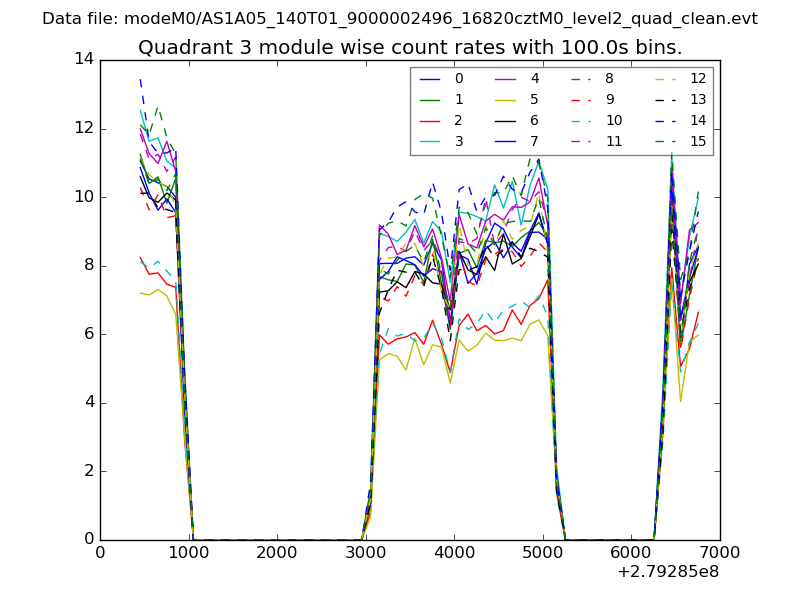
| Module-wise count rates for Quadrant C Data is divided into 100 sec bins |
 |
 |
| Module-wise count rates for Quadrant D Data is divided into 100 sec bins |
 |
 |
| Parameter | Plot |
|---|---|
| CZT HV Monitor | 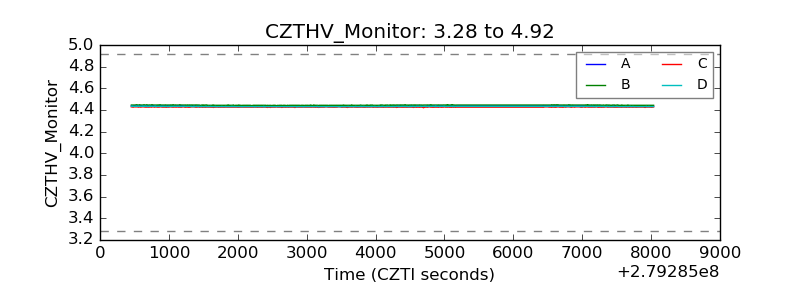 |
| D_VDD | 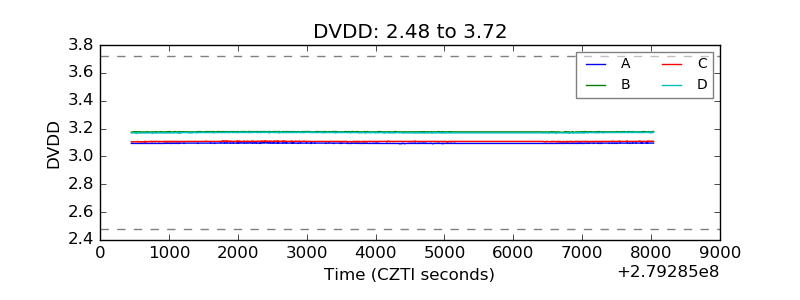 |
| Temperature 1 | 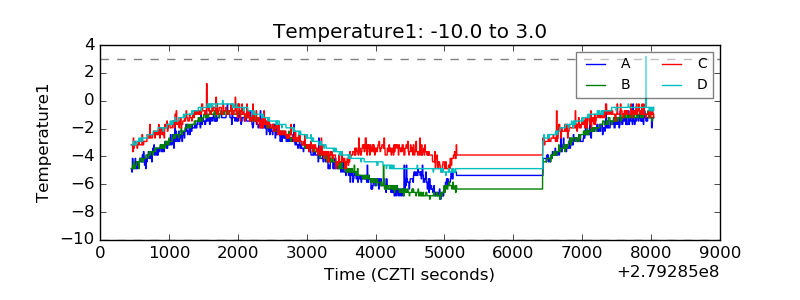 |
| Veto HV Monitor | 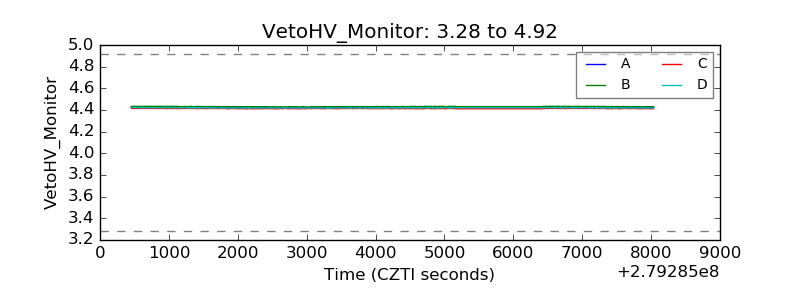 |
| Veto LLD |  |
| Alpha Counter | 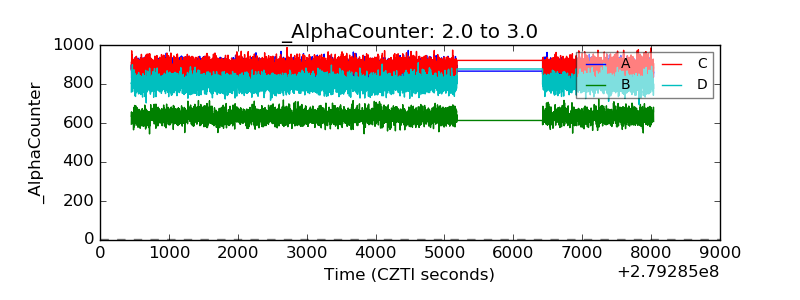 |
| _CPM_Rate | 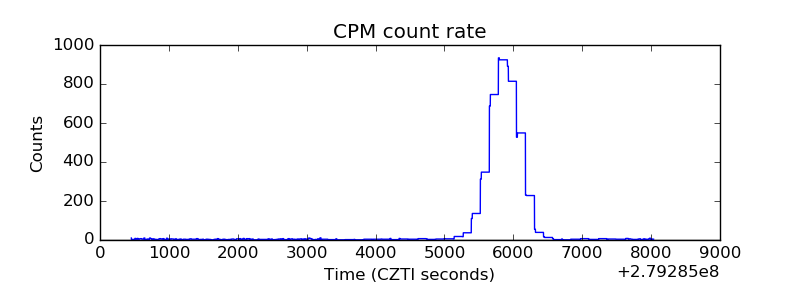 |
| CZT Counter | 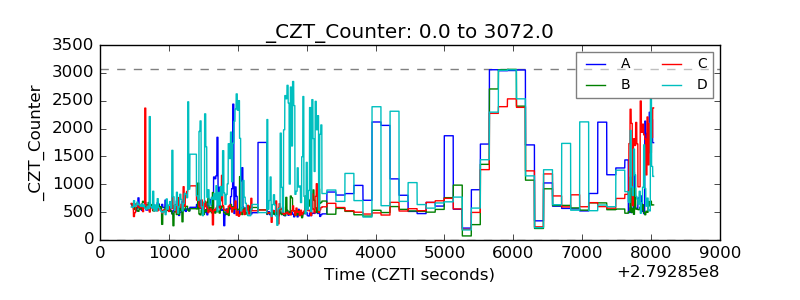 |
| +2.5 Volts monitor | 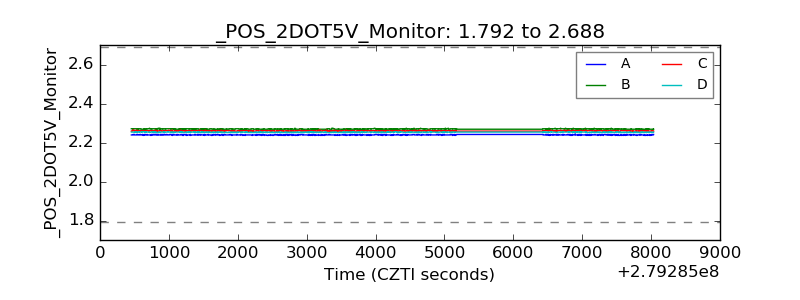 |
| +5 Volts monitor |  |
| _ROLL_ROT | 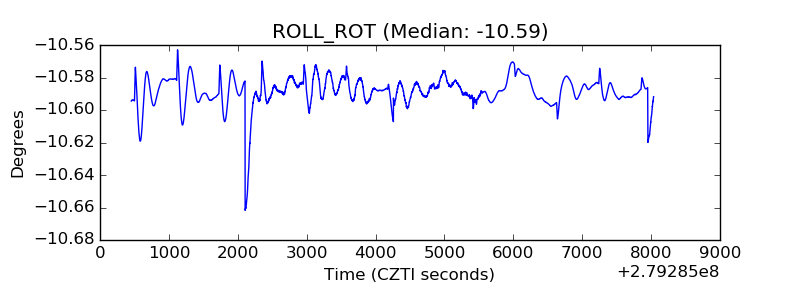 |
| _Roll_DEC | 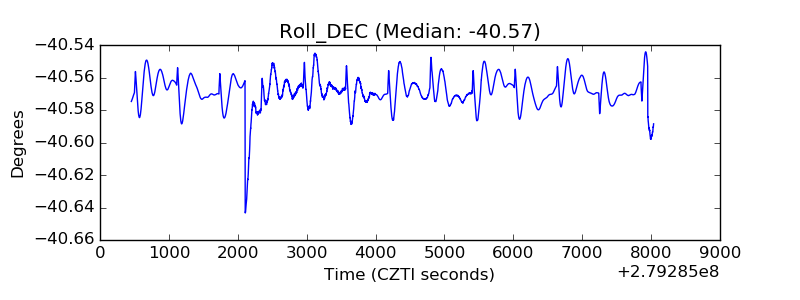 |
| _Roll_RA | 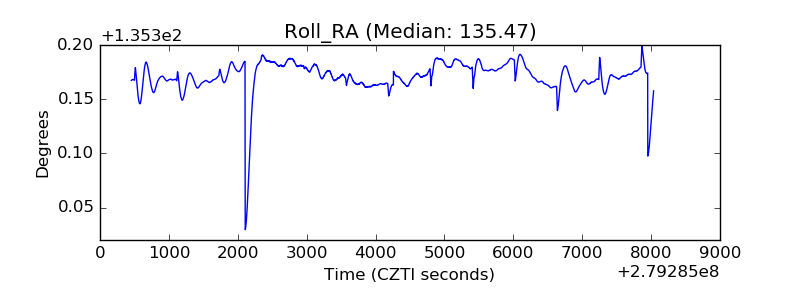 |
| Veto Counter | 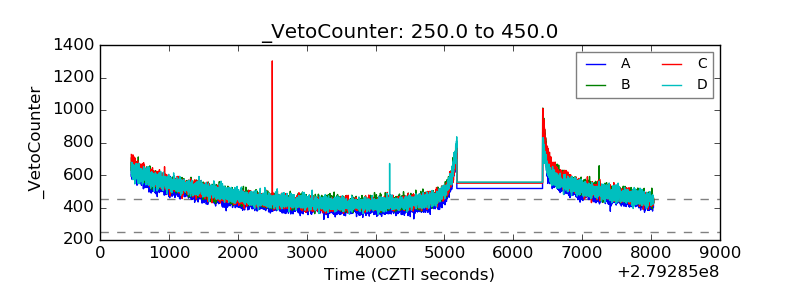 |