| Param | Original file | Final file |
|---|---|---|
| Filename | modeM0/AS1A05_140T01_9000002496_16822cztM0_level2.evt | modeM0/AS1A05_140T01_9000002496_16822cztM0_level2_quad_clean.evt |
| Size (bytes) | 647,121,600 | 71,452,800 |
| Size | 617.1 MB | 68.1 MB |
| Events in quadrant A | 4,043,108 | 442,902 |
| Events in quadrant B | 3,620,341 | 449,742 |
| Events in quadrant C | 4,435,831 | 427,600 |
| Events in quadrant D | 7,046,847 | 377,111 |
| Mode SS | |||
|---|---|---|---|
| Quadrant | BADHDUFLAG | Total packets | Discarded packets |
| A | 0 | 134 | 0 |
| B | 0 | 134 | 0 |
| C | 0 | 134 | 0 |
| D | 0 | 134 | 0 |
| Mode M0 | |||
|---|---|---|---|
| Quadrant | BADHDUFLAG | Total packets | Discarded packets |
| A | 0 | 16234 | 2 |
| B | 0 | 14821 | 1 |
| C | 0 | 17286 | 1 |
| D | 0 | 25462 | 1 |
| Mode M9 | |||
|---|---|---|---|
| Quadrant | BADHDUFLAG | Total packets | Discarded packets |
| A | 0 | 8 | 0 |
| B | 0 | 8 | 0 |
| C | 0 | 8 | 0 |
| D | 0 | 8 | 0 |
| Quadrant | Total seconds | Saturated seconds | Saturation percentage |
|---|---|---|---|
| A | 6683 | 291 | 4.354332% |
| B | 6683 | 143 | 2.139758% |
| C | 6683 | 292 | 4.369295% |
| D | 6683 | 1255 | 18.778991% |
Noise dominated data is calculated using 1-second bins in cleaned event files. If a bin has >2000 counts, and if more than 50% of those come from <1% of pixels, then it is considered to be noise-dominated and hence unusable.
| Quadrant | # 1 sec bins | Bins with >0 counts | Bins with >2000 counts | High rate bins dominated by noise | Noise dominated (total time) | Noise dominated (detector-on time) | Marked lightcurve |
|---|---|---|---|---|---|---|---|
| A | 7414 | 6685 | 136 | 136 | 1.83% | 2.03% | 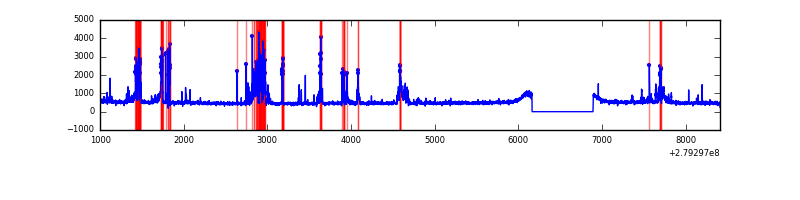 |
| B | 7414 | 6685 | 9 | 9 | 0.12% | 0.13% | 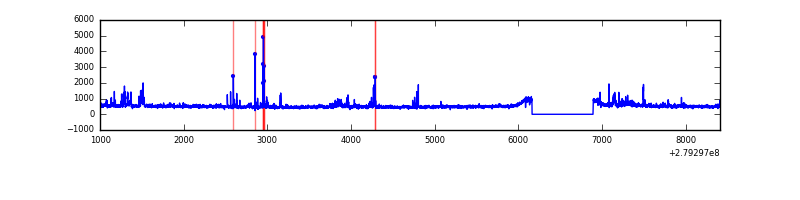 |
| C | 7414 | 6685 | 100 | 100 | 1.35% | 1.50% | 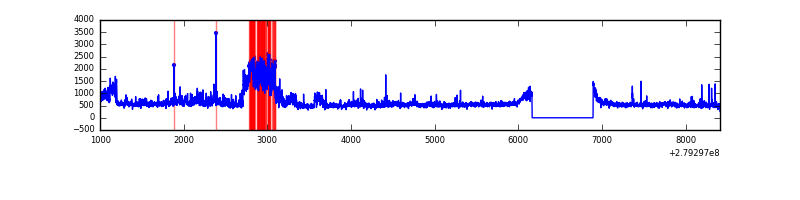 |
| D | 7414 | 6685 | 859 | 859 | 11.59% | 12.85% | 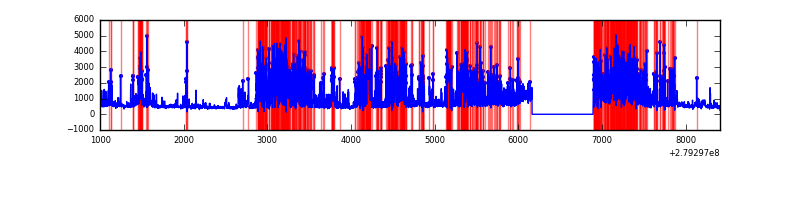 |
Top three noisy pixels from each quadrant. If the there are fewer than three noisy pixels in the level2.evt file, extra rows are filled as -1
| Pixel properties | Quadrant properties | ||||||
|---|---|---|---|---|---|---|---|
| Quadrant | DetID | PixID | Counts | Sigma | Mean | Median | Sigma |
| A | 15 | 174 | 840754 | 5008.71 | 830 | 815 | 167.7 |
| A | 9 | 143 | 9116 | 49.5 | 830 | 815 | 167.7 |
| A | 0 | 226 | 7399 | 39.26 | 830 | 815 | 167.7 |
| B | 10 | 16 | 123352 | 766.04 | 832 | 811 | 160.0 |
| B | 15 | 35 | 101548 | 629.74 | 832 | 811 | 160.0 |
| B | 0 | 229 | 45062 | 276.63 | 832 | 811 | 160.0 |
| C | 3 | 233 | 950708 | 5136.28 | 794 | 802 | 184.9 |
| C | 0 | 207 | 265198 | 1429.63 | 794 | 802 | 184.9 |
| C | 14 | 238 | 120751 | 648.58 | 794 | 802 | 184.9 |
| D | 1 | 52 | 3281559 | 17869.38 | 749 | 726 | 183.6 |
| D | 5 | 222 | 468534 | 2547.96 | 749 | 726 | 183.6 |
| D | 2 | 33 | 215806 | 1171.45 | 749 | 726 | 183.6 |
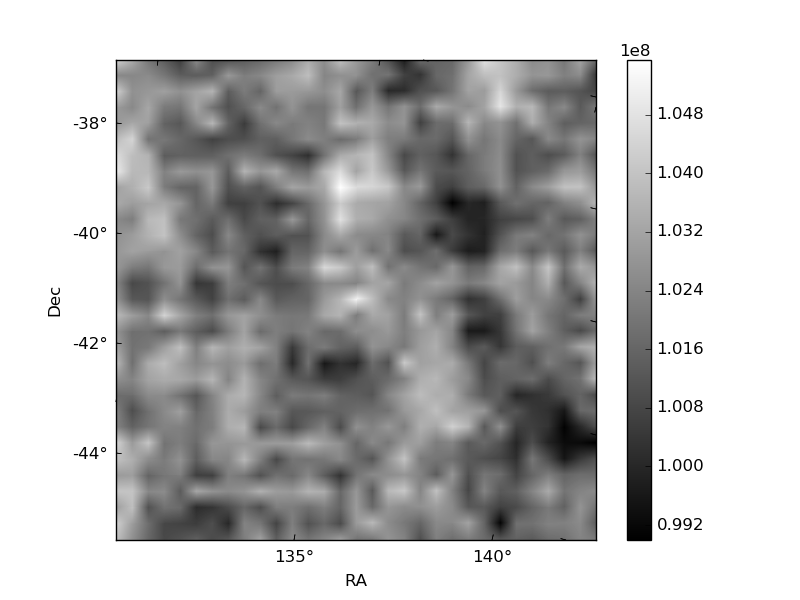
Histogram calculated using DETX and DETY for each event in the final _common_clean file
| Quadrant A | 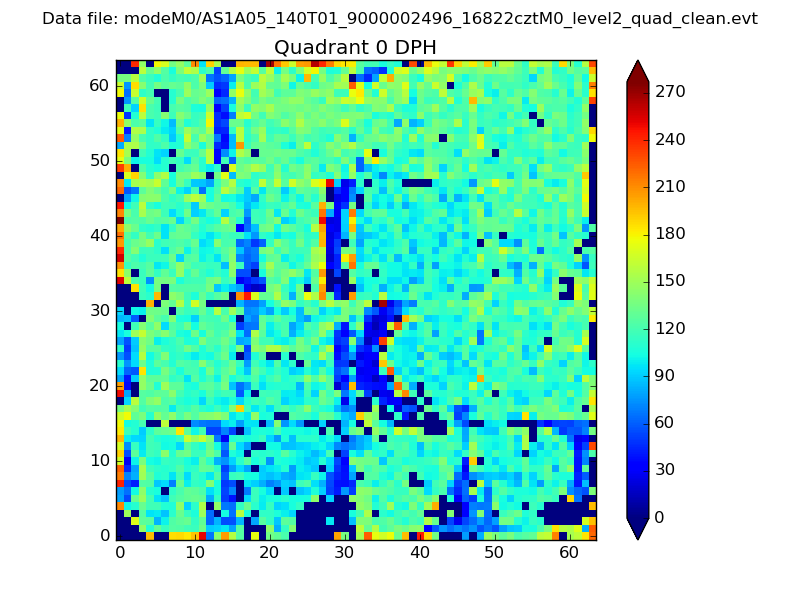 |
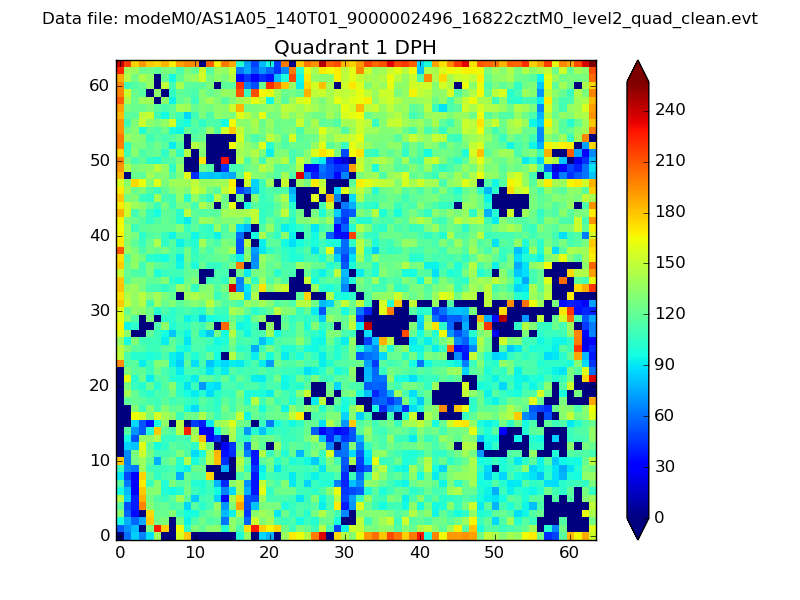 |
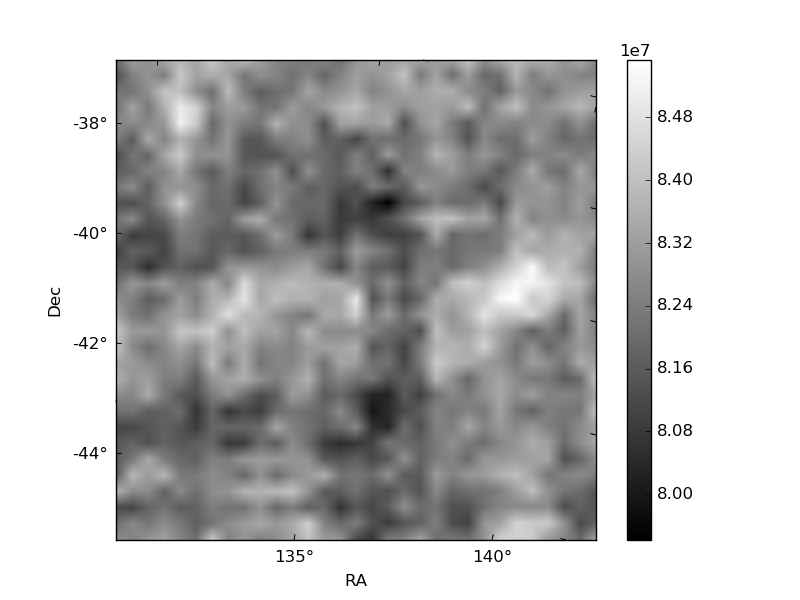
Quadrant B |
|---|---|---|---|
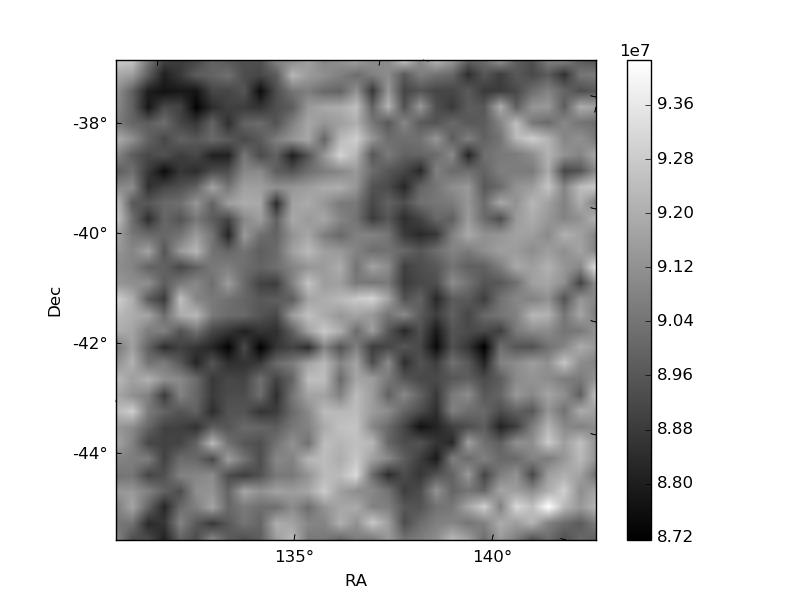
| Quadrant D | 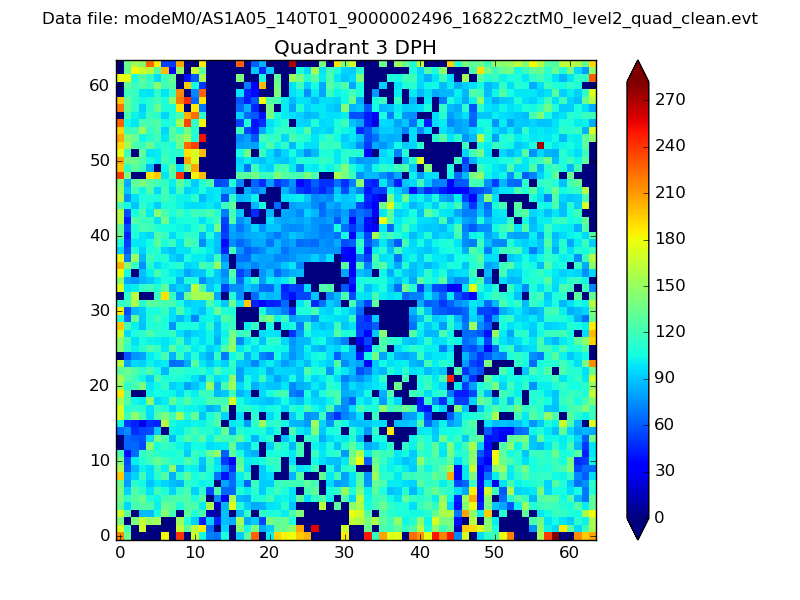 |
 |
Quadrant C |
| Plot type | Count rate plots | Images |
|---|---|---|
| Comparison with Poisson distribution Blue bars denote a histogram of data divided into 1 sec bins. Red curve is a Poisson curve with rate = median count rate of data. |
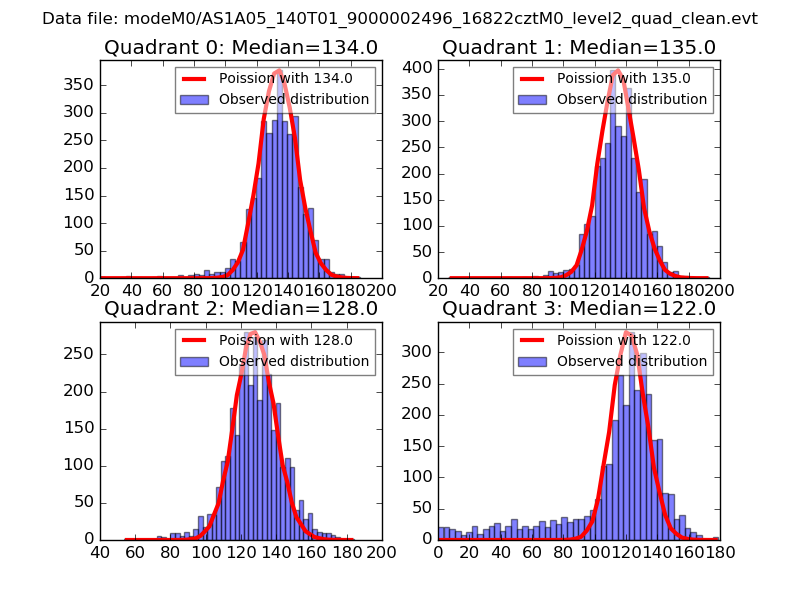 |
 |
| Quadrant-wise count rates Data is divided into 100 sec bins |
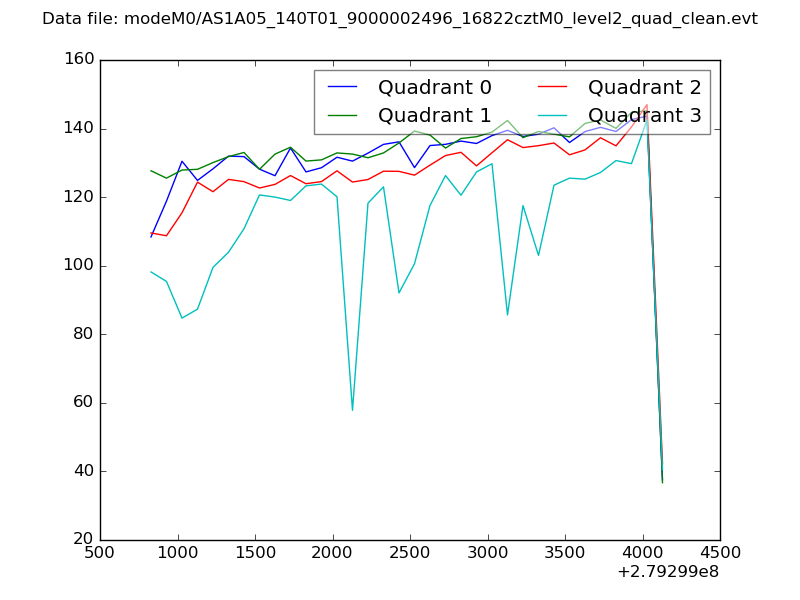 |
|
| Module-wise count rates for Quadrant A Data is divided into 100 sec bins |
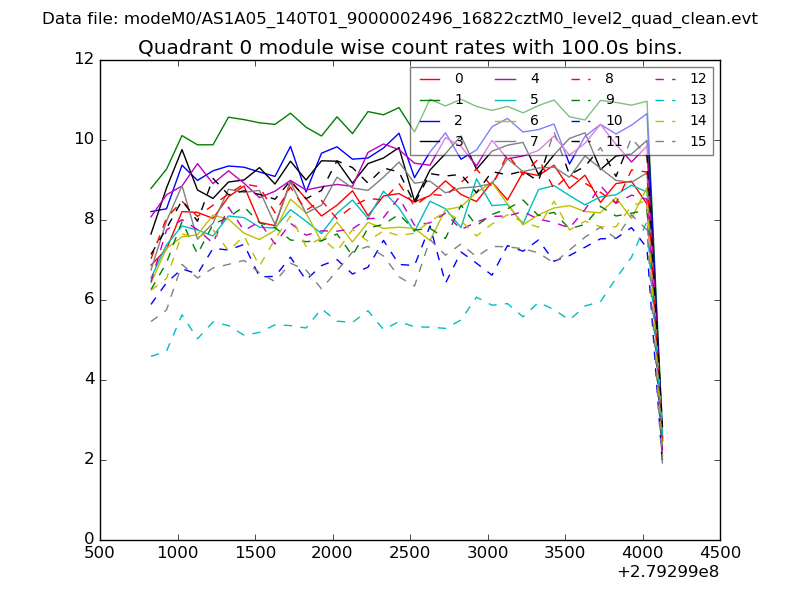 |
 |
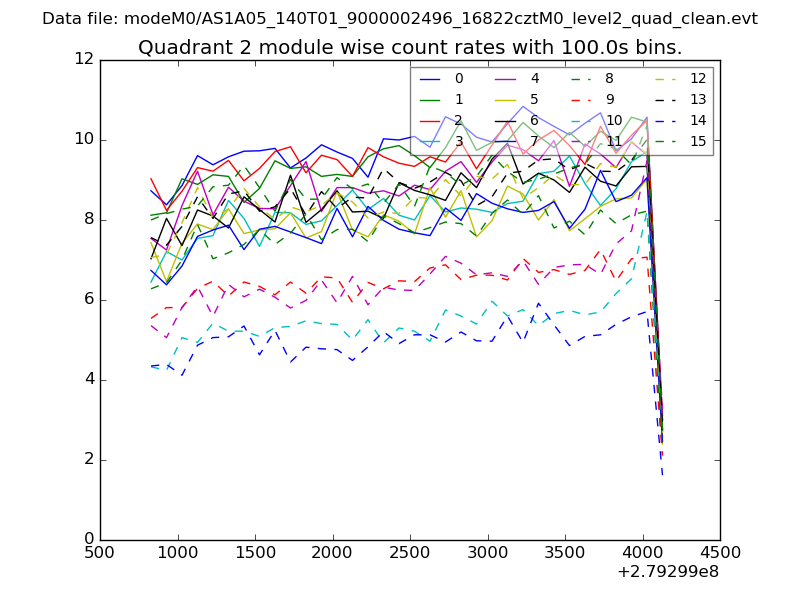
| Module-wise count rates for Quadrant B Data is divided into 100 sec bins |
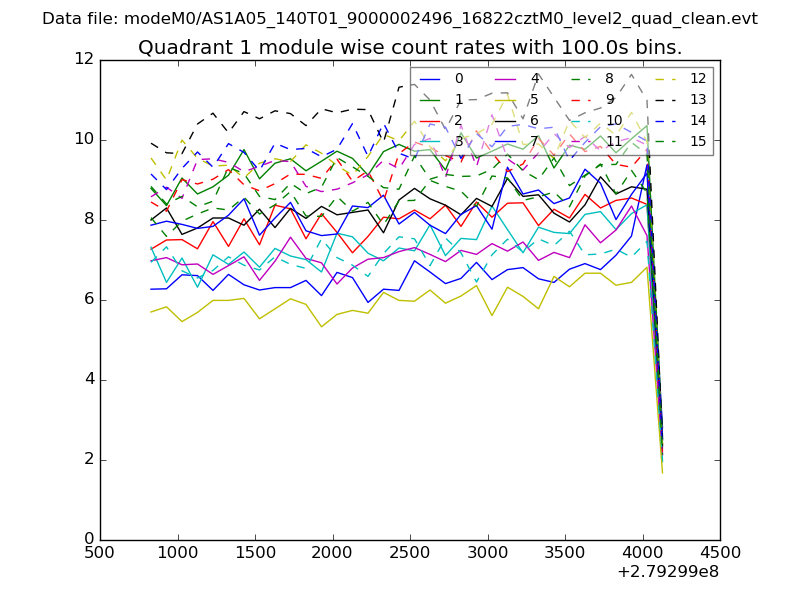 |
 |
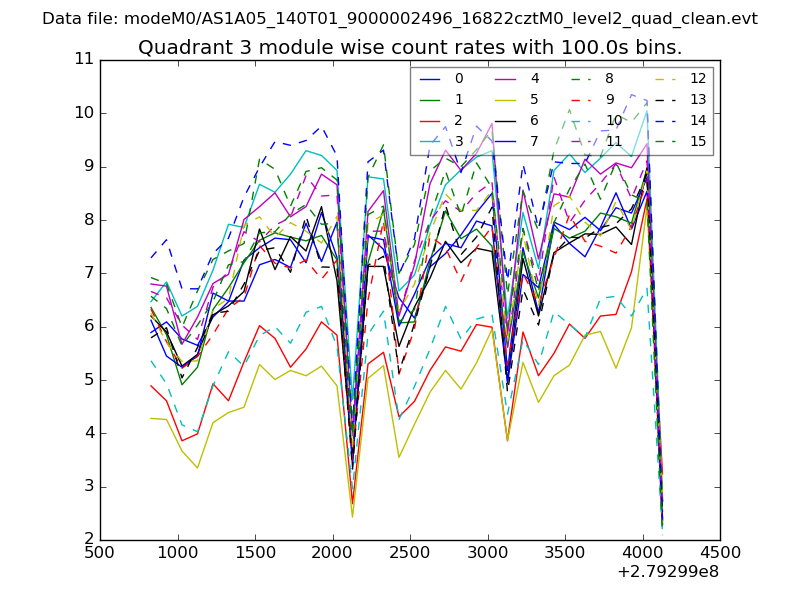
| Module-wise count rates for Quadrant C Data is divided into 100 sec bins |
 |
 |
| Module-wise count rates for Quadrant D Data is divided into 100 sec bins |
 |
 |
| Parameter | Plot |
|---|---|
| CZT HV Monitor | 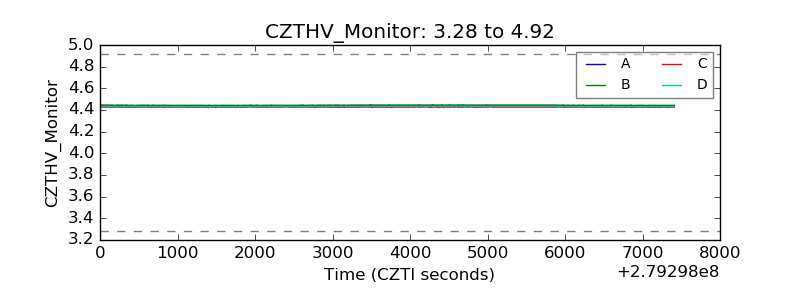 |
| D_VDD | 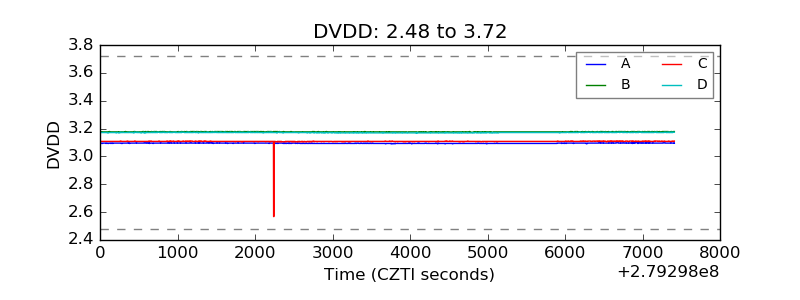 |
| Temperature 1 | 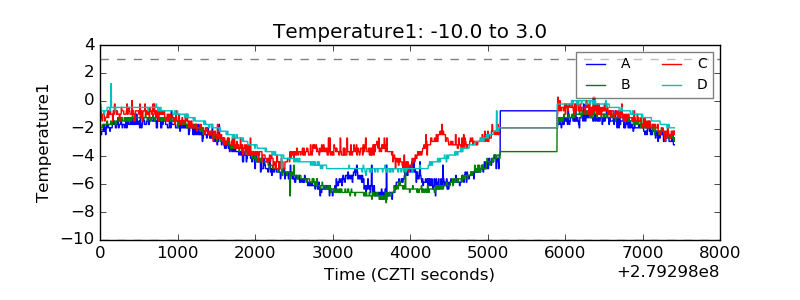 |
| Veto HV Monitor | 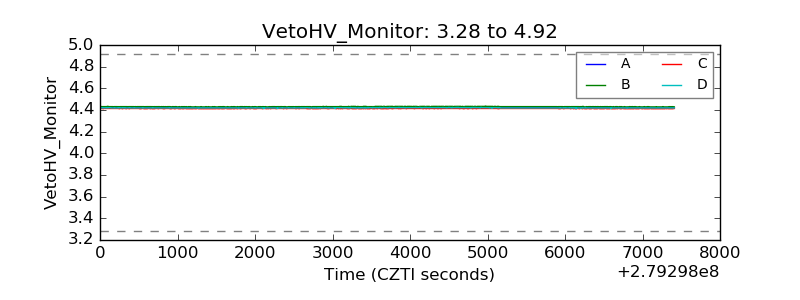 |
| Veto LLD | 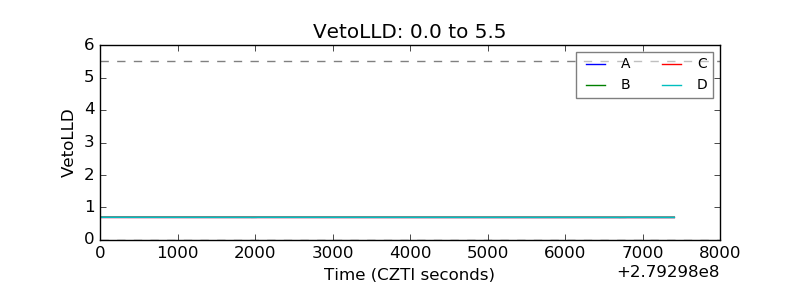 |
| Alpha Counter | 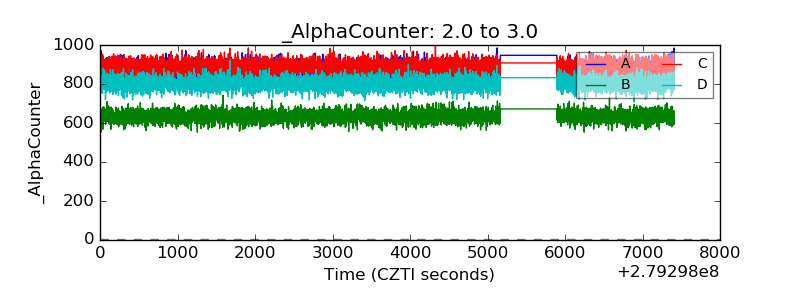 |
| _CPM_Rate | 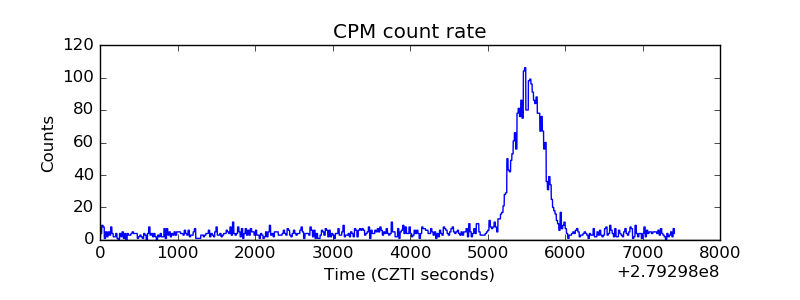 |
| CZT Counter | 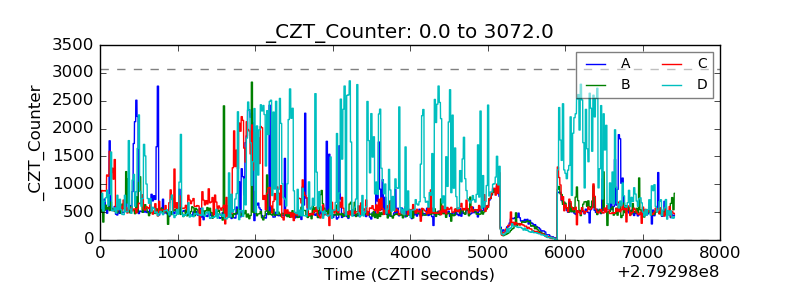 |
| +2.5 Volts monitor | 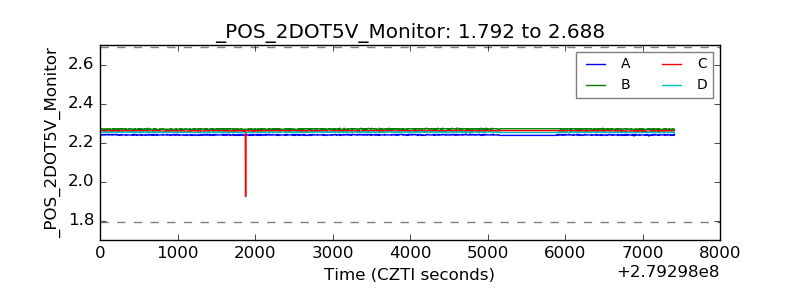 |
| +5 Volts monitor |  |
| _ROLL_ROT | 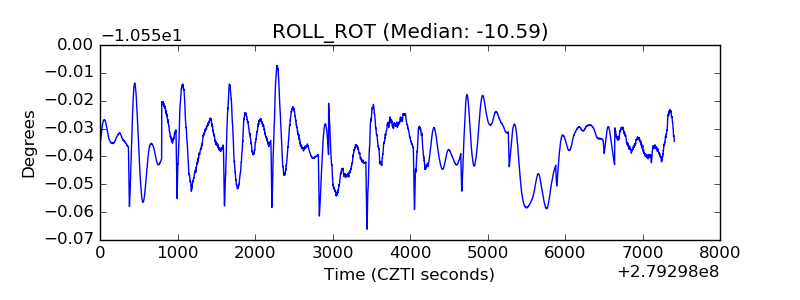 |
| _Roll_DEC | 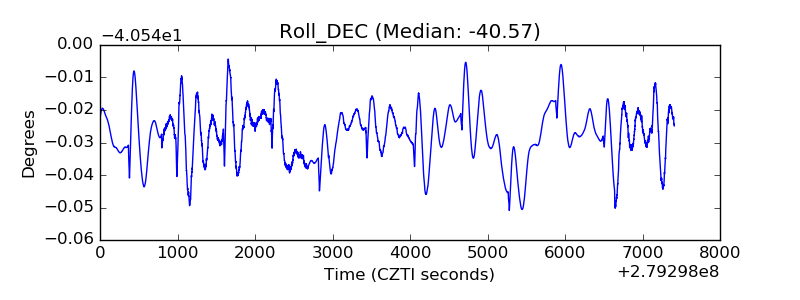 |
| _Roll_RA |  |
| Veto Counter | 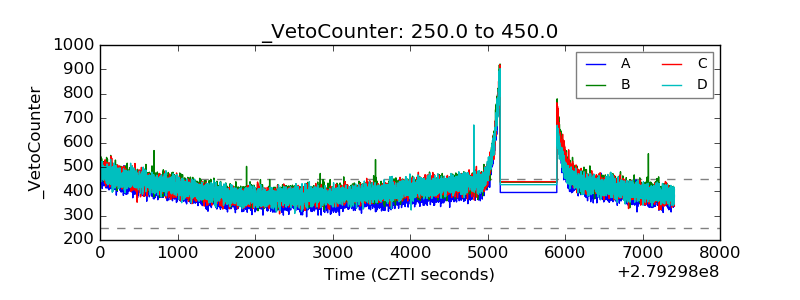 |