| Param | Original file | Final file |
|---|---|---|
| Filename | modeM0/AS1A05_140T01_9000002496_16824cztM0_level2.evt | modeM0/AS1A05_140T01_9000002496_16824cztM0_level2_quad_clean.evt |
| Size (bytes) | 276,065,280 | 36,380,160 |
| Size | 263.3 MB | 34.7 MB |
| Events in quadrant A | 1,496,873 | 237,609 |
| Events in quadrant B | 1,669,592 | 237,344 |
| Events in quadrant C | 1,507,547 | 227,964 |
| Events in quadrant D | 3,481,459 | 184,098 |
| Mode SS | |||
|---|---|---|---|
| Quadrant | BADHDUFLAG | Total packets | Discarded packets |
| A | 0 | 60 | 0 |
| B | 0 | 60 | 0 |
| C | 0 | 60 | 0 |
| D | 0 | 60 | 0 |
| Mode M0 | |||
|---|---|---|---|
| Quadrant | BADHDUFLAG | Total packets | Discarded packets |
| A | 0 | 6481 | 0 |
| B | 0 | 6920 | 0 |
| C | 0 | 6433 | 0 |
| D | 0 | 12325 | 0 |
| Quadrant | Total seconds | Saturated seconds | Saturation percentage |
|---|---|---|---|
| A | 3000 | 16 | 0.533333% |
| B | 3000 | 27 | 0.900000% |
| C | 3000 | 7 | 0.233333% |
| D | 3000 | 638 | 21.266667% |
Noise dominated data is calculated using 1-second bins in cleaned event files. If a bin has >2000 counts, and if more than 50% of those come from <1% of pixels, then it is considered to be noise-dominated and hence unusable.
| Quadrant | # 1 sec bins | Bins with >0 counts | Bins with >2000 counts | High rate bins dominated by noise | Noise dominated (total time) | Noise dominated (detector-on time) | Marked lightcurve |
|---|---|---|---|---|---|---|---|
| A | 3001 | 3001 | 7 | 7 | 0.23% | 0.23% |  |
| B | 3001 | 3001 | 7 | 7 | 0.23% | 0.23% | 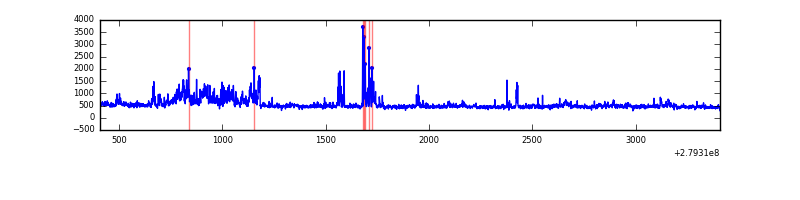 |
| C | 3001 | 3001 | 0 | 0 | 0.00% | 0.00% | 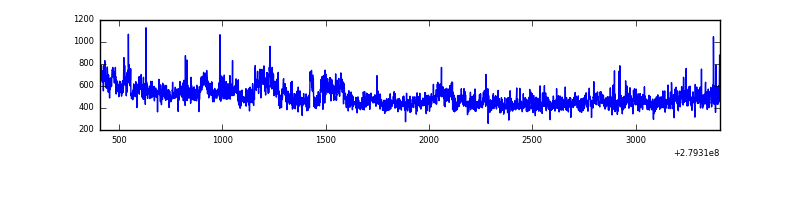 |
| D | 3001 | 3001 | 560 | 560 | 18.66% | 18.66% | 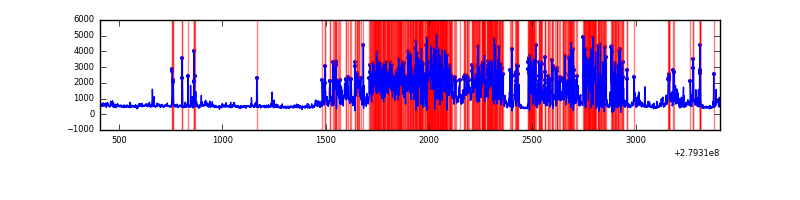 |
Top three noisy pixels from each quadrant. If the there are fewer than three noisy pixels in the level2.evt file, extra rows are filled as -1
| Pixel properties | Quadrant properties | ||||||
|---|---|---|---|---|---|---|---|
| Quadrant | DetID | PixID | Counts | Sigma | Mean | Median | Sigma |
| A | 15 | 174 | 126536 | 1753.68 | 342 | 336 | 72.0 |
| A | 9 | 143 | 52989 | 731.67 | 342 | 336 | 72.0 |
| A | 0 | 226 | 3083 | 38.17 | 342 | 336 | 72.0 |
| B | 0 | 189 | 176899 | 2577.03 | 344 | 335 | 68.5 |
| B | 15 | 35 | 48373 | 701.14 | 344 | 335 | 68.5 |
| B | 10 | 16 | 26774 | 385.89 | 344 | 335 | 68.5 |
| C | 3 | 233 | 124979 | 1604.44 | 325 | 329 | 77.7 |
| C | 0 | 207 | 52127 | 666.72 | 325 | 329 | 77.7 |
| C | 14 | 238 | 50813 | 649.81 | 325 | 329 | 77.7 |
| D | 1 | 52 | 1988463 | 26206.56 | 301 | 292 | 75.9 |
| D | 15 | 0 | 151946 | 1998.99 | 301 | 292 | 75.9 |
| D | 5 | 222 | 143283 | 1884.8 | 301 | 292 | 75.9 |
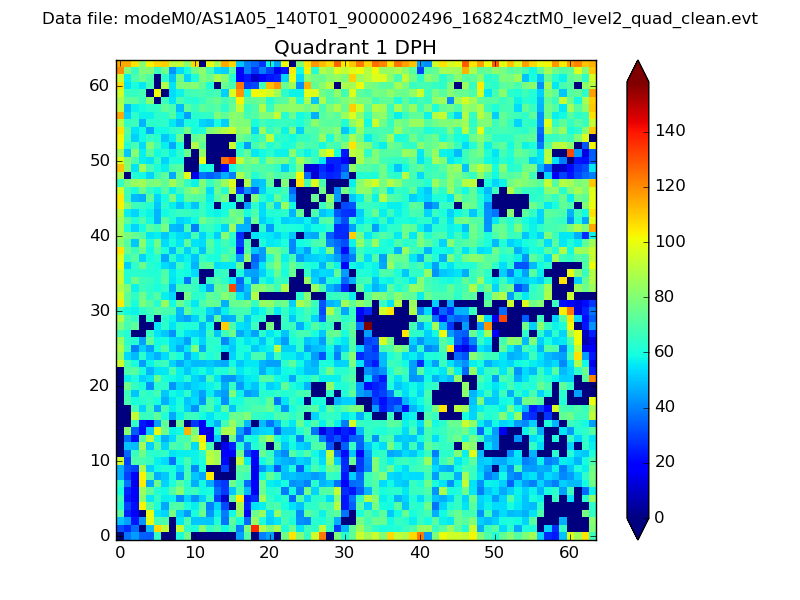
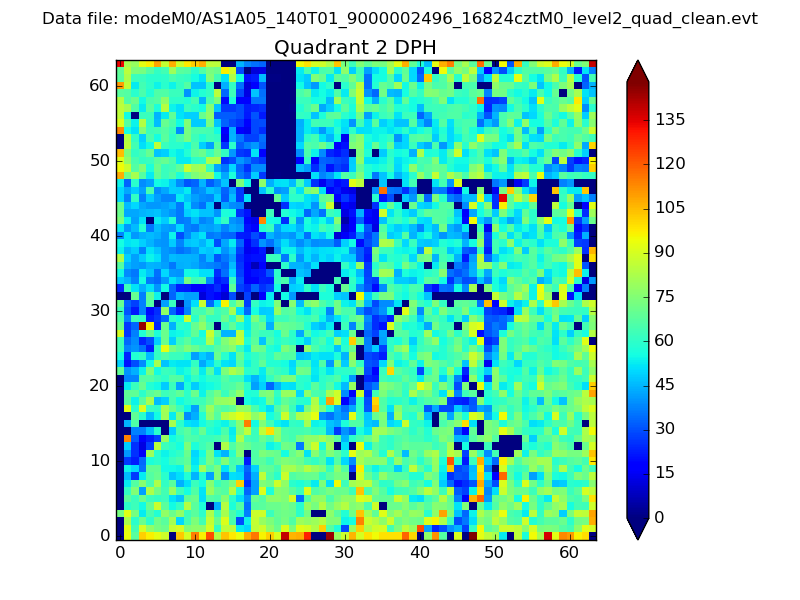
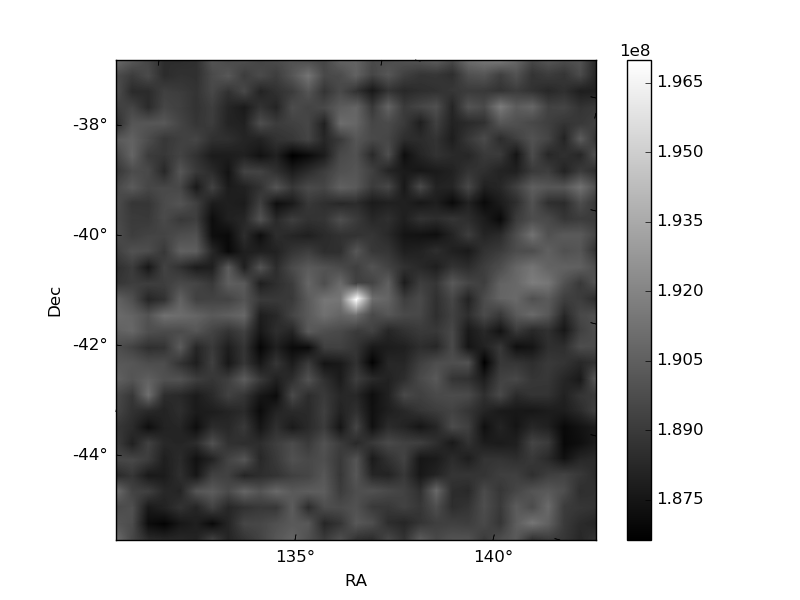
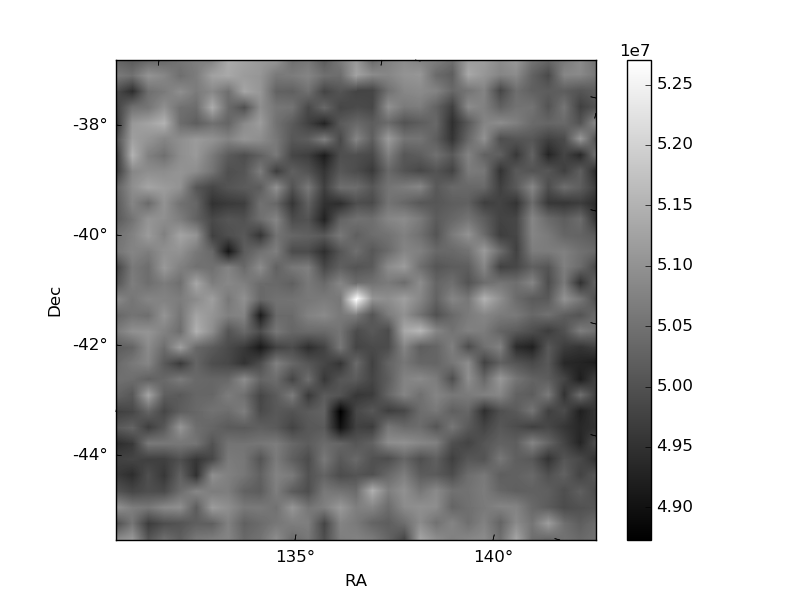
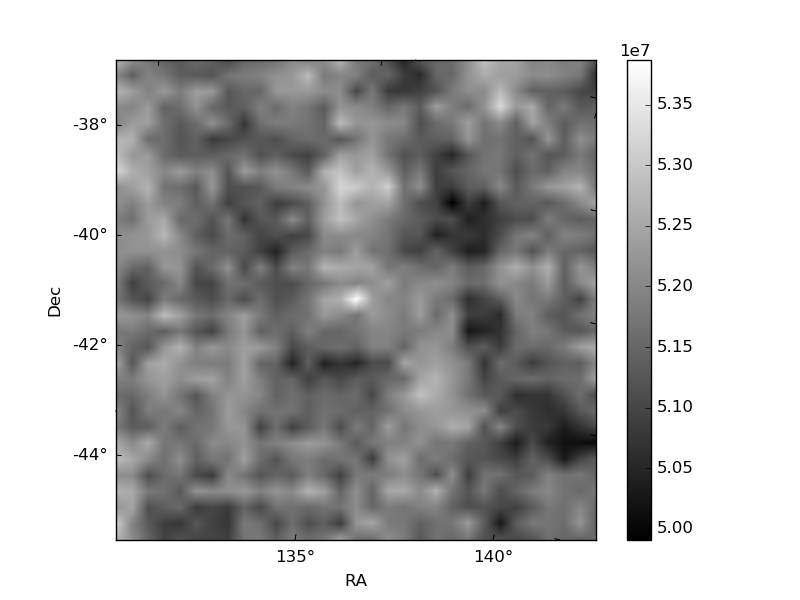
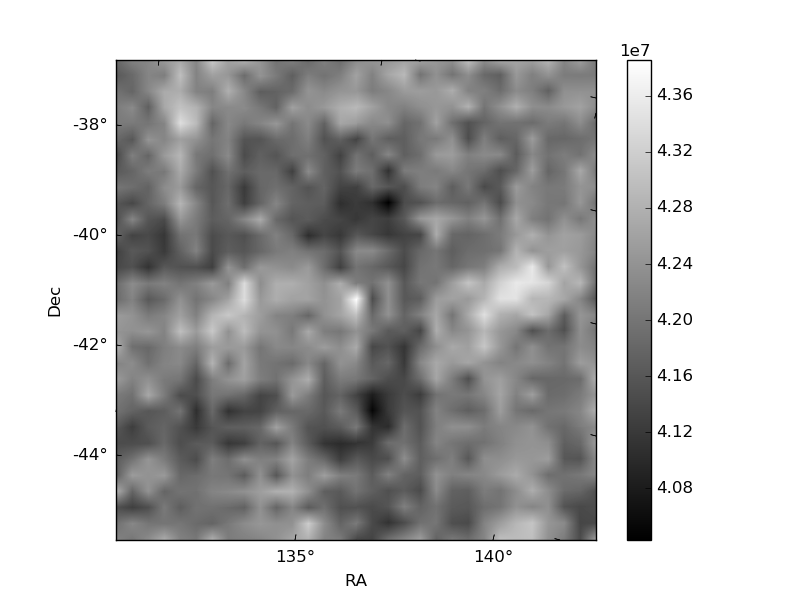
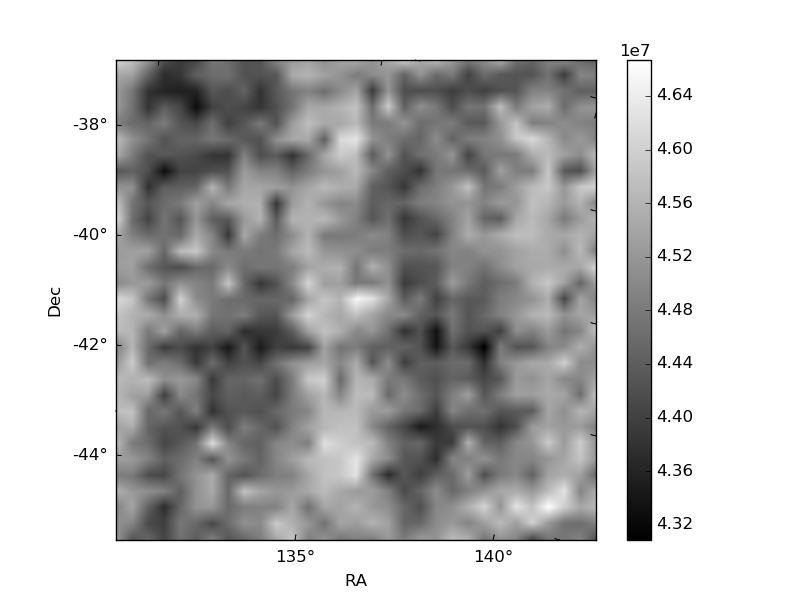
Histogram calculated using DETX and DETY for each event in the final _common_clean file
| Quadrant A | 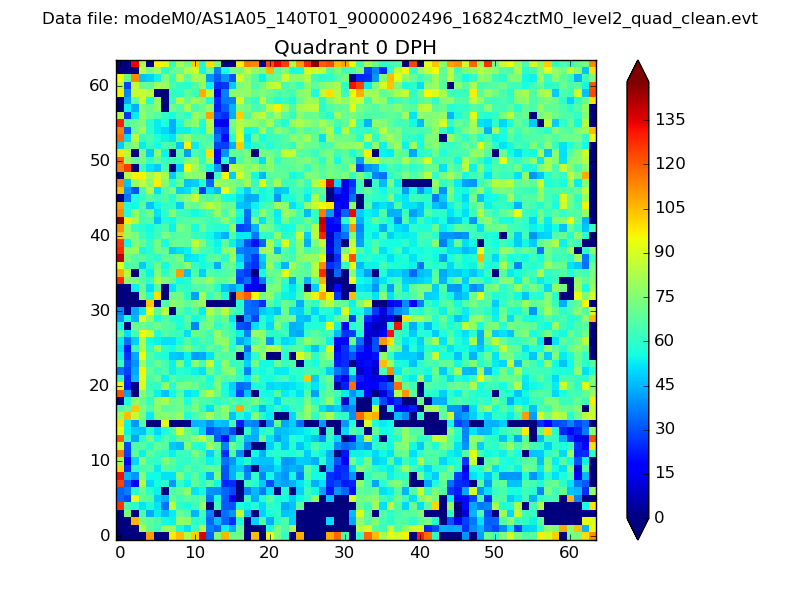 |
 |
Quadrant B |
|---|---|---|---|
| Quadrant D | 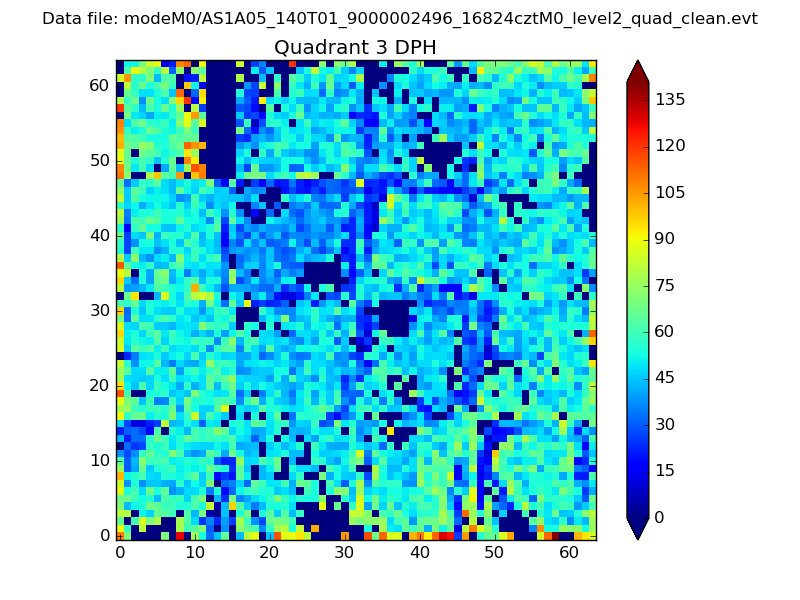 |
 |
Quadrant C |
| Plot type | Count rate plots | Images |
|---|---|---|
| Comparison with Poisson distribution Blue bars denote a histogram of data divided into 1 sec bins. Red curve is a Poisson curve with rate = median count rate of data. |
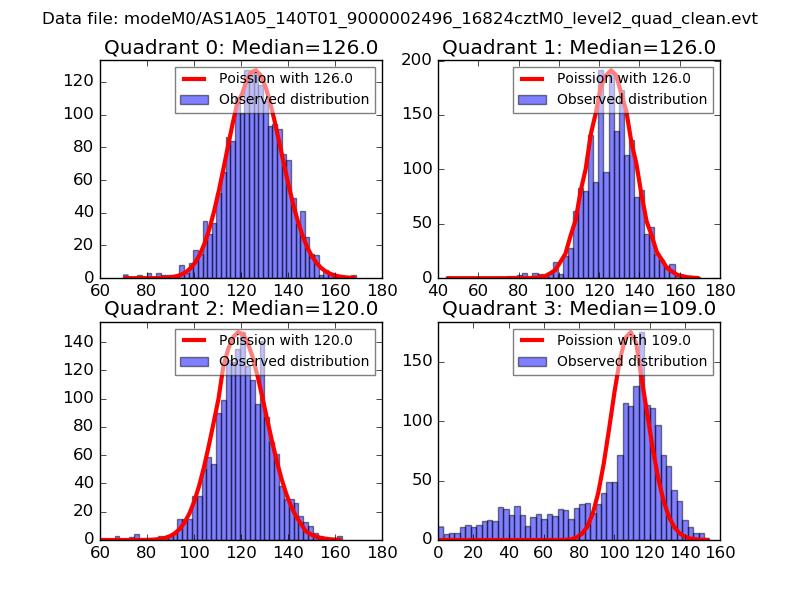 |
 |
| Quadrant-wise count rates Data is divided into 100 sec bins |
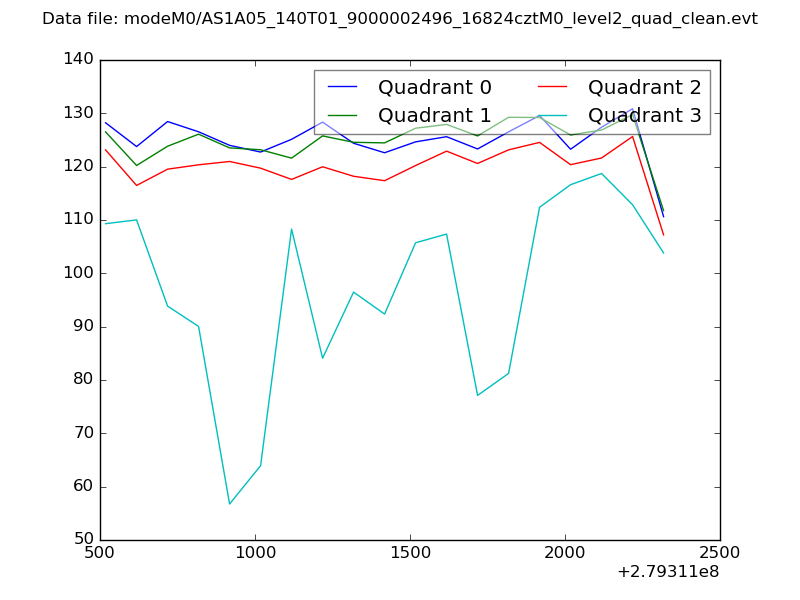 |
|
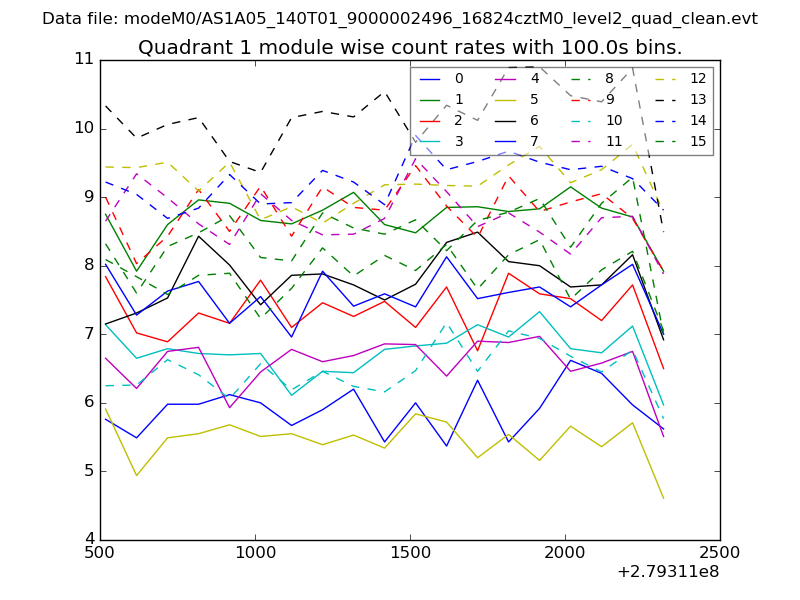
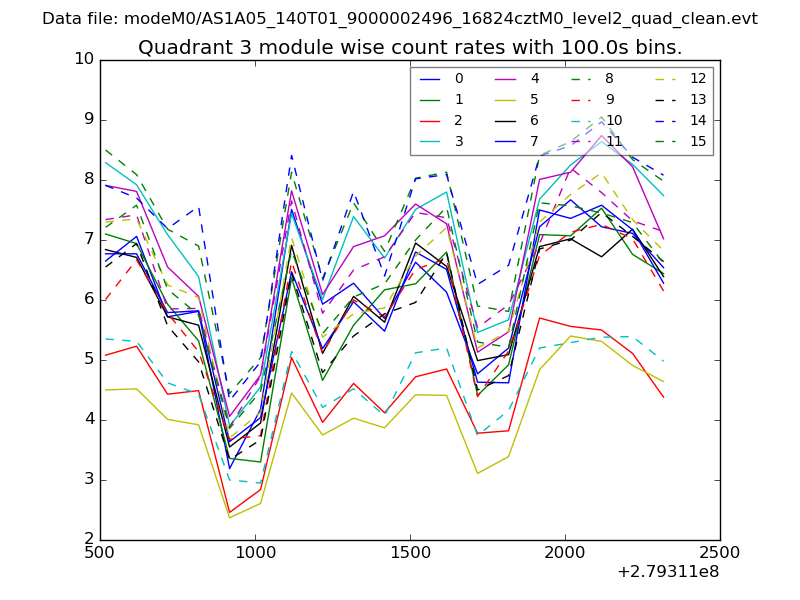
| Module-wise count rates for Quadrant A Data is divided into 100 sec bins |
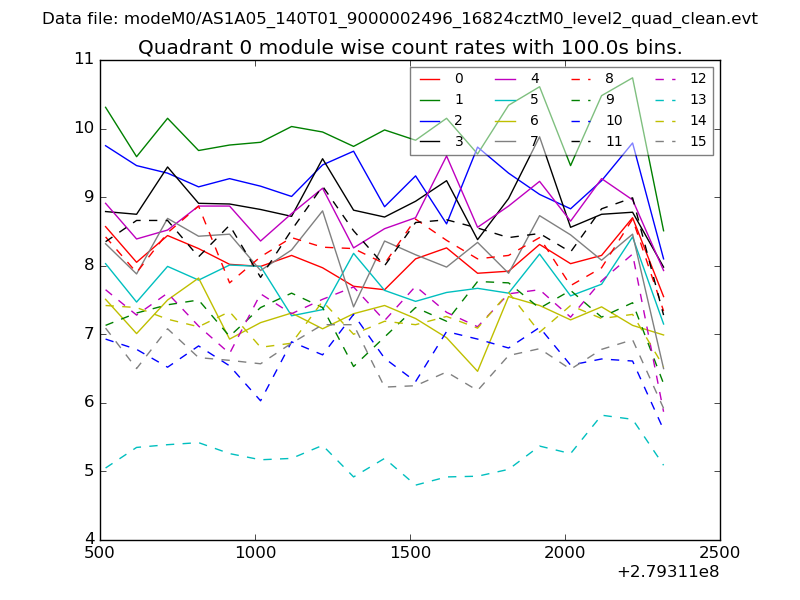 |
 |
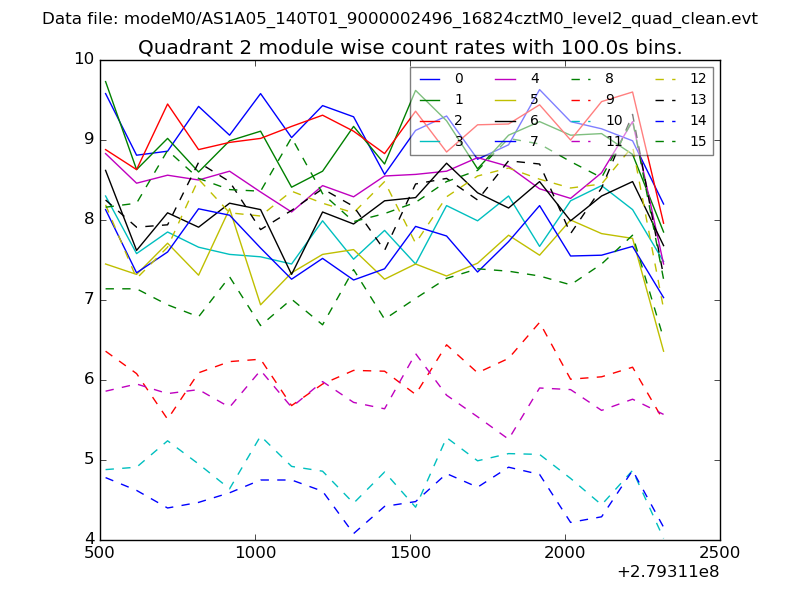
| Module-wise count rates for Quadrant B Data is divided into 100 sec bins |
 |
 |
| Module-wise count rates for Quadrant C Data is divided into 100 sec bins |
 |
 |
| Module-wise count rates for Quadrant D Data is divided into 100 sec bins |
 |
 |
| Parameter | Plot |
|---|---|
| CZT HV Monitor | 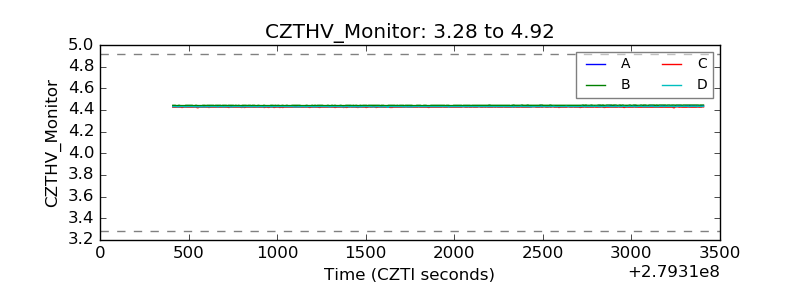 |
| D_VDD | 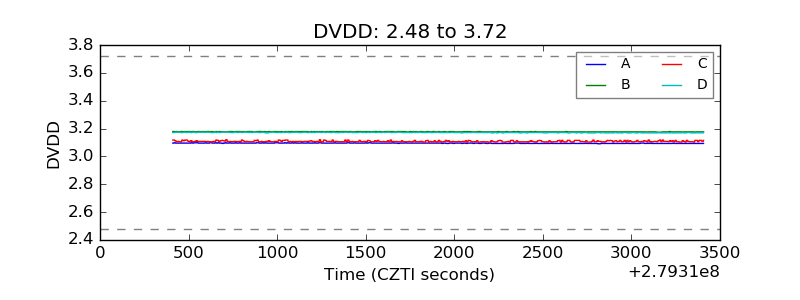 |
| Temperature 1 | 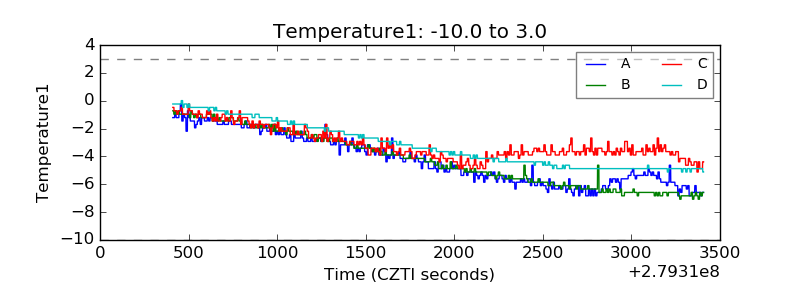 |
| Veto HV Monitor | 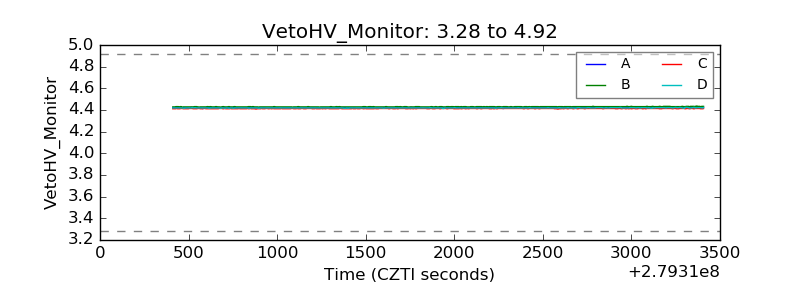 |
| Veto LLD | 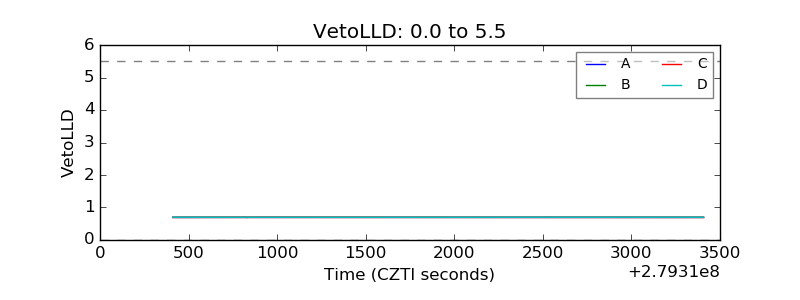 |
| Alpha Counter | 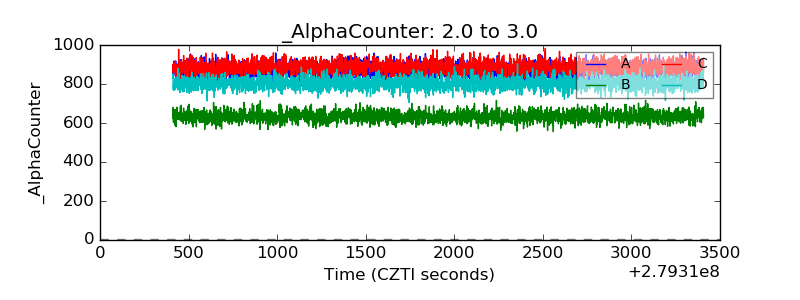 |
| _CPM_Rate | 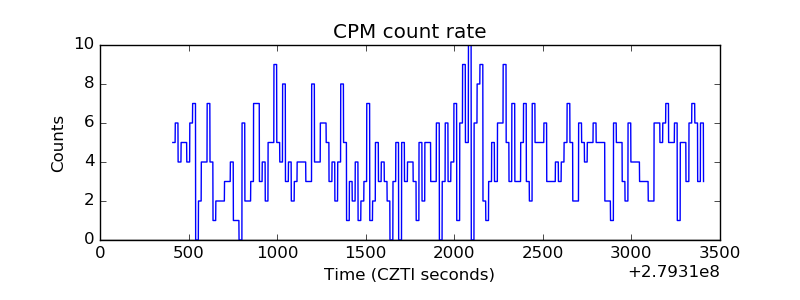 |
| CZT Counter | 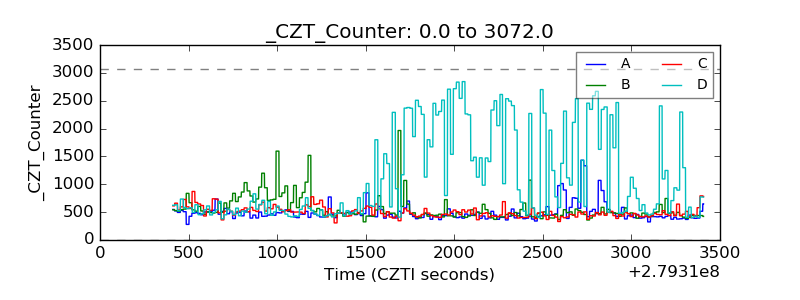 |
| +2.5 Volts monitor |  |
| +5 Volts monitor |  |
| _ROLL_ROT | 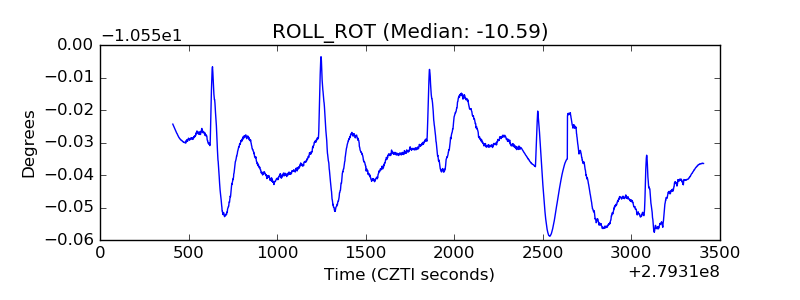 |
| _Roll_DEC | 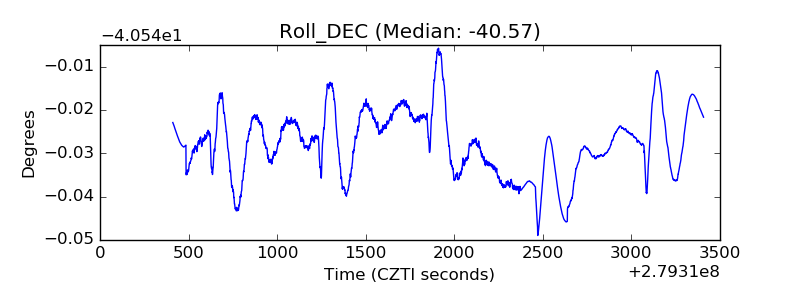 |
| _Roll_RA | 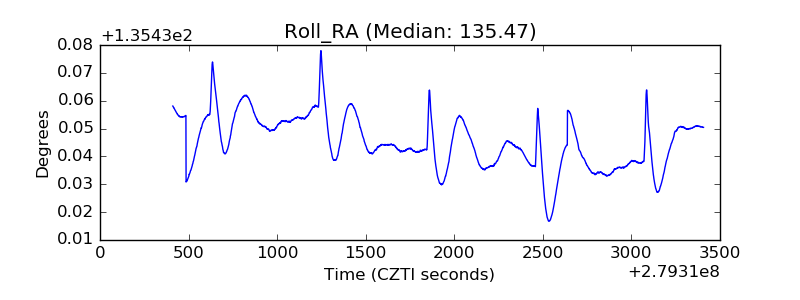 |
| Veto Counter | 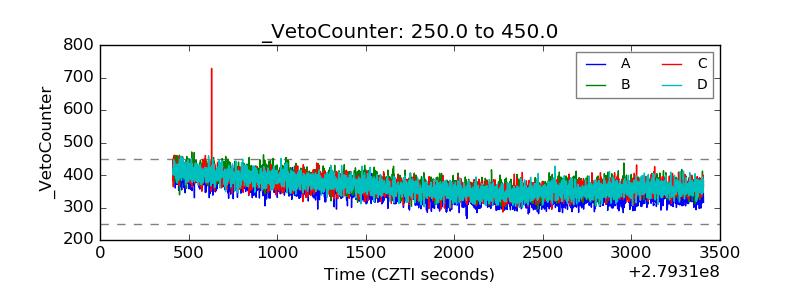 |