| Param | Original file | Final file |
|---|---|---|
| Filename | modeM0/AS1A05_056T01_9000002498_16824cztM0_level2.evt | modeM0/AS1A05_056T01_9000002498_16824cztM0_level2_quad_clean.evt |
| Size (bytes) | 330,223,680 | 33,465,600 |
| Size | 314.9 MB | 31.9 MB |
| Events in quadrant A | 1,922,681 | 197,945 |
| Events in quadrant B | 1,918,123 | 201,343 |
| Events in quadrant C | 1,915,949 | 188,301 |
| Events in quadrant D | 4,010,002 | 181,704 |
| Mode M9 | |||
|---|---|---|---|
| Quadrant | BADHDUFLAG | Total packets | Discarded packets |
| A | 0 | 4 | 0 |
| B | 0 | 4 | 0 |
| C | 0 | 4 | 0 |
| D | 0 | 4 | 0 |
| Mode SS | |||
|---|---|---|---|
| Quadrant | BADHDUFLAG | Total packets | Discarded packets |
| A | 0 | 70 | 0 |
| B | 0 | 70 | 0 |
| C | 0 | 70 | 0 |
| D | 0 | 70 | 0 |
| Mode M0 | |||
|---|---|---|---|
| Quadrant | BADHDUFLAG | Total packets | Discarded packets |
| A | 0 | 7861 | 2 |
| B | 0 | 7844 | 1 |
| C | 0 | 7979 | 1 |
| D | 0 | 14271 | 1 |
| Quadrant | Total seconds | Saturated seconds | Saturation percentage |
|---|---|---|---|
| A | 3434 | 50 | 1.456028% |
| B | 3434 | 48 | 1.397787% |
| C | 3434 | 43 | 1.252184% |
| D | 3434 | 806 | 23.471171% |
Noise dominated data is calculated using 1-second bins in cleaned event files. If a bin has >2000 counts, and if more than 50% of those come from <1% of pixels, then it is considered to be noise-dominated and hence unusable.
| Quadrant | # 1 sec bins | Bins with >0 counts | Bins with >2000 counts | High rate bins dominated by noise | Noise dominated (total time) | Noise dominated (detector-on time) | Marked lightcurve |
|---|---|---|---|---|---|---|---|
| A | 3850 | 3436 | 25 | 25 | 0.65% | 0.73% | 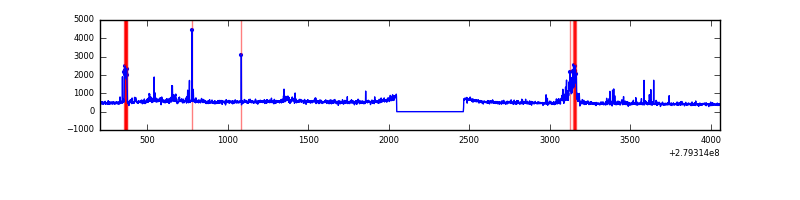 |
| B | 3850 | 3436 | 5 | 5 | 0.13% | 0.15% | 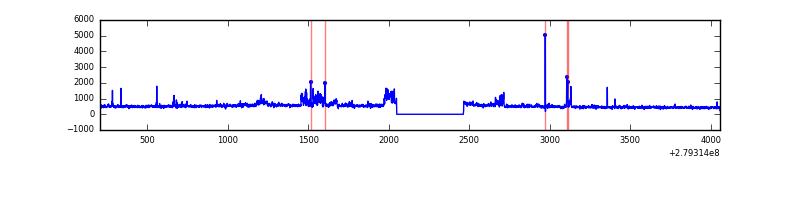 |
| C | 3850 | 3436 | 0 | 0 | 0.00% | 0.00% | 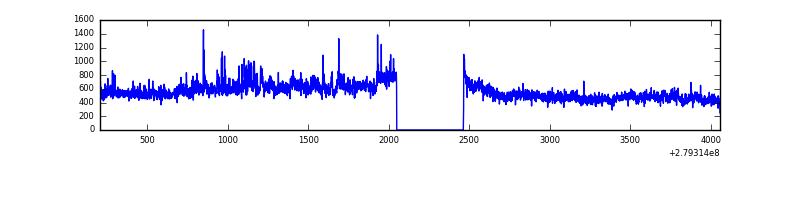 |
| D | 3850 | 3436 | 577 | 577 | 14.99% | 16.79% | 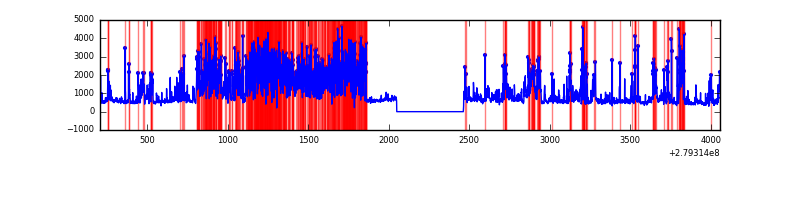 |
Top three noisy pixels from each quadrant. If the there are fewer than three noisy pixels in the level2.evt file, extra rows are filled as -1
| Pixel properties | Quadrant properties | ||||||
|---|---|---|---|---|---|---|---|
| Quadrant | DetID | PixID | Counts | Sigma | Mean | Median | Sigma |
| A | 15 | 174 | 196897 | 2169.35 | 437 | 427 | 90.6 |
| A | 9 | 143 | 47146 | 515.86 | 437 | 427 | 90.6 |
| A | 0 | 226 | 3893 | 38.27 | 437 | 427 | 90.6 |
| B | 15 | 35 | 98883 | 1147.74 | 433 | 423 | 85.8 |
| B | 0 | 229 | 84468 | 979.71 | 433 | 423 | 85.8 |
| B | 3 | 64 | 23758 | 272.01 | 433 | 423 | 85.8 |
| C | 3 | 233 | 129111 | 1306.62 | 413 | 415 | 98.5 |
| C | 0 | 207 | 106442 | 1076.47 | 413 | 415 | 98.5 |
| C | 14 | 238 | 64141 | 646.99 | 413 | 415 | 98.5 |
| D | 1 | 52 | 2522111 | 27005.57 | 378 | 365 | 93.4 |
| D | 5 | 222 | 56342 | 599.46 | 378 | 365 | 93.4 |
| D | 2 | 234 | 12266 | 127.44 | 378 | 365 | 93.4 |
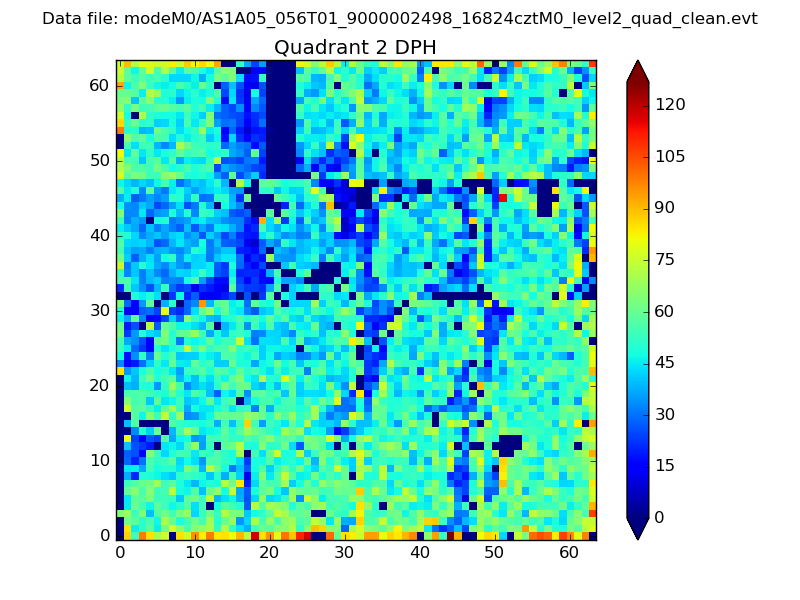
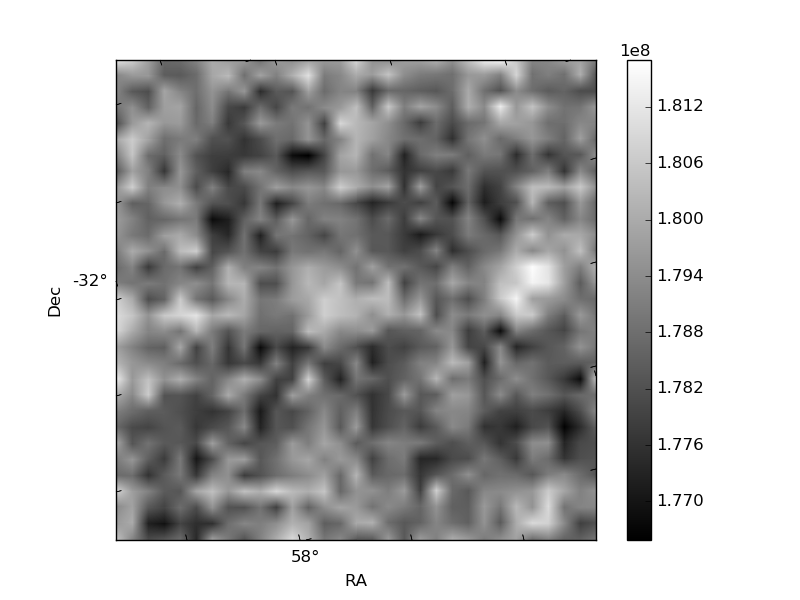
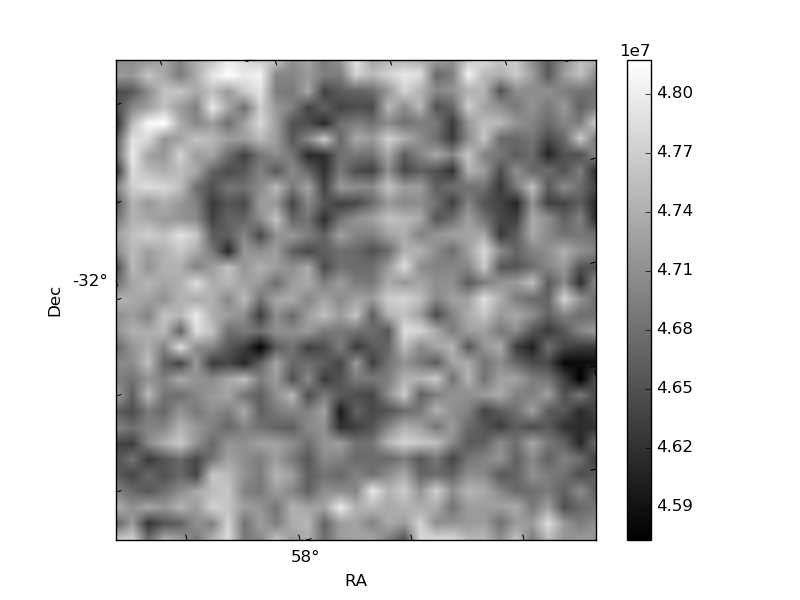
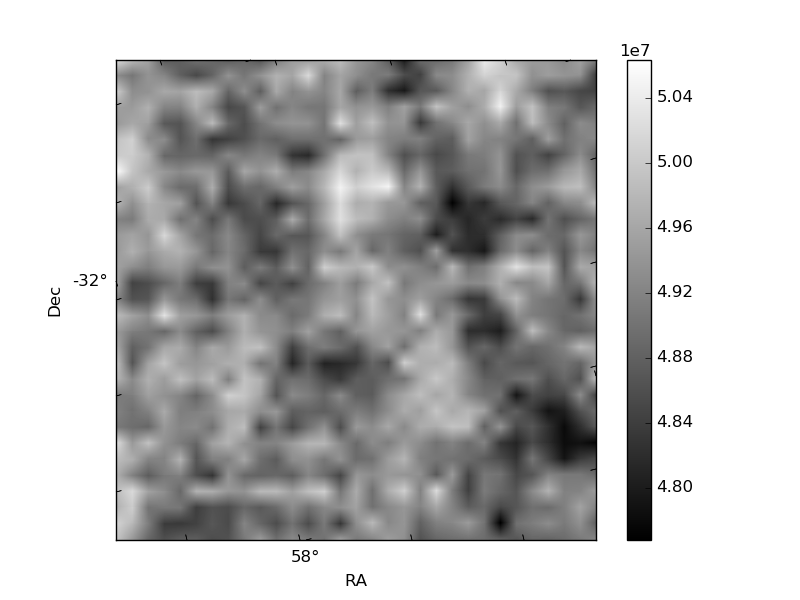
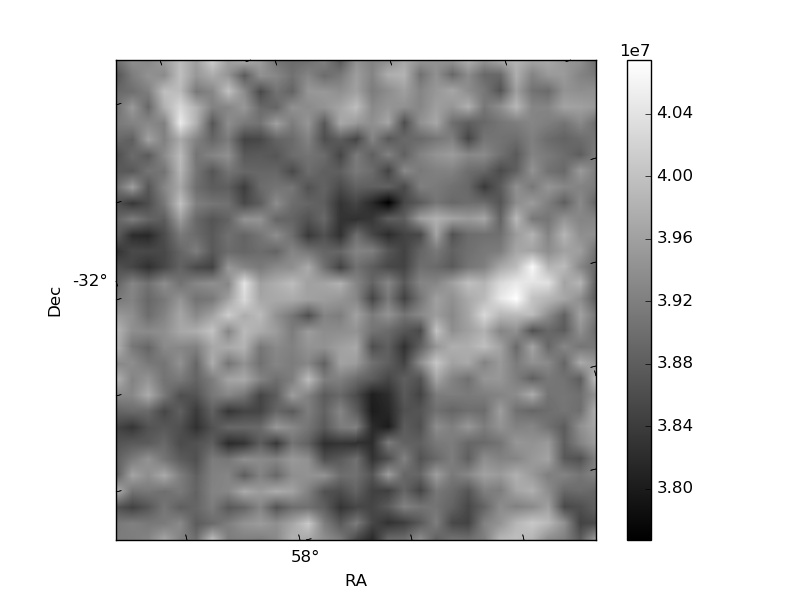
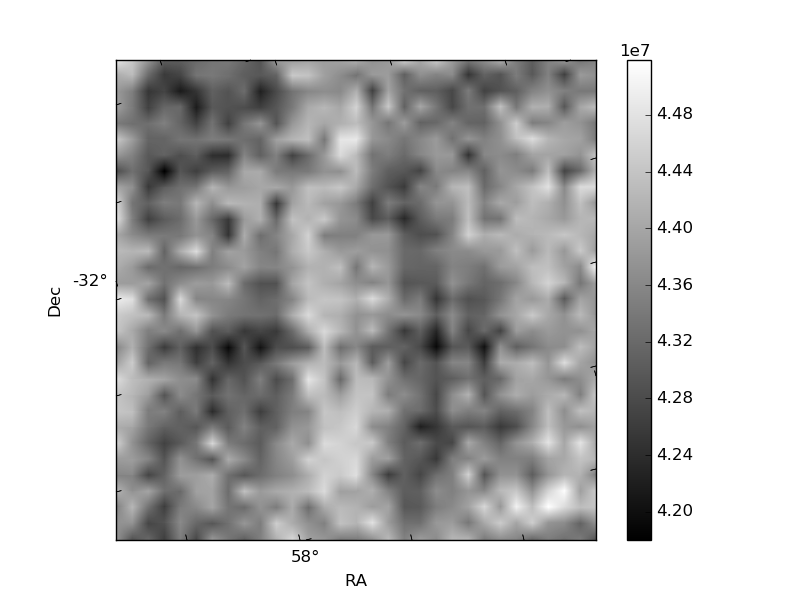
Histogram calculated using DETX and DETY for each event in the final _common_clean file
| Quadrant A | 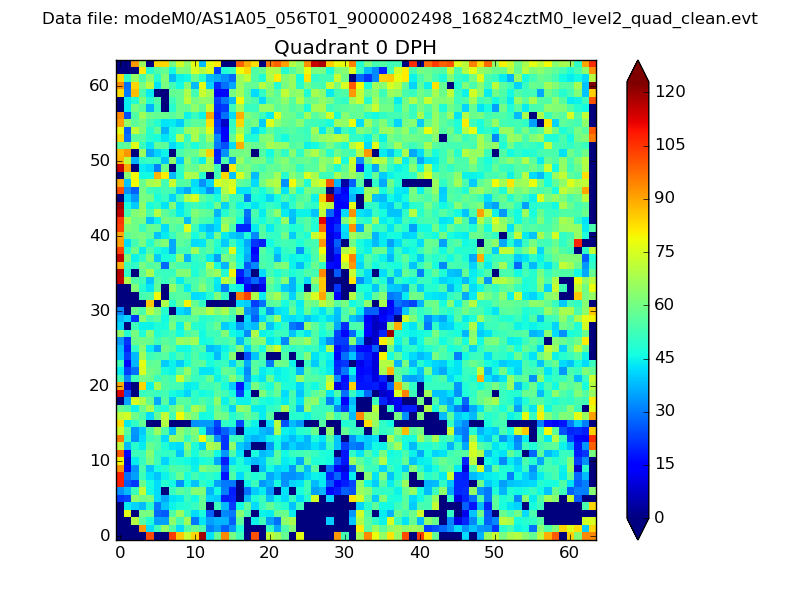 |
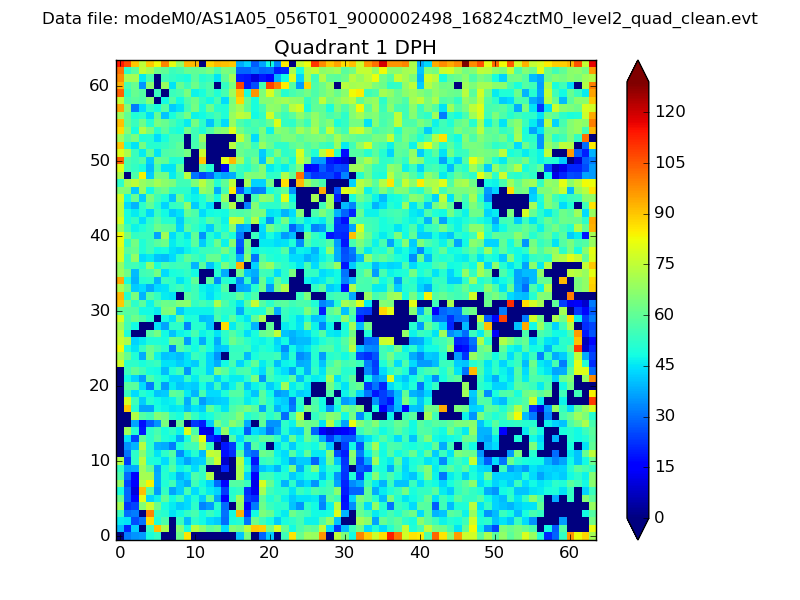 |
Quadrant B |
|---|---|---|---|
| Quadrant D | 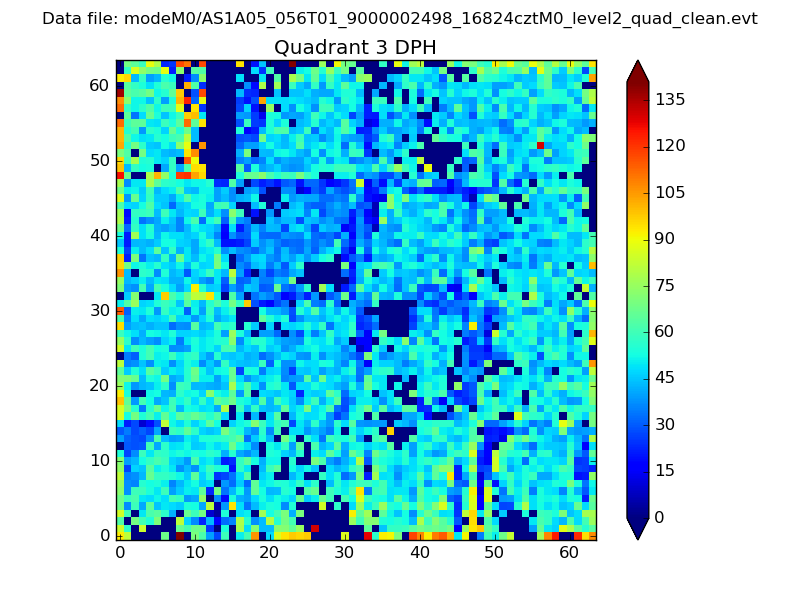 |
 |
Quadrant C |
| Plot type | Count rate plots | Images |
|---|---|---|
| Comparison with Poisson distribution Blue bars denote a histogram of data divided into 1 sec bins. Red curve is a Poisson curve with rate = median count rate of data. |
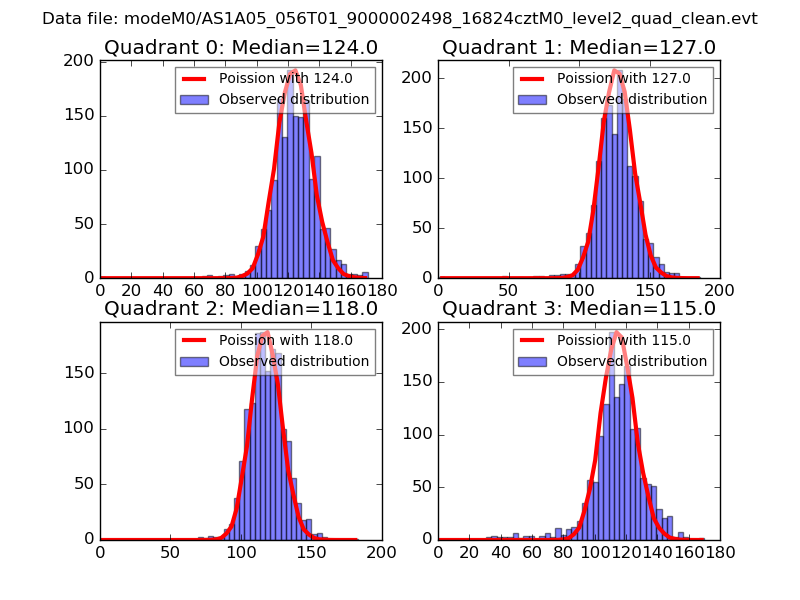 |
 |
| Quadrant-wise count rates Data is divided into 100 sec bins |
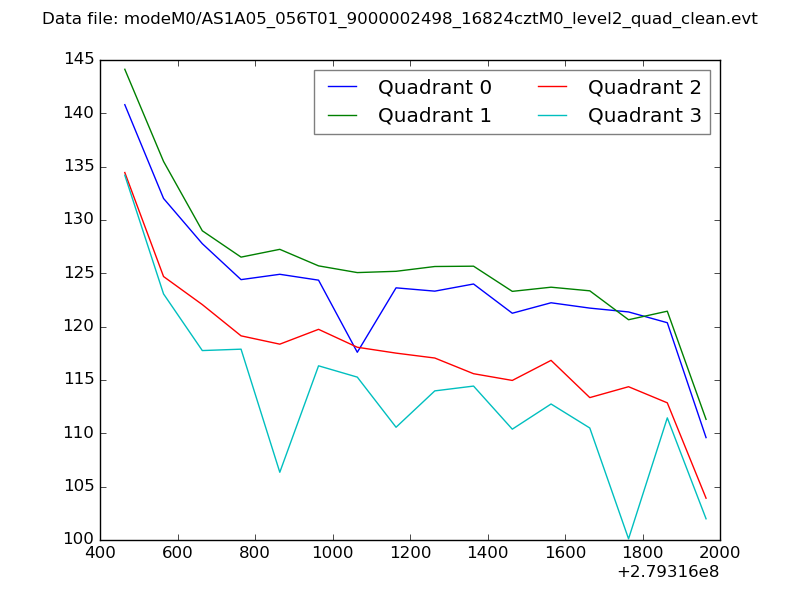 |
|
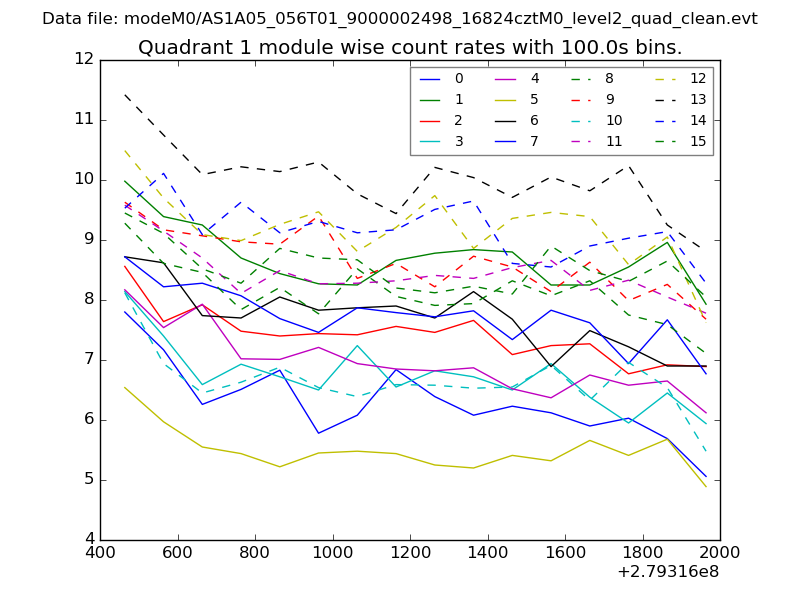
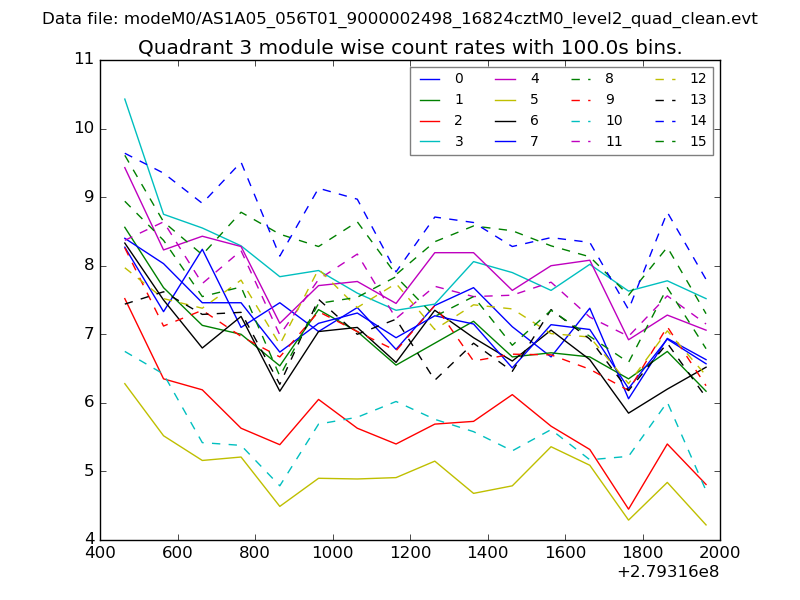
| Module-wise count rates for Quadrant A Data is divided into 100 sec bins |
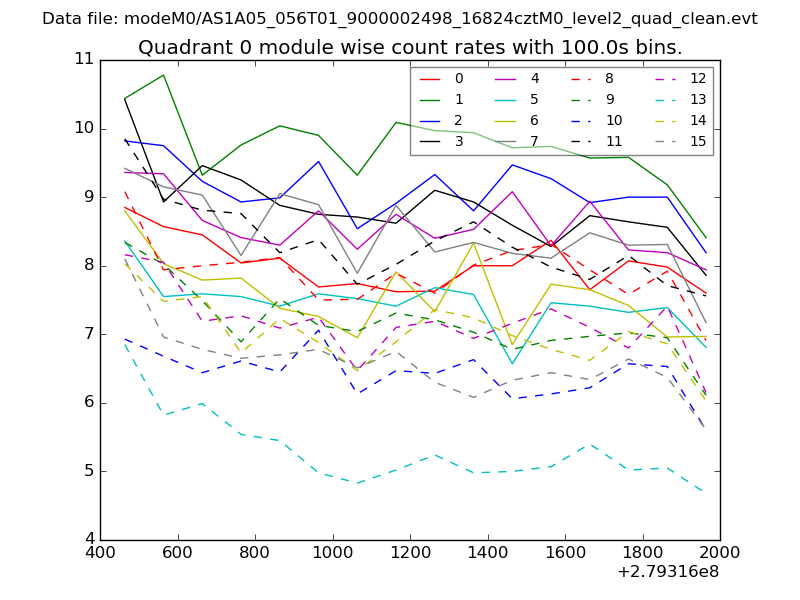 |
 |
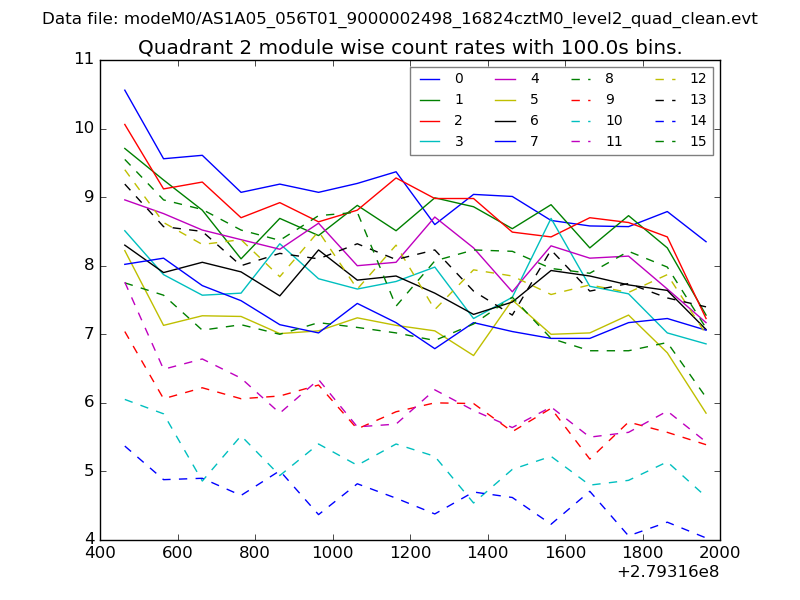
| Module-wise count rates for Quadrant B Data is divided into 100 sec bins |
 |
 |
| Module-wise count rates for Quadrant C Data is divided into 100 sec bins |
 |
 |
| Module-wise count rates for Quadrant D Data is divided into 100 sec bins |
 |
 |
| Parameter | Plot |
|---|---|
| CZT HV Monitor | 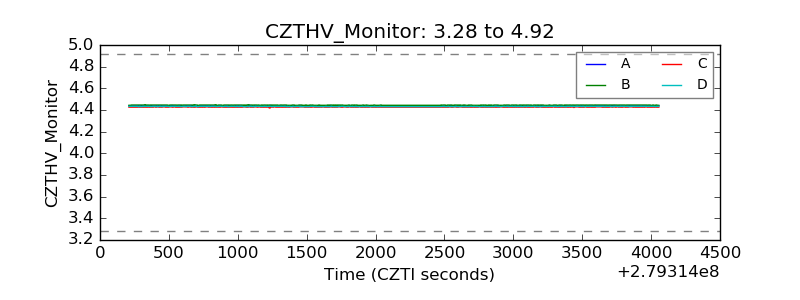 |
| D_VDD | 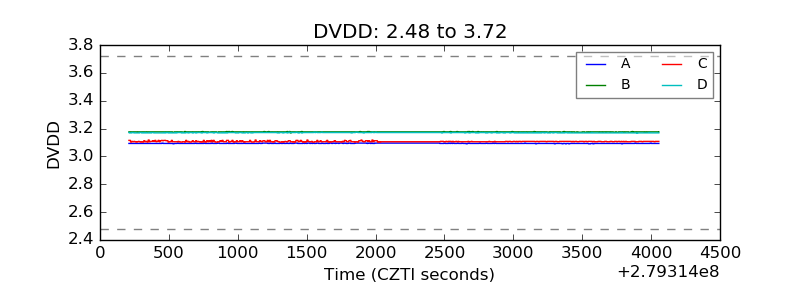 |
| Temperature 1 | 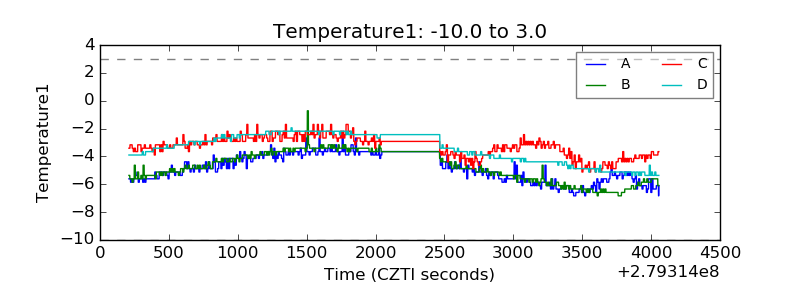 |
| Veto HV Monitor | 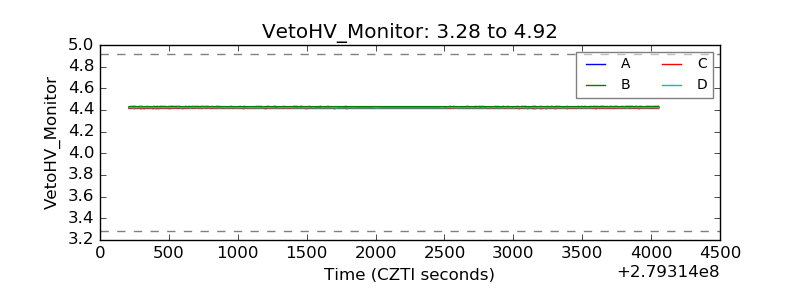 |
| Veto LLD | 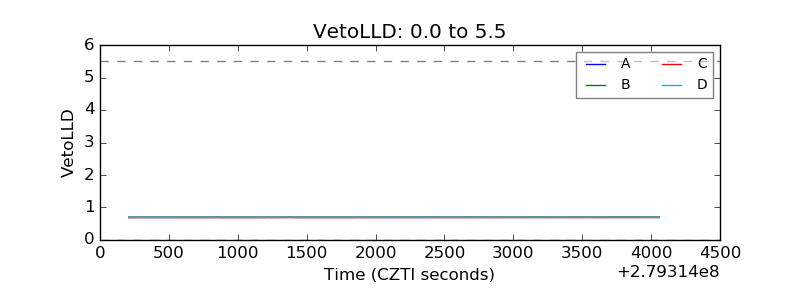 |
| Alpha Counter | 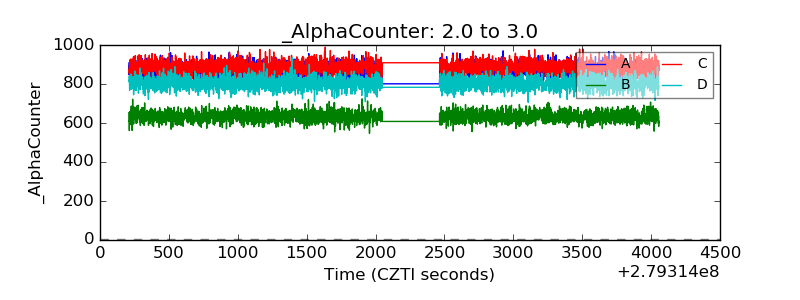 |
| _CPM_Rate | 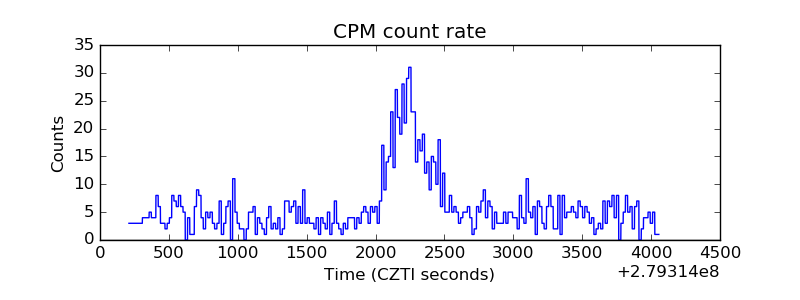 |
| CZT Counter | 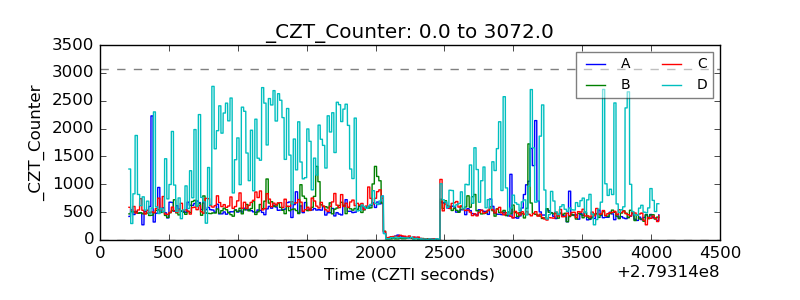 |
| +2.5 Volts monitor |  |
| +5 Volts monitor |  |
| _ROLL_ROT | 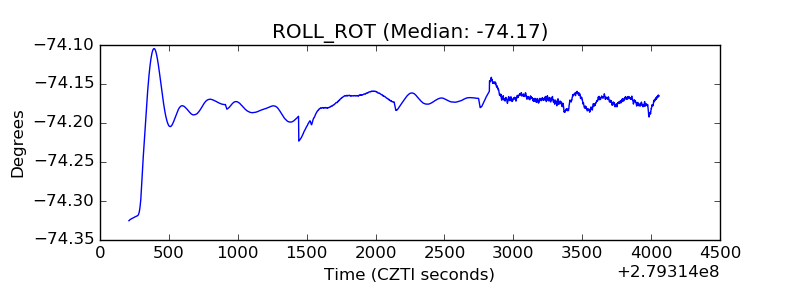 |
| _Roll_DEC | 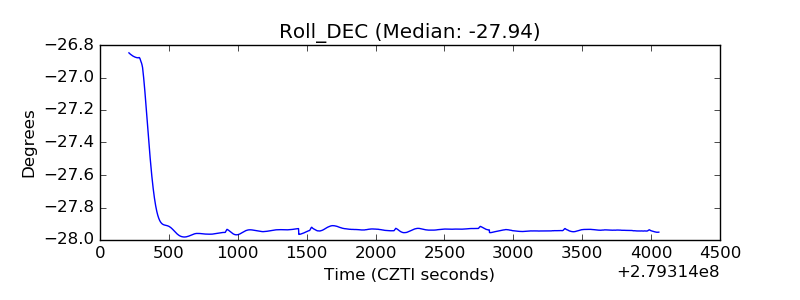 |
| _Roll_RA | 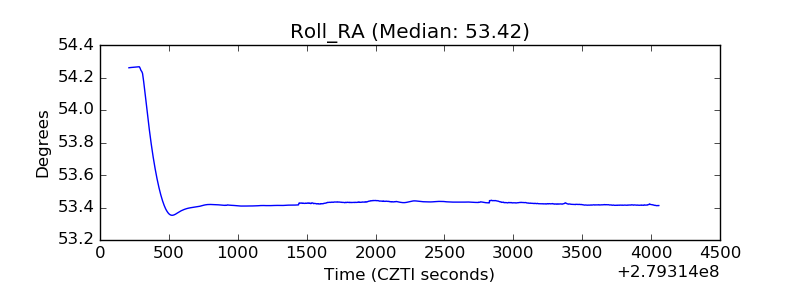 |
| Veto Counter | 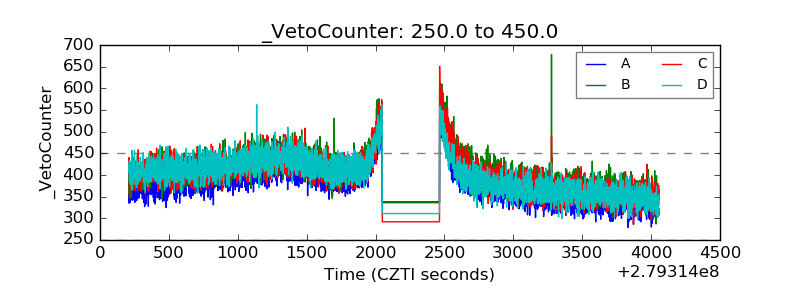 |