| Param | Original file | Final file |
|---|---|---|
| Filename | modeM0/AS1A05_056T01_9000002498_16827cztM0_level2.evt | modeM0/AS1A05_056T01_9000002498_16827cztM0_level2_quad_clean.evt |
| Size (bytes) | 1,421,035,200 | 234,233,280 |
| Size | 1.3 GB | 223.4 MB |
| Events in quadrant A | 8,945,375 | 1,495,041 |
| Events in quadrant B | 9,057,853 | 1,517,709 |
| Events in quadrant C | 9,314,571 | 1,419,117 |
| Events in quadrant D | 14,454,282 | 1,372,007 |
| Mode M9 | |||
|---|---|---|---|
| Quadrant | BADHDUFLAG | Total packets | Discarded packets |
| A | 0 | 19 | 0 |
| B | 0 | 19 | 0 |
| C | 0 | 19 | 0 |
| D | 0 | 20 | 0 |
| Mode SS | |||
|---|---|---|---|
| Quadrant | BADHDUFLAG | Total packets | Discarded packets |
| A | 0 | 380 | 0 |
| B | 0 | 380 | 0 |
| C | 0 | 380 | 0 |
| D | 0 | 380 | 0 |
| Mode M0 | |||
|---|---|---|---|
| Quadrant | BADHDUFLAG | Total packets | Discarded packets |
| A | 0 | 39073 | 5 |
| B | 0 | 39146 | 4 |
| C | 0 | 38854 | 4 |
| D | 0 | 55957 | 4 |
| Quadrant | Total seconds | Saturated seconds | Saturation percentage |
|---|---|---|---|
| A | 18726 | 115 | 0.614119% |
| B | 18726 | 133 | 0.710242% |
| C | 18726 | 171 | 0.913169% |
| D | 18726 | 1013 | 5.409591% |
Noise dominated data is calculated using 1-second bins in cleaned event files. If a bin has >2000 counts, and if more than 50% of those come from <1% of pixels, then it is considered to be noise-dominated and hence unusable.
| Quadrant | # 1 sec bins | Bins with >0 counts | Bins with >2000 counts | High rate bins dominated by noise | Noise dominated (total time) | Noise dominated (detector-on time) | Marked lightcurve |
|---|---|---|---|---|---|---|---|
| A | 20422 | 18730 | 35 | 35 | 0.17% | 0.19% | 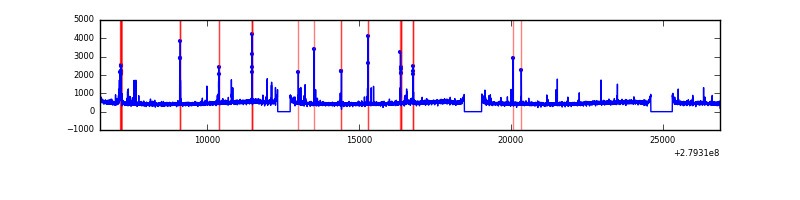 |
| B | 20422 | 18730 | 13 | 13 | 0.06% | 0.07% | 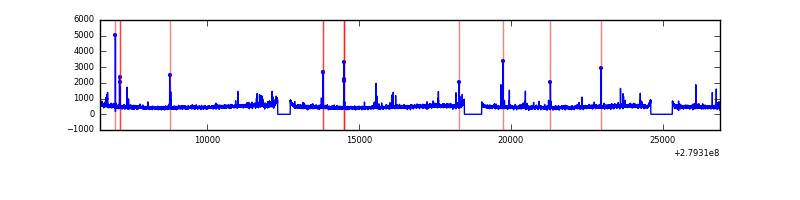 |
| C | 20422 | 18730 | 0 | 0 | 0.00% | 0.00% | 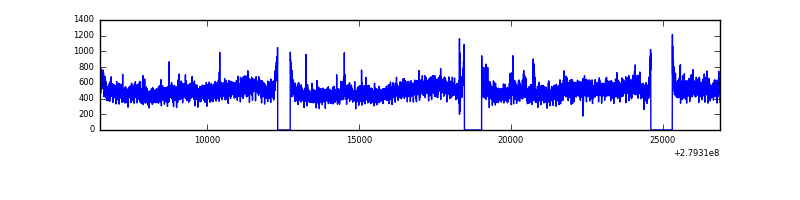 |
| D | 20422 | 18730 | 851 | 851 | 4.17% | 4.54% | 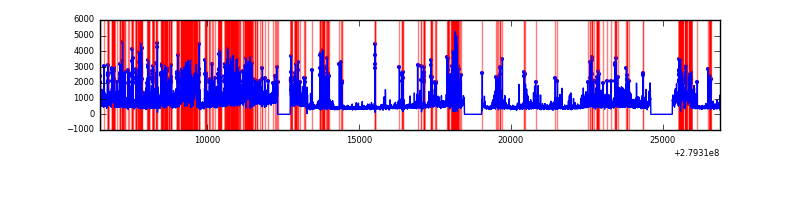 |
Top three noisy pixels from each quadrant. If the there are fewer than three noisy pixels in the level2.evt file, extra rows are filled as -1
| Pixel properties | Quadrant properties | ||||||
|---|---|---|---|---|---|---|---|
| Quadrant | DetID | PixID | Counts | Sigma | Mean | Median | Sigma |
| A | 9 | 143 | 231020 | 508.11 | 2229 | 2176 | 450.4 |
| A | 15 | 174 | 146077 | 319.51 | 2229 | 2176 | 450.4 |
| A | 0 | 226 | 19524 | 38.52 | 2229 | 2176 | 450.4 |
| B | 15 | 35 | 94320 | 215.43 | 2231 | 2170 | 427.7 |
| B | 4 | 173 | 86427 | 196.98 | 2231 | 2170 | 427.7 |
| B | 0 | 230 | 54635 | 122.66 | 2231 | 2170 | 427.7 |
| C | 3 | 233 | 631704 | 1256.95 | 2138 | 2149 | 500.9 |
| C | 14 | 238 | 331220 | 657.01 | 2138 | 2149 | 500.9 |
| C | 0 | 207 | 15737 | 27.13 | 2138 | 2149 | 500.9 |
| D | 1 | 52 | 4929834 | 9548.85 | 2127 | 2065 | 516.1 |
| D | 5 | 222 | 1386780 | 2683.25 | 2127 | 2065 | 516.1 |
| D | 2 | 234 | 74935 | 141.2 | 2127 | 2065 | 516.1 |
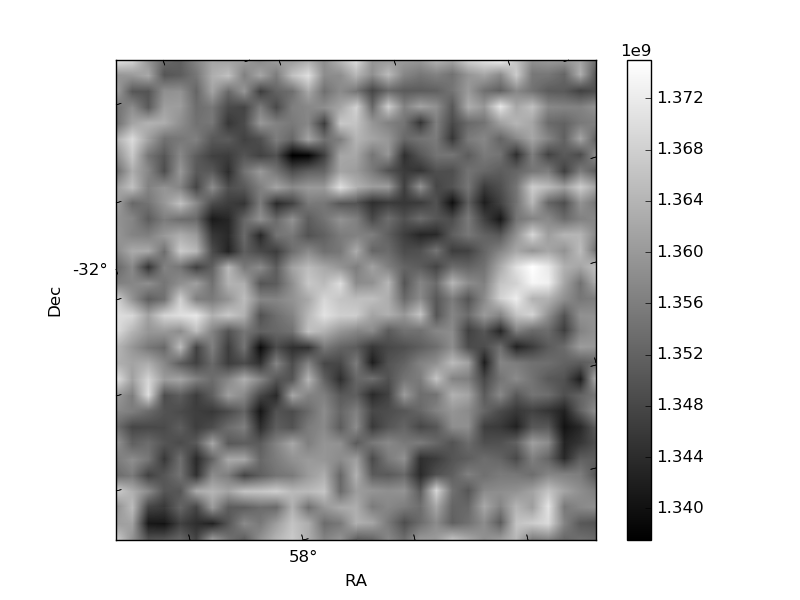
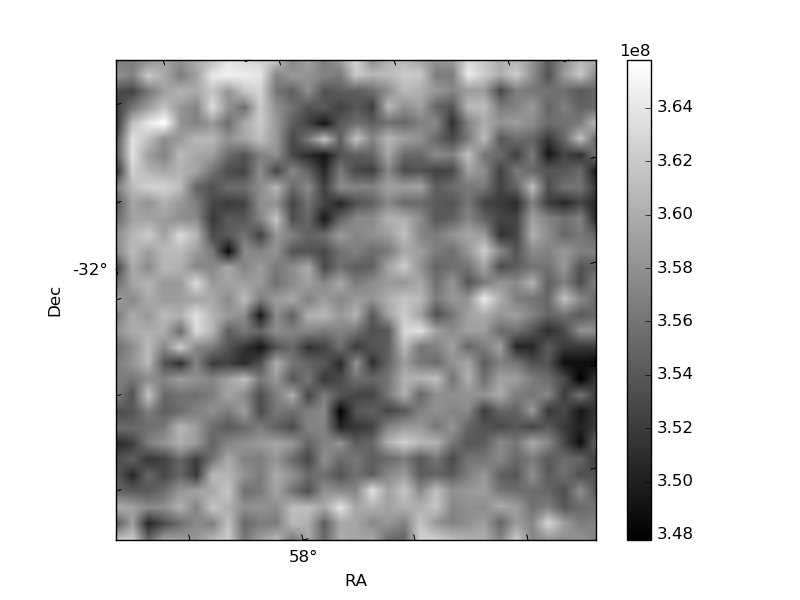
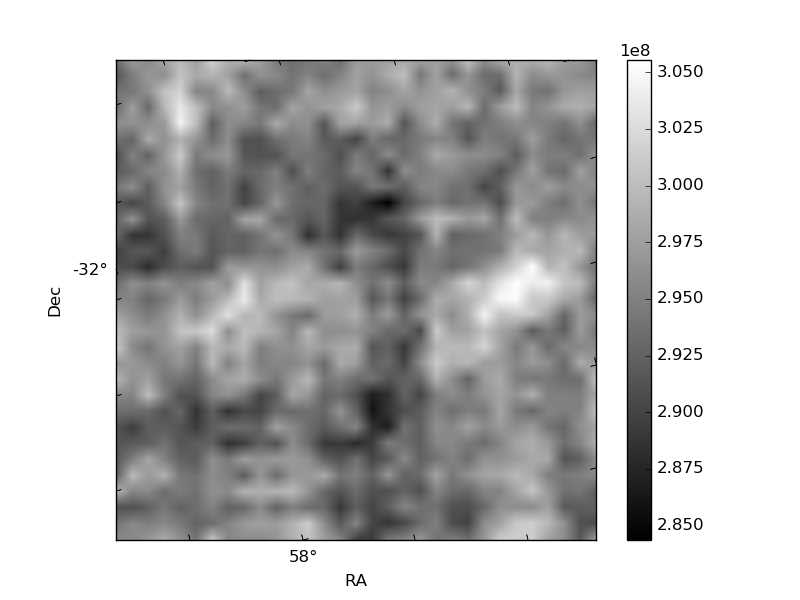
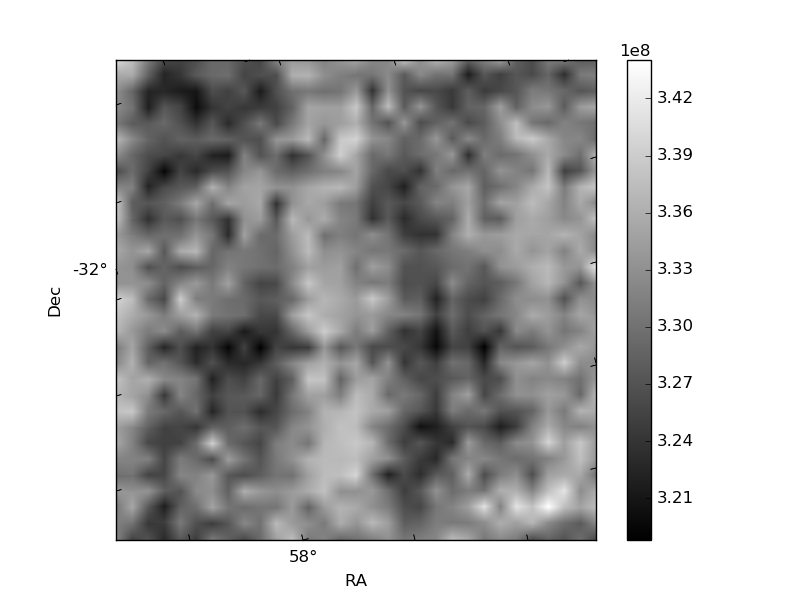
Histogram calculated using DETX and DETY for each event in the final _common_clean file
| Quadrant A | 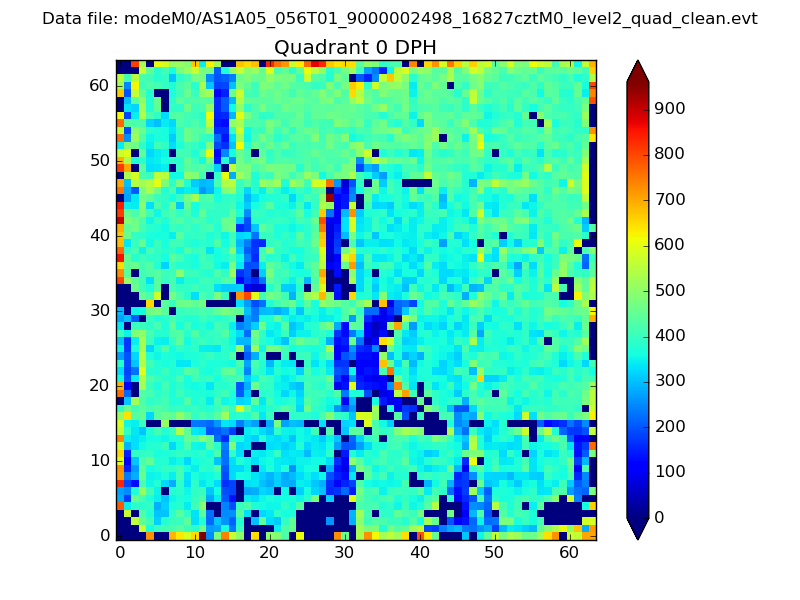 |
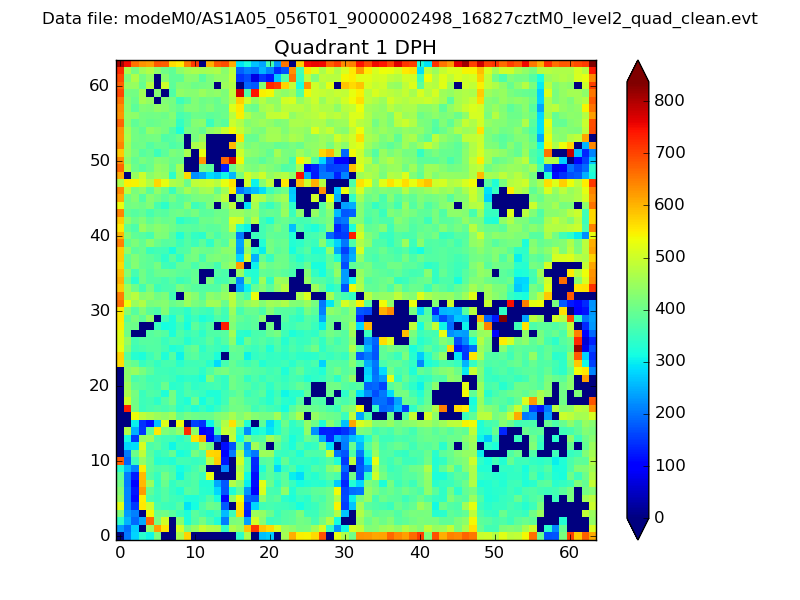 |
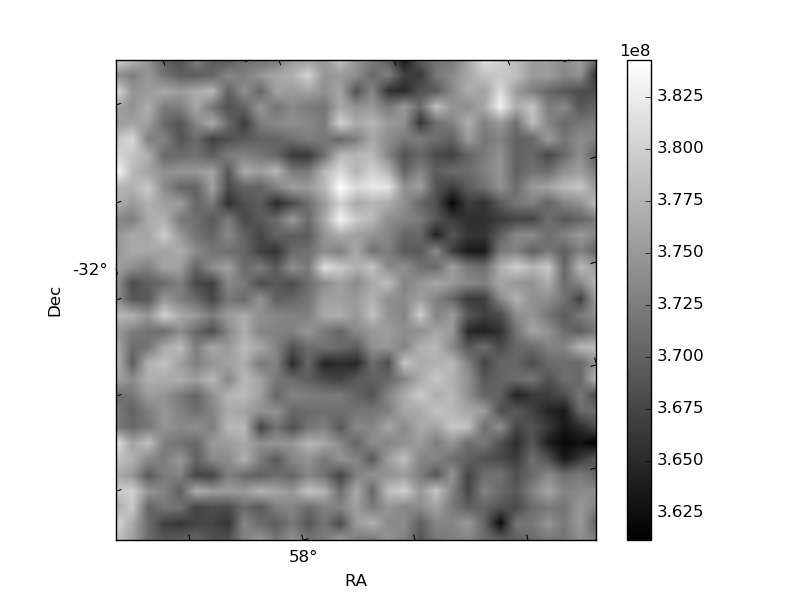
Quadrant B |
|---|---|---|---|
| Quadrant D | 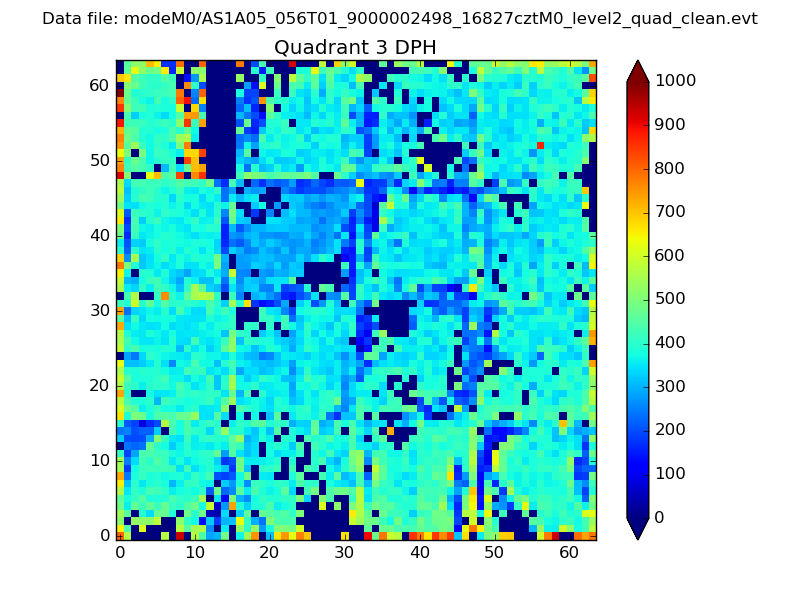 |
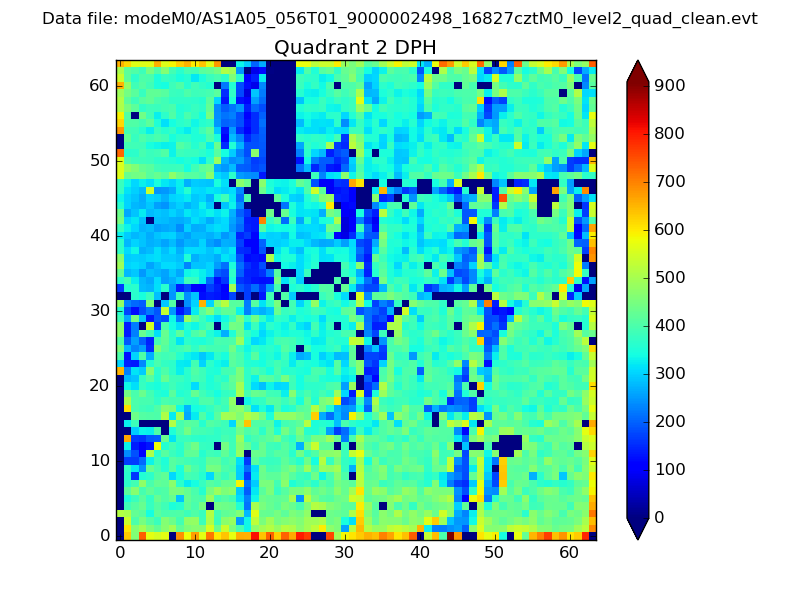 |
Quadrant C |
| Plot type | Count rate plots | Images |
|---|---|---|
| Comparison with Poisson distribution Blue bars denote a histogram of data divided into 1 sec bins. Red curve is a Poisson curve with rate = median count rate of data. |
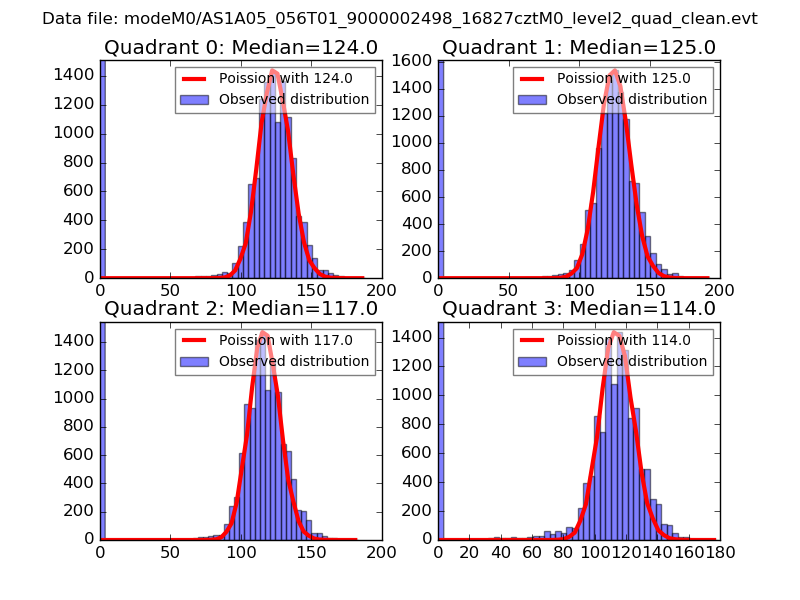 |
 |
| Quadrant-wise count rates Data is divided into 100 sec bins |
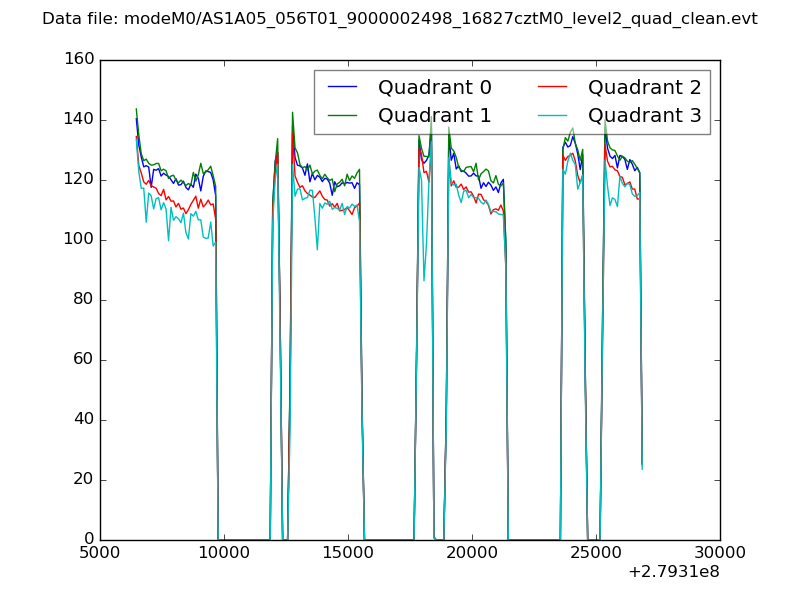 |
|
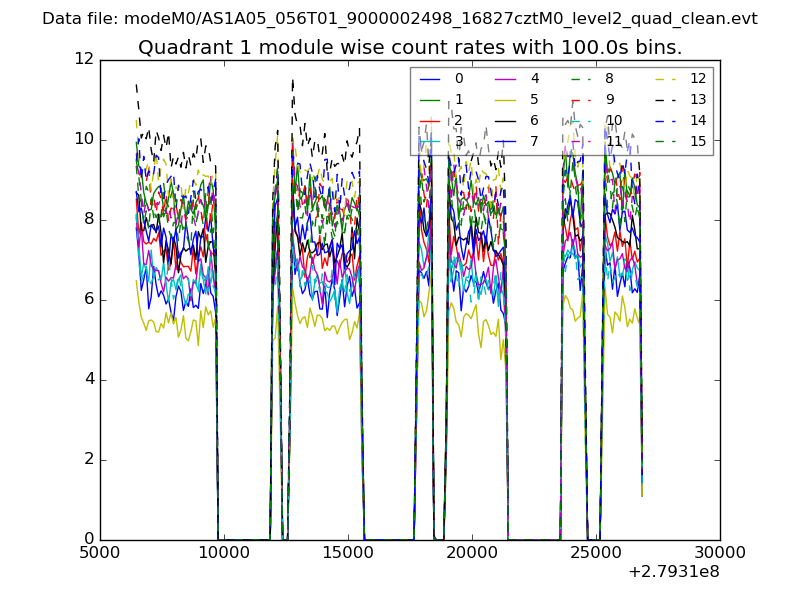
| Module-wise count rates for Quadrant A Data is divided into 100 sec bins |
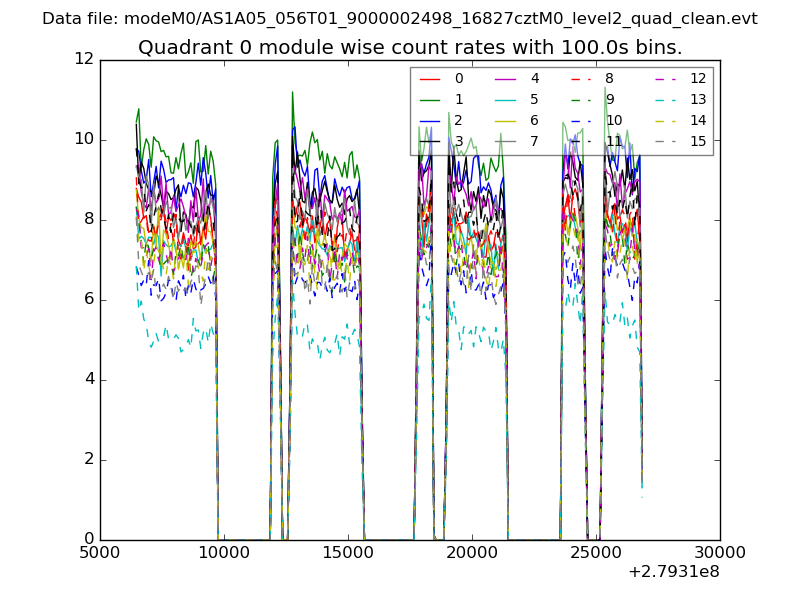 |
 |
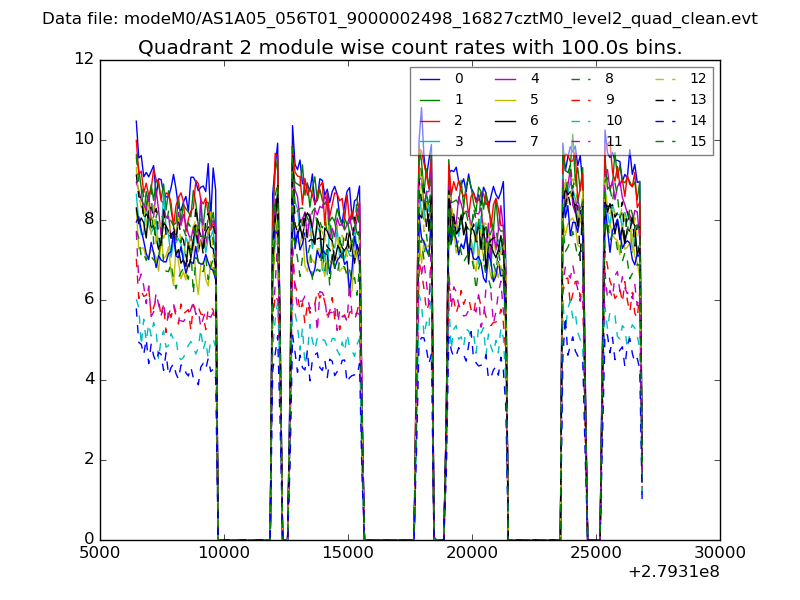
| Module-wise count rates for Quadrant B Data is divided into 100 sec bins |
 |
 |
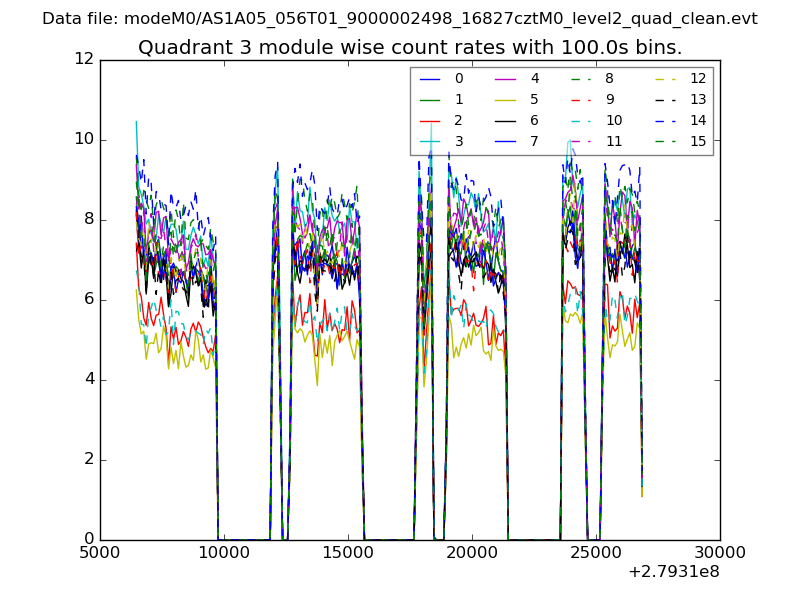
| Module-wise count rates for Quadrant C Data is divided into 100 sec bins |
 |
 |
| Module-wise count rates for Quadrant D Data is divided into 100 sec bins |
 |
 |
| Parameter | Plot |
|---|---|
| CZT HV Monitor | 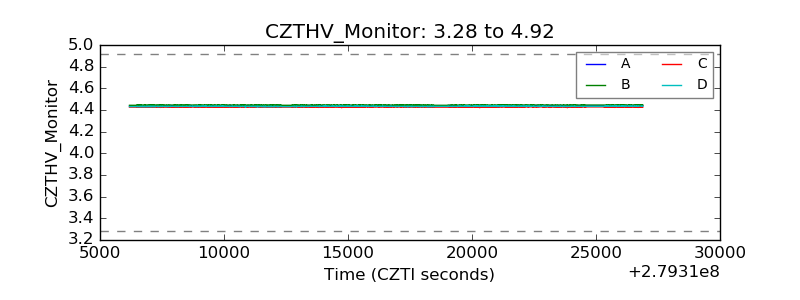 |
| D_VDD | 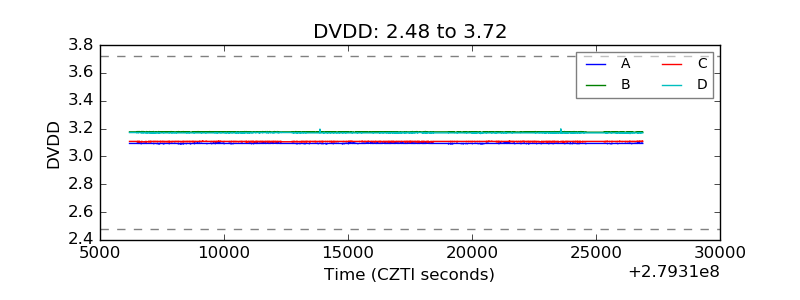 |
| Temperature 1 | 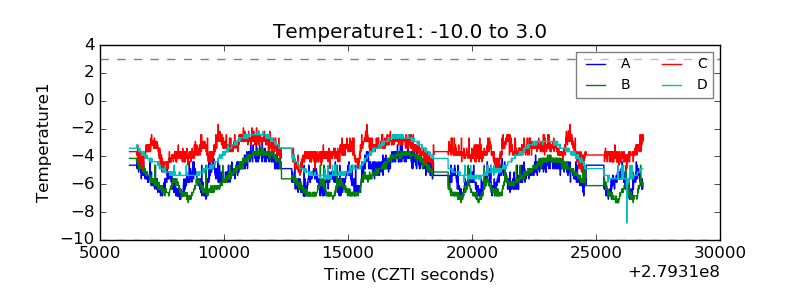 |
| Veto HV Monitor | 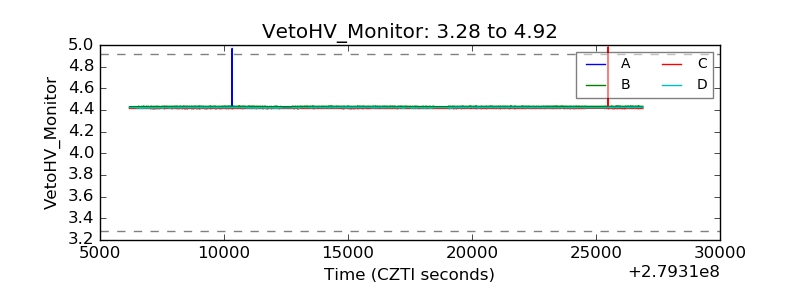 |
| Veto LLD | 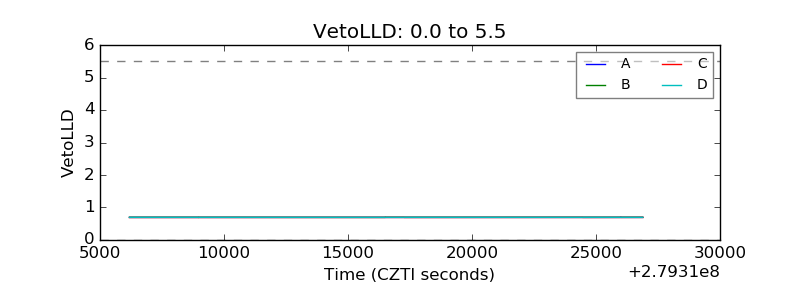 |
| Alpha Counter | 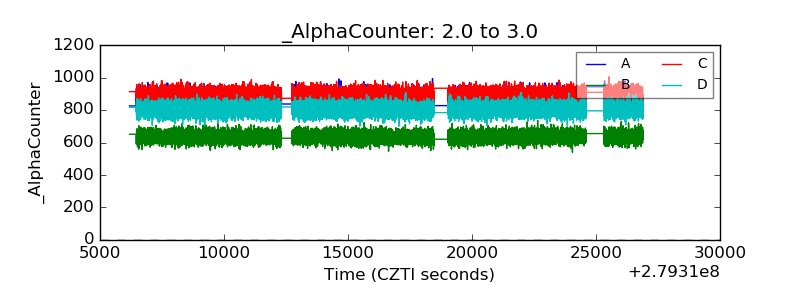 |
| _CPM_Rate | 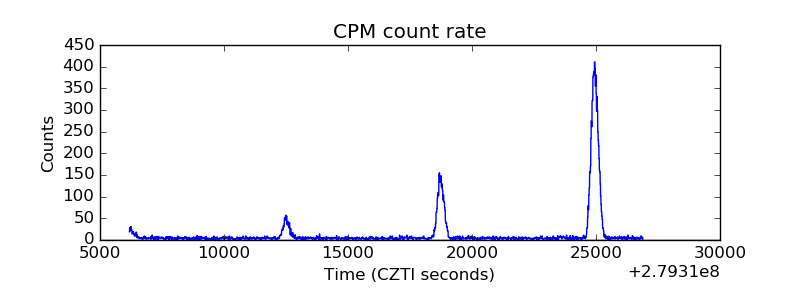 |
| CZT Counter | 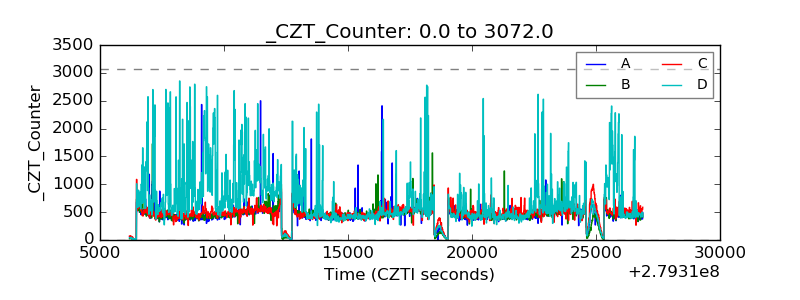 |
| +2.5 Volts monitor |  |
| +5 Volts monitor |  |
| _ROLL_ROT | 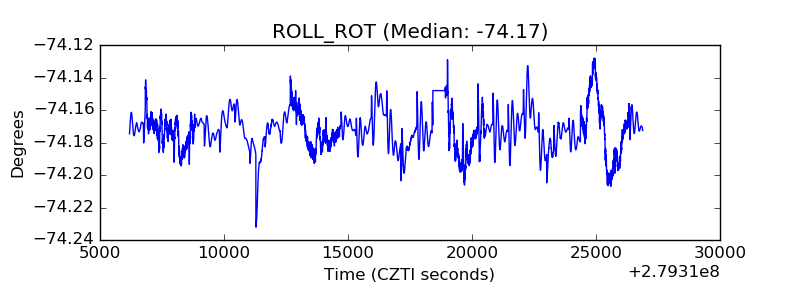 |
| _Roll_DEC | 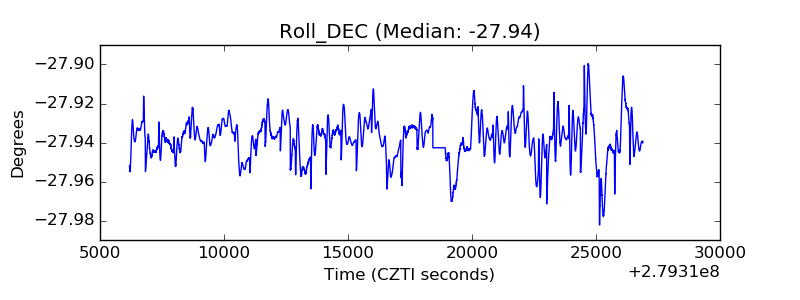 |
| _Roll_RA | 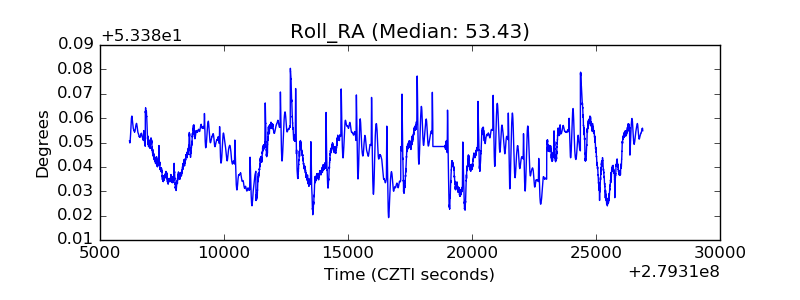 |
| Veto Counter | 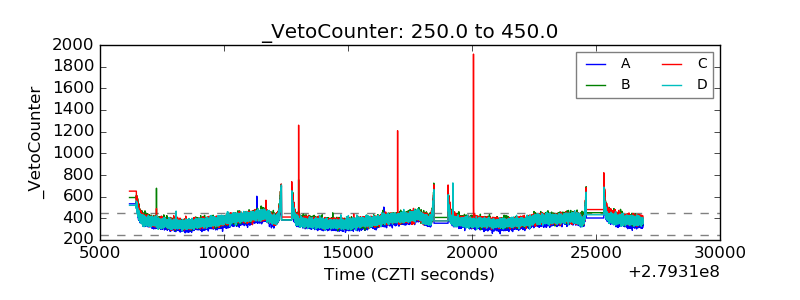 |