| Param | Original file | Final file |
|---|---|---|
| Filename | modeM0/AS1A05_056T01_9000002498_16831cztM0_level2.evt | modeM0/AS1A05_056T01_9000002498_16831cztM0_level2_quad_clean.evt |
| Size (bytes) | 559,823,040 | 82,802,880 |
| Size | 533.9 MB | 79.0 MB |
| Events in quadrant A | 3,428,861 | 524,574 |
| Events in quadrant B | 3,461,418 | 540,243 |
| Events in quadrant C | 4,361,085 | 506,501 |
| Events in quadrant D | 5,268,226 | 488,346 |
| Mode M9 | |||
|---|---|---|---|
| Quadrant | BADHDUFLAG | Total packets | Discarded packets |
| A | 0 | 16 | 0 |
| B | 0 | 16 | 0 |
| C | 0 | 16 | 0 |
| D | 0 | 17 | 0 |
| Mode SS | |||
|---|---|---|---|
| Quadrant | BADHDUFLAG | Total packets | Discarded packets |
| A | 0 | 130 | 0 |
| B | 0 | 130 | 0 |
| C | 0 | 130 | 0 |
| D | 0 | 130 | 0 |
| Mode M0 | |||
|---|---|---|---|
| Quadrant | BADHDUFLAG | Total packets | Discarded packets |
| A | 0 | 14183 | 3 |
| B | 0 | 14196 | 2 |
| C | 0 | 17417 | 2 |
| D | 0 | 19990 | 2 |
| Quadrant | Total seconds | Saturated seconds | Saturation percentage |
|---|---|---|---|
| A | 6417 | 117 | 1.823282% |
| B | 6417 | 120 | 1.870033% |
| C | 6417 | 211 | 3.288141% |
| D | 6417 | 358 | 5.578931% |
Noise dominated data is calculated using 1-second bins in cleaned event files. If a bin has >2000 counts, and if more than 50% of those come from <1% of pixels, then it is considered to be noise-dominated and hence unusable.
| Quadrant | # 1 sec bins | Bins with >0 counts | Bins with >2000 counts | High rate bins dominated by noise | Noise dominated (total time) | Noise dominated (detector-on time) | Marked lightcurve |
|---|---|---|---|---|---|---|---|
| A | 7518 | 6419 | 32 | 32 | 0.43% | 0.50% | 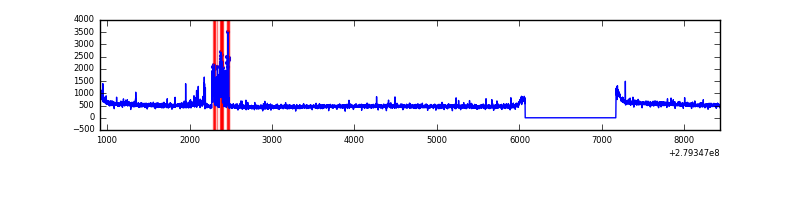 |
| B | 7518 | 6419 | 9 | 9 | 0.12% | 0.14% | 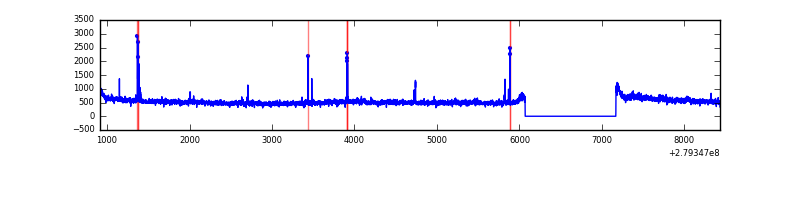 |
| C | 7518 | 6419 | 29 | 29 | 0.39% | 0.45% | 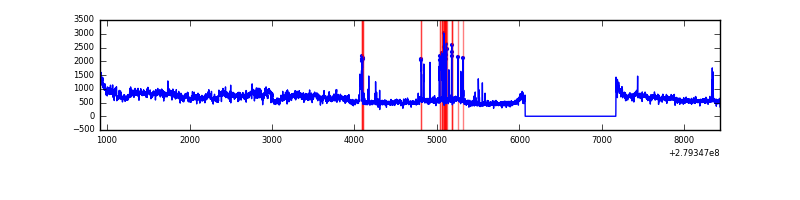 |
| D | 7518 | 6419 | 216 | 216 | 2.87% | 3.37% | 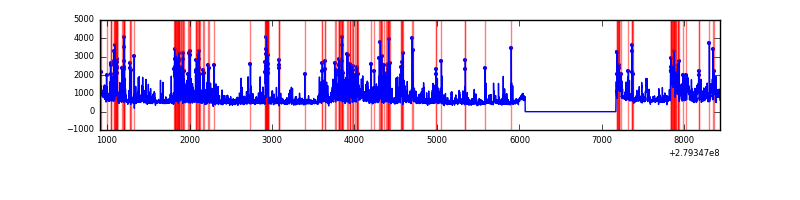 |
Top three noisy pixels from each quadrant. If the there are fewer than three noisy pixels in the level2.evt file, extra rows are filled as -1
| Pixel properties | Quadrant properties | ||||||
|---|---|---|---|---|---|---|---|
| Quadrant | DetID | PixID | Counts | Sigma | Mean | Median | Sigma |
| A | 15 | 174 | 206734 | 1231.6 | 830 | 814 | 167.2 |
| A | 9 | 143 | 27974 | 162.44 | 830 | 814 | 167.2 |
| A | 0 | 226 | 7258 | 38.54 | 830 | 814 | 167.2 |
| B | 0 | 229 | 132269 | 841.45 | 831 | 811 | 156.2 |
| B | 4 | 173 | 44361 | 278.76 | 831 | 811 | 156.2 |
| B | 12 | 111 | 18733 | 114.72 | 831 | 811 | 156.2 |
| C | 3 | 233 | 1072523 | 5734.91 | 806 | 815 | 186.9 |
| C | 14 | 238 | 123959 | 658.96 | 806 | 815 | 186.9 |
| C | 0 | 207 | 20661 | 106.2 | 806 | 815 | 186.9 |
| D | 1 | 52 | 1601494 | 8225.6 | 805 | 783 | 194.6 |
| D | 5 | 222 | 559606 | 2871.63 | 805 | 783 | 194.6 |
| D | 2 | 136 | 42570 | 214.73 | 805 | 783 | 194.6 |
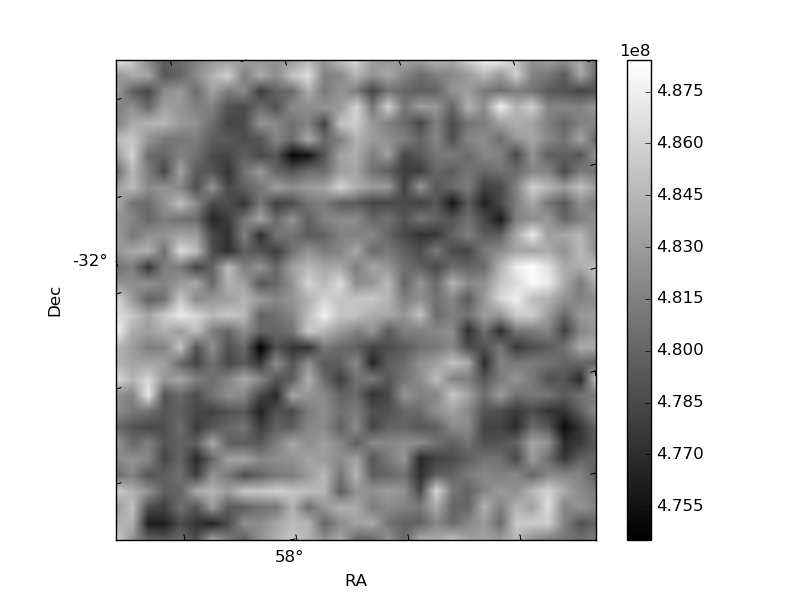
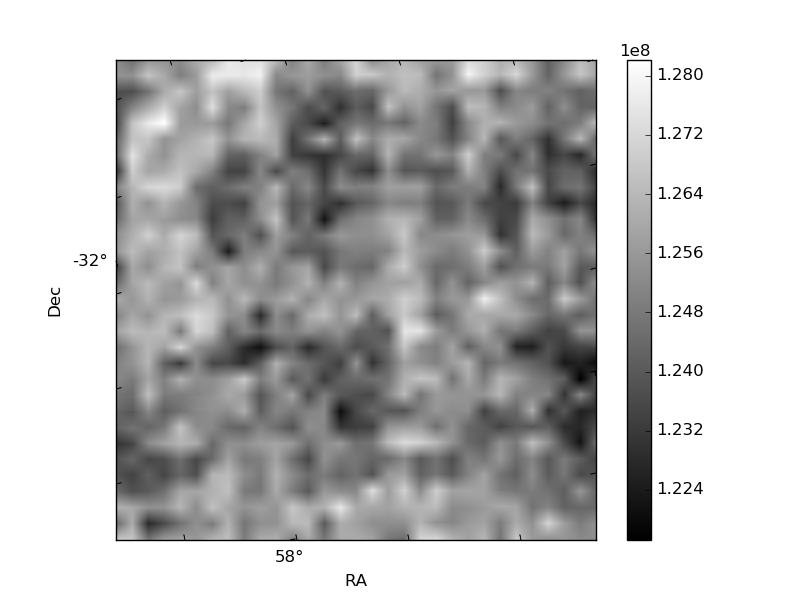
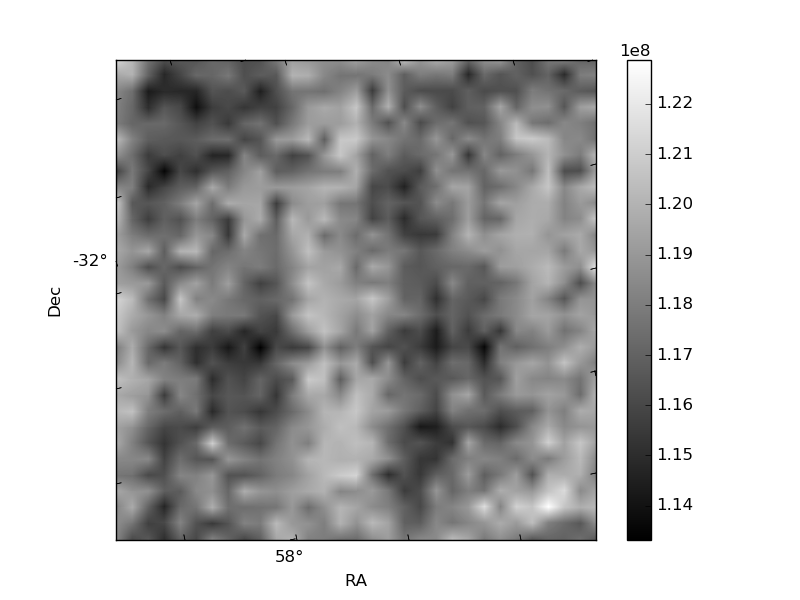
Histogram calculated using DETX and DETY for each event in the final _common_clean file
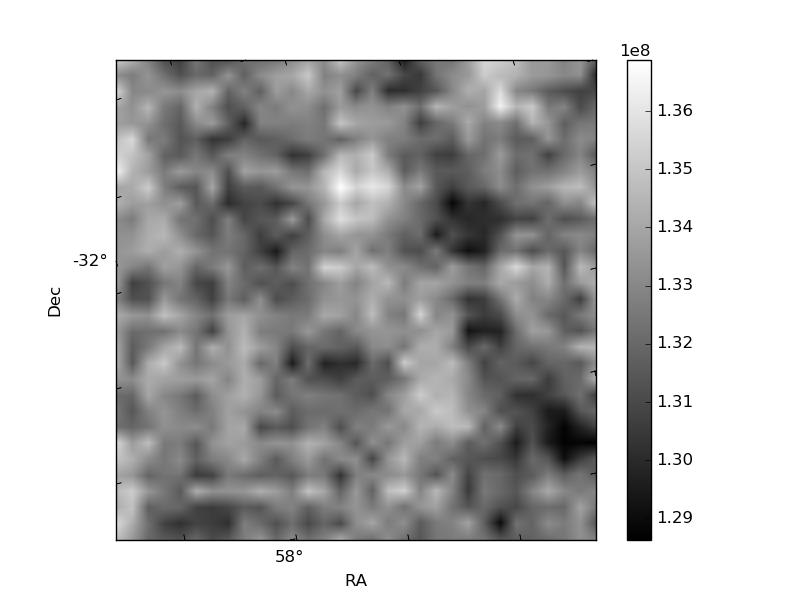
| Quadrant A | 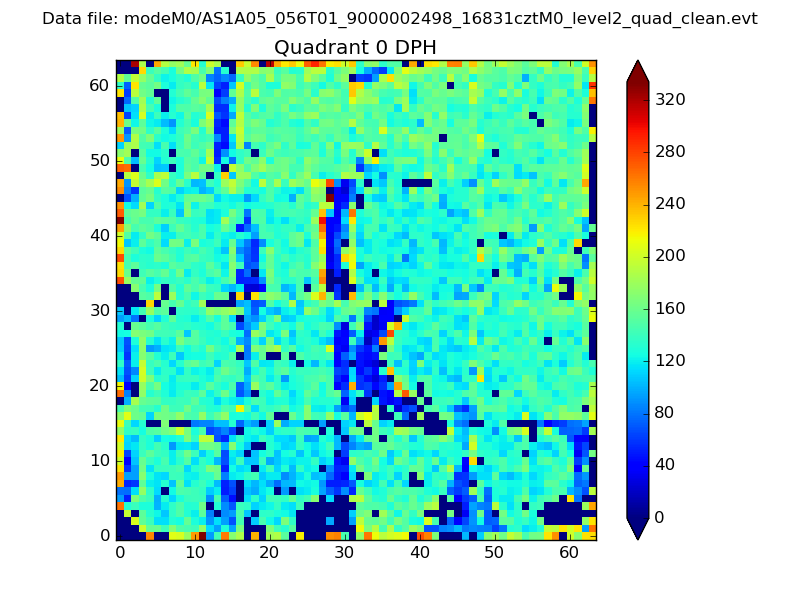 |
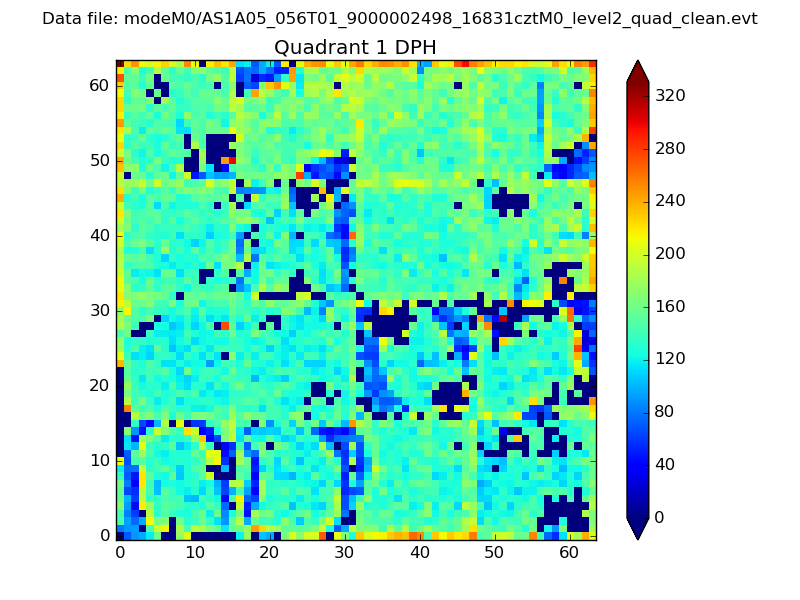 |
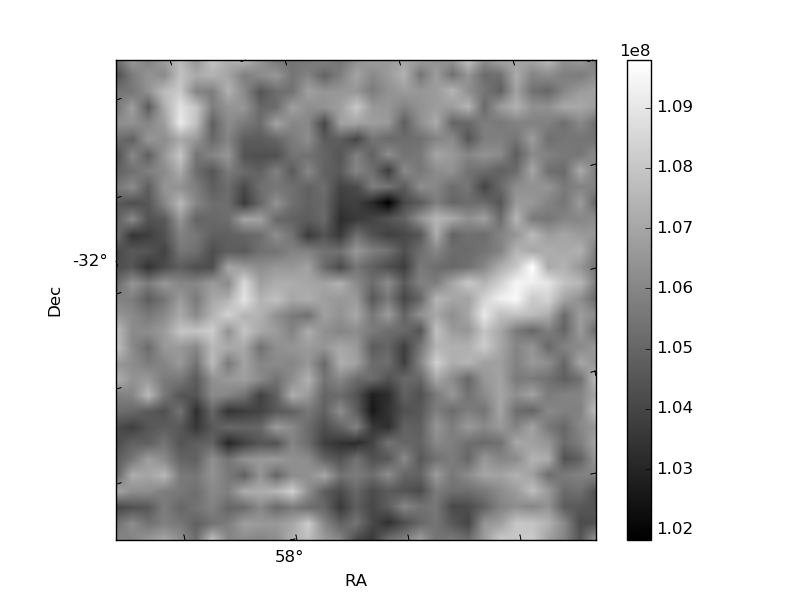
Quadrant B |
|---|---|---|---|
| Quadrant D | 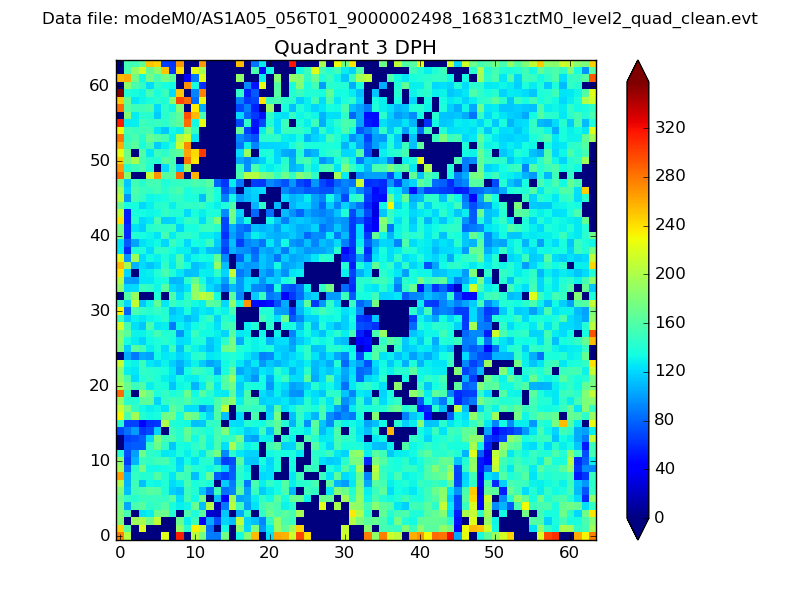 |
 |
Quadrant C |
| Plot type | Count rate plots | Images |
|---|---|---|
| Comparison with Poisson distribution Blue bars denote a histogram of data divided into 1 sec bins. Red curve is a Poisson curve with rate = median count rate of data. |
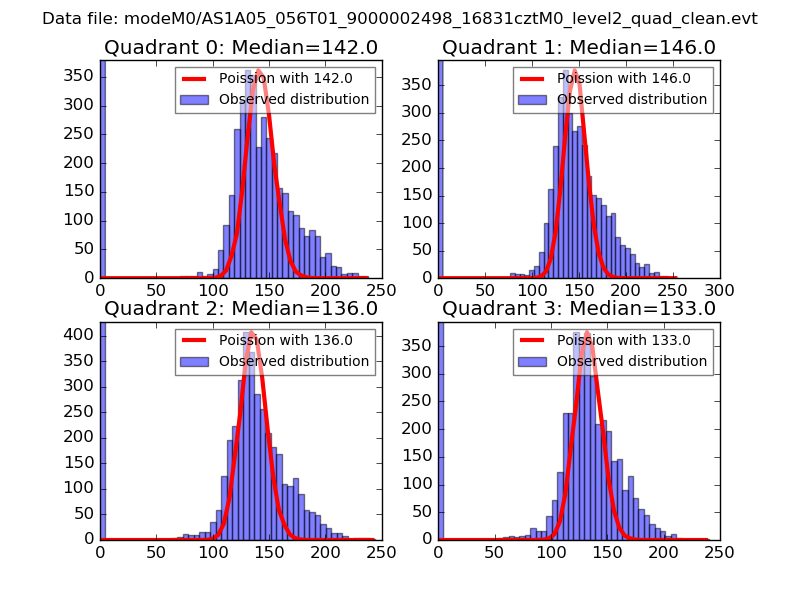 |
 |
| Quadrant-wise count rates Data is divided into 100 sec bins |
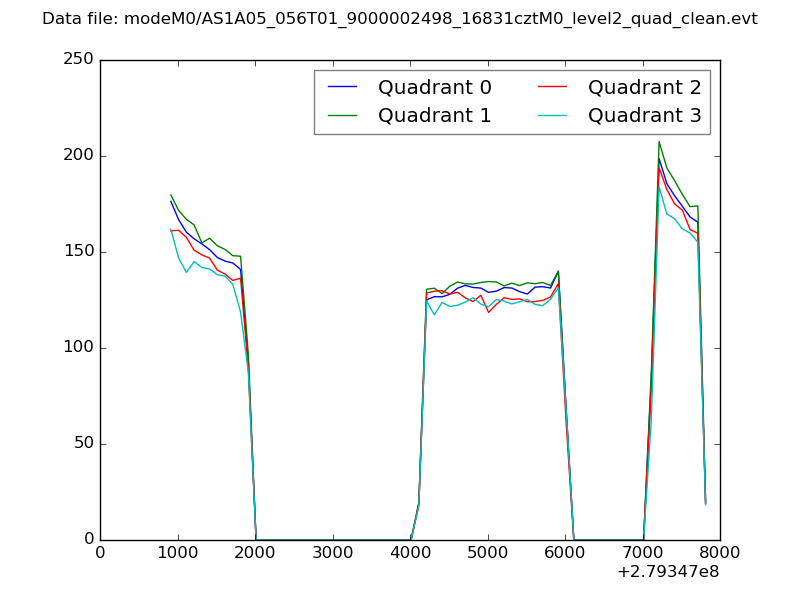 |
|
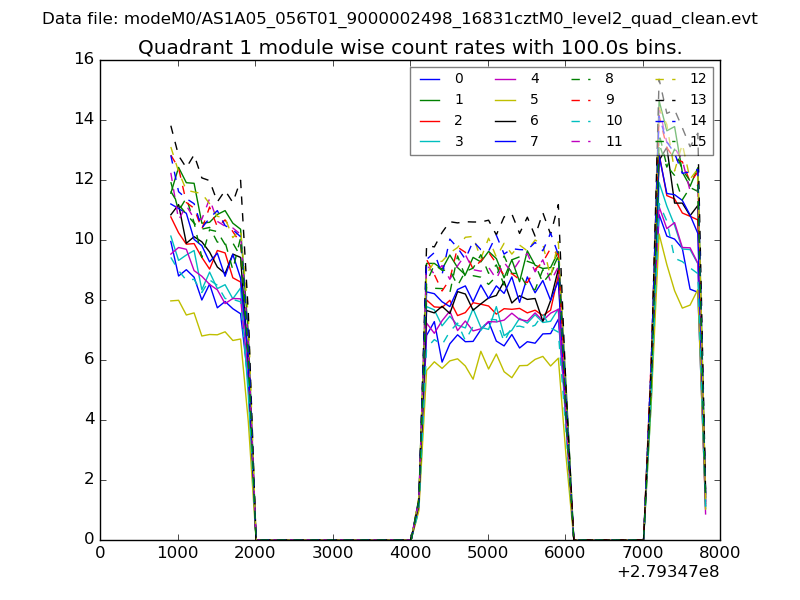
| Module-wise count rates for Quadrant A Data is divided into 100 sec bins |
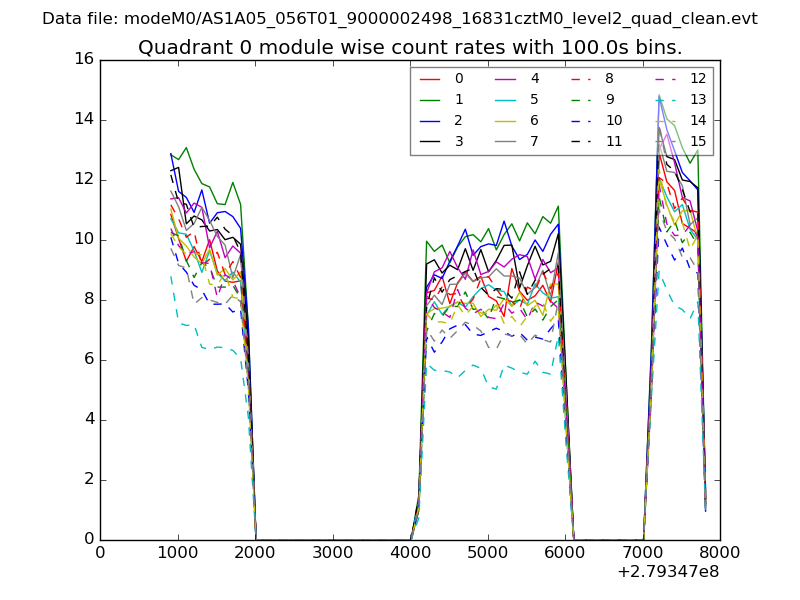 |
 |
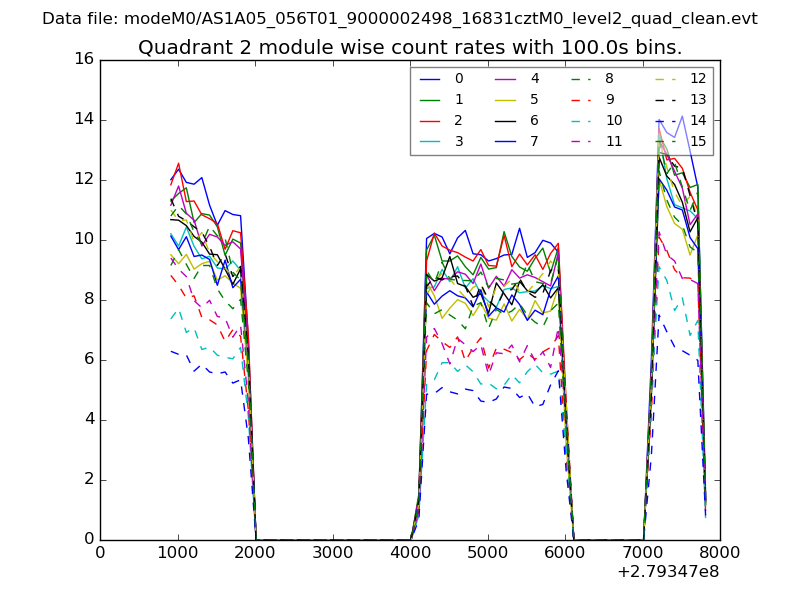
| Module-wise count rates for Quadrant B Data is divided into 100 sec bins |
 |
 |
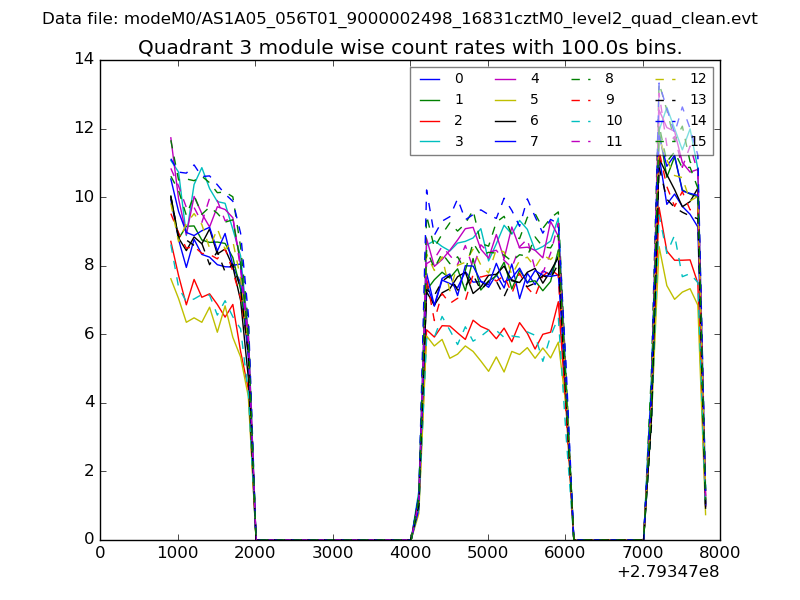
| Module-wise count rates for Quadrant C Data is divided into 100 sec bins |
 |
 |
| Module-wise count rates for Quadrant D Data is divided into 100 sec bins |
 |
 |
| Parameter | Plot |
|---|---|
| CZT HV Monitor | 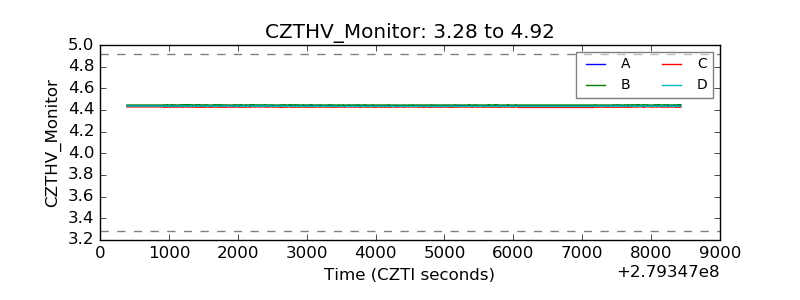 |
| D_VDD | 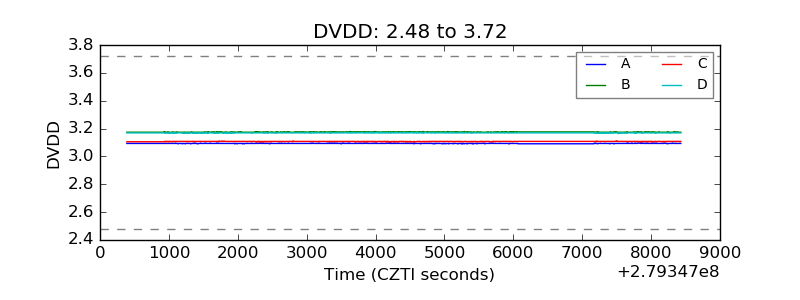 |
| Temperature 1 | 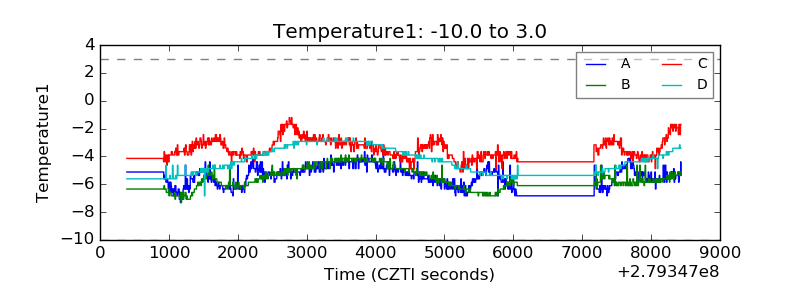 |
| Veto HV Monitor | 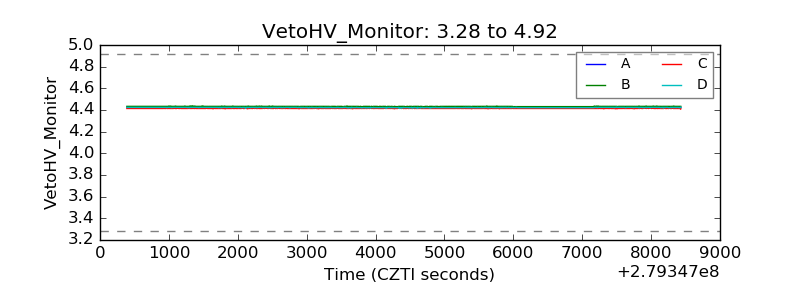 |
| Veto LLD | 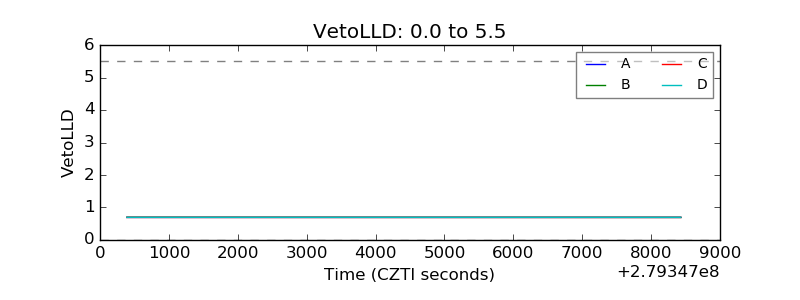 |
| Alpha Counter | 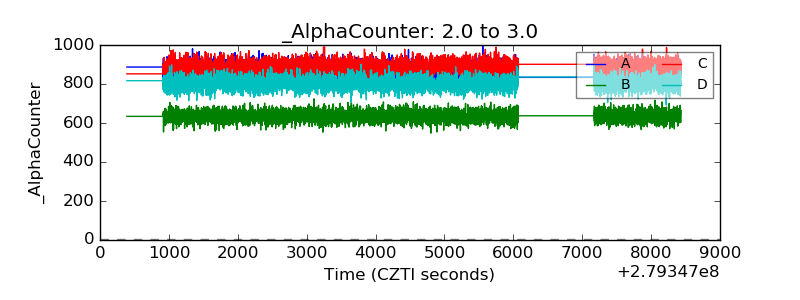 |
| _CPM_Rate | 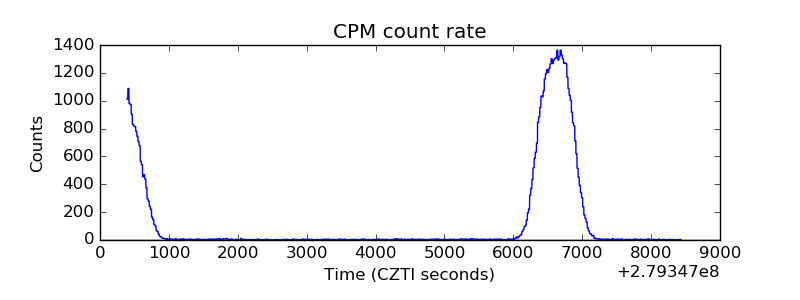 |
| CZT Counter | 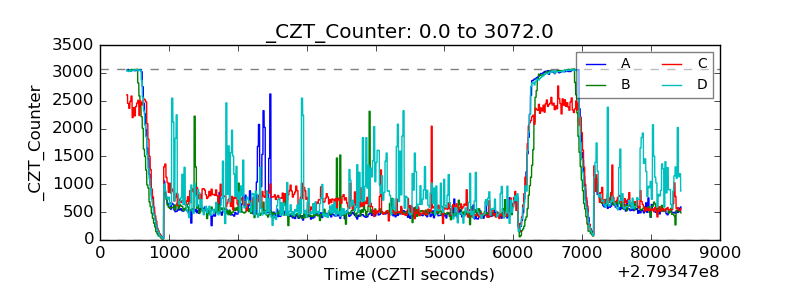 |
| +2.5 Volts monitor |  |
| +5 Volts monitor | 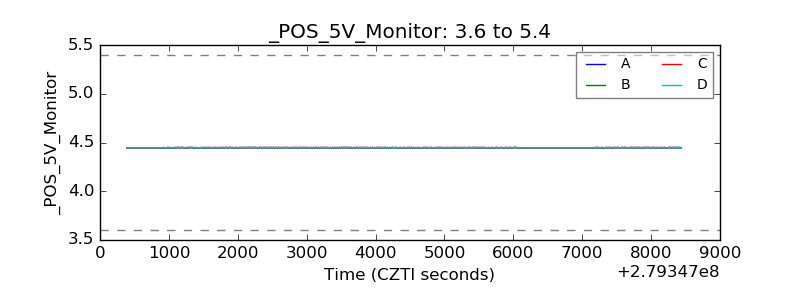 |
| _ROLL_ROT | 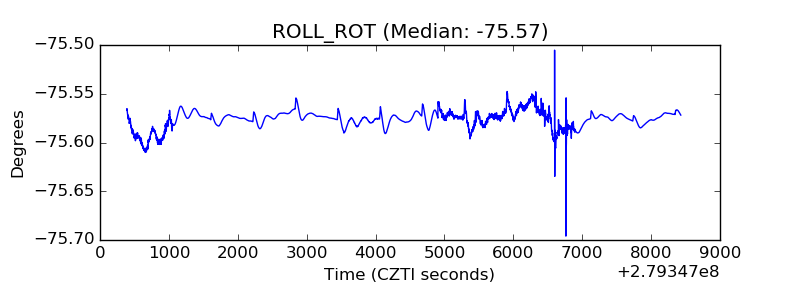 |
| _Roll_DEC | 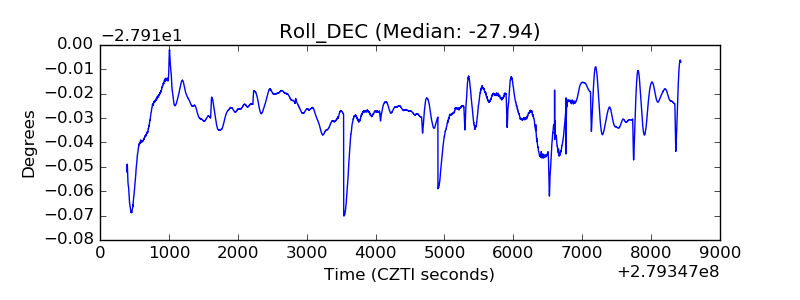 |
| _Roll_RA | 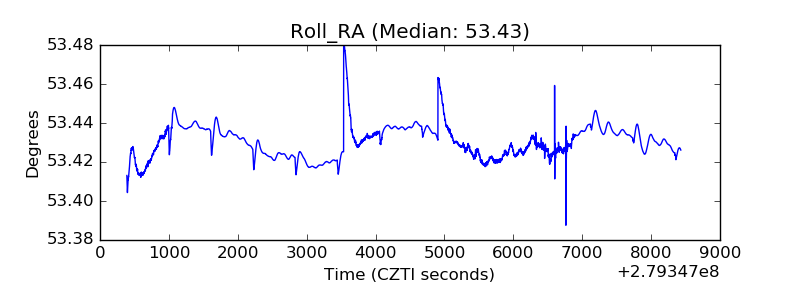 |
| Veto Counter | 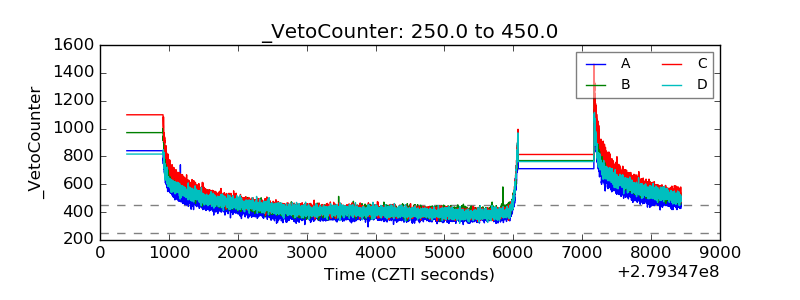 |