| Param | Original file | Final file |
|---|---|---|
| Filename | modeM0/AS1A05_056T01_9000002498_16832cztM0_level2.evt | modeM0/AS1A05_056T01_9000002498_16832cztM0_level2_quad_clean.evt |
| Size (bytes) | 562,334,400 | 73,143,360 |
| Size | 536.3 MB | 69.8 MB |
| Events in quadrant A | 3,278,870 | 456,263 |
| Events in quadrant B | 3,543,672 | 467,098 |
| Events in quadrant C | 4,291,592 | 439,178 |
| Events in quadrant D | 5,495,078 | 417,672 |
| Mode M9 | |||
|---|---|---|---|
| Quadrant | BADHDUFLAG | Total packets | Discarded packets |
| A | 0 | 14 | 0 |
| B | 0 | 14 | 0 |
| C | 0 | 14 | 0 |
| D | 0 | 15 | 0 |
| Mode SS | |||
|---|---|---|---|
| Quadrant | BADHDUFLAG | Total packets | Discarded packets |
| A | 0 | 128 | 0 |
| B | 0 | 128 | 0 |
| C | 0 | 128 | 0 |
| D | 0 | 128 | 0 |
| Mode M0 | |||
|---|---|---|---|
| Quadrant | BADHDUFLAG | Total packets | Discarded packets |
| A | 0 | 13566 | 3 |
| B | 0 | 14438 | 2 |
| C | 0 | 17023 | 2 |
| D | 0 | 20619 | 2 |
| Quadrant | Total seconds | Saturated seconds | Saturation percentage |
|---|---|---|---|
| A | 6217 | 81 | 1.302879% |
| B | 6217 | 100 | 1.608493% |
| C | 6217 | 233 | 3.747788% |
| D | 6217 | 445 | 7.157793% |
Noise dominated data is calculated using 1-second bins in cleaned event files. If a bin has >2000 counts, and if more than 50% of those come from <1% of pixels, then it is considered to be noise-dominated and hence unusable.
| Quadrant | # 1 sec bins | Bins with >0 counts | Bins with >2000 counts | High rate bins dominated by noise | Noise dominated (total time) | Noise dominated (detector-on time) | Marked lightcurve |
|---|---|---|---|---|---|---|---|
| A | 7458 | 6219 | 3 | 3 | 0.04% | 0.05% | 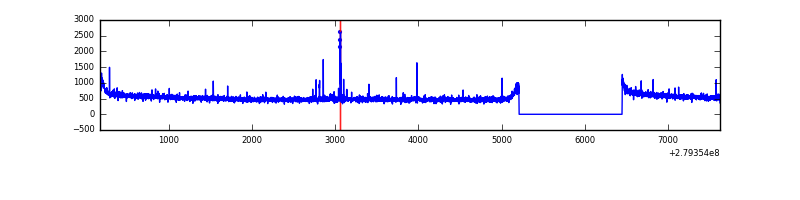 |
| B | 7458 | 6219 | 4 | 4 | 0.05% | 0.06% | 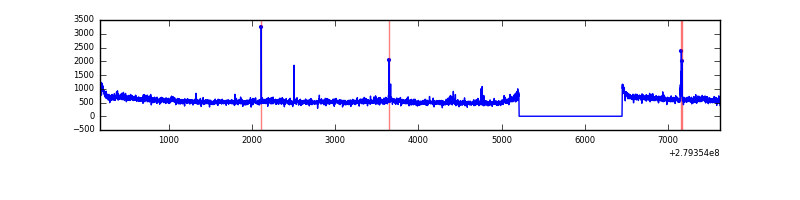 |
| C | 7458 | 6219 | 45 | 45 | 0.60% | 0.72% | 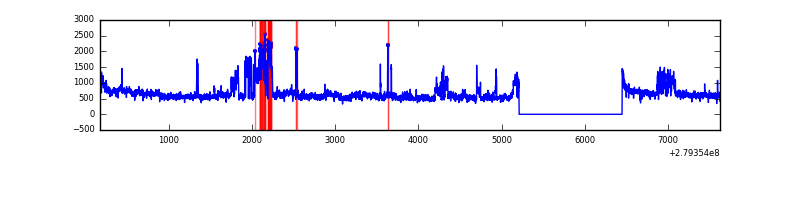 |
| D | 7458 | 6219 | 314 | 314 | 4.21% | 5.05% | 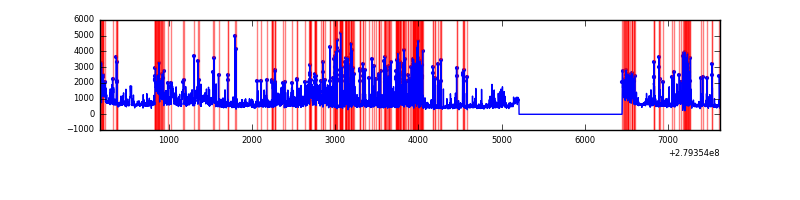 |
Top three noisy pixels from each quadrant. If the there are fewer than three noisy pixels in the level2.evt file, extra rows are filled as -1
| Pixel properties | Quadrant properties | ||||||
|---|---|---|---|---|---|---|---|
| Quadrant | DetID | PixID | Counts | Sigma | Mean | Median | Sigma |
| A | 9 | 143 | 48921 | 288.27 | 839 | 823 | 166.9 |
| A | 13 | 228 | 8007 | 43.06 | 839 | 823 | 166.9 |
| A | 0 | 226 | 7384 | 39.32 | 839 | 823 | 166.9 |
| B | 0 | 229 | 210562 | 1343.42 | 838 | 819 | 156.1 |
| B | 4 | 173 | 26059 | 161.66 | 838 | 819 | 156.1 |
| B | 15 | 35 | 22408 | 138.28 | 838 | 819 | 156.1 |
| C | 3 | 233 | 964982 | 5141.74 | 814 | 823 | 187.5 |
| C | 14 | 238 | 125944 | 667.25 | 814 | 823 | 187.5 |
| C | 0 | 207 | 28678 | 148.55 | 814 | 823 | 187.5 |
| D | 1 | 52 | 1700750 | 8692.83 | 806 | 786 | 195.6 |
| D | 5 | 222 | 707812 | 3615.41 | 806 | 786 | 195.6 |
| D | 2 | 136 | 33396 | 166.75 | 806 | 786 | 195.6 |
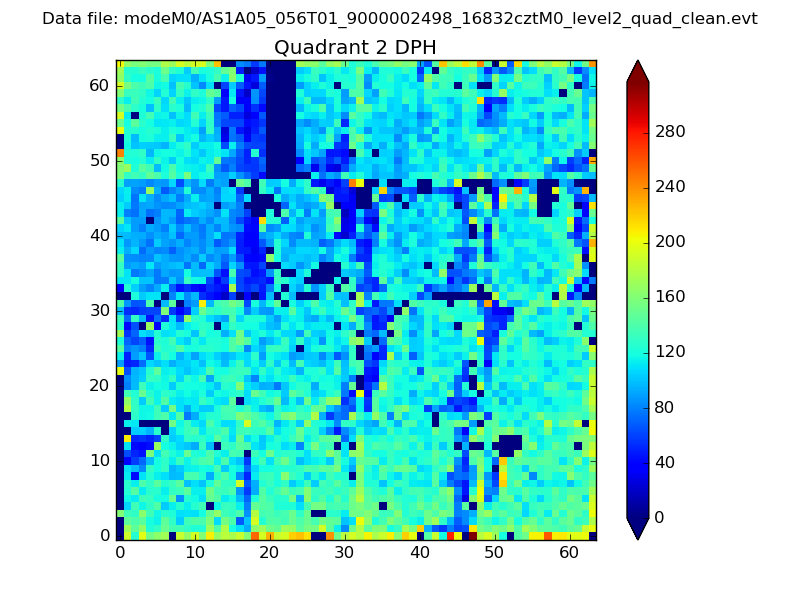
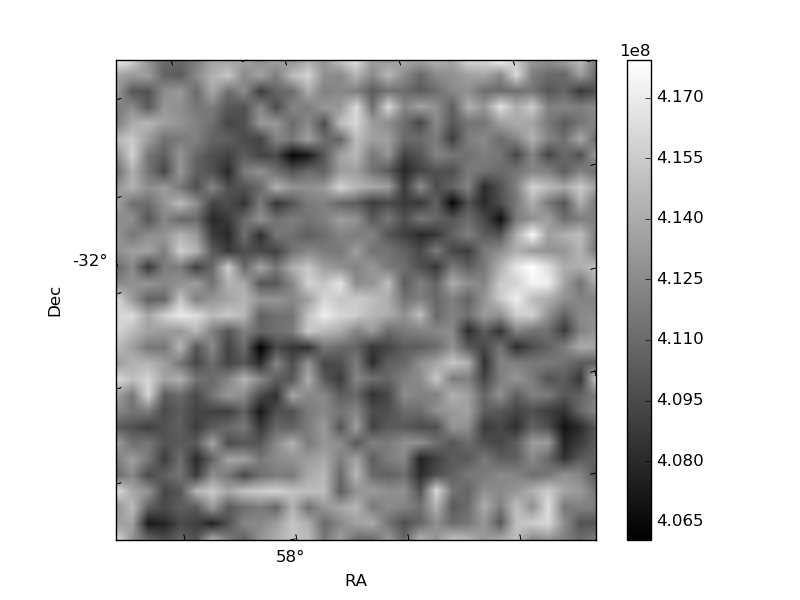
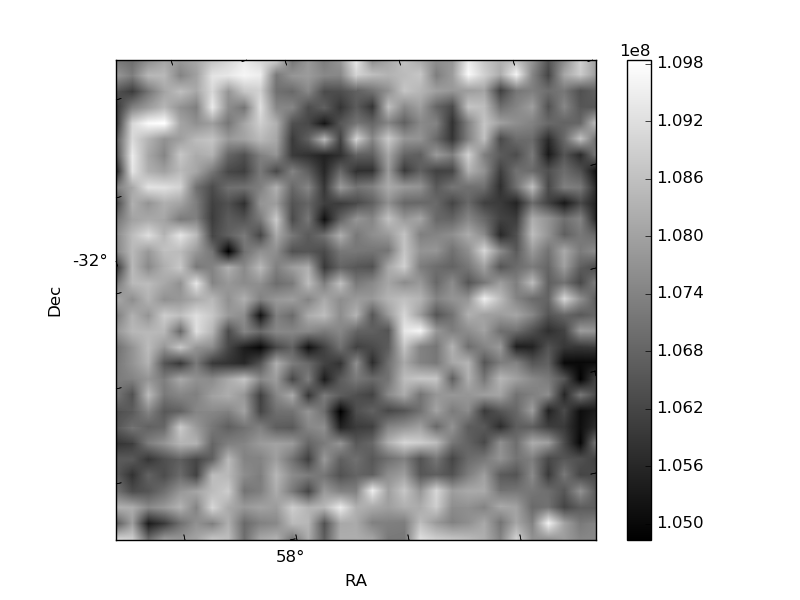
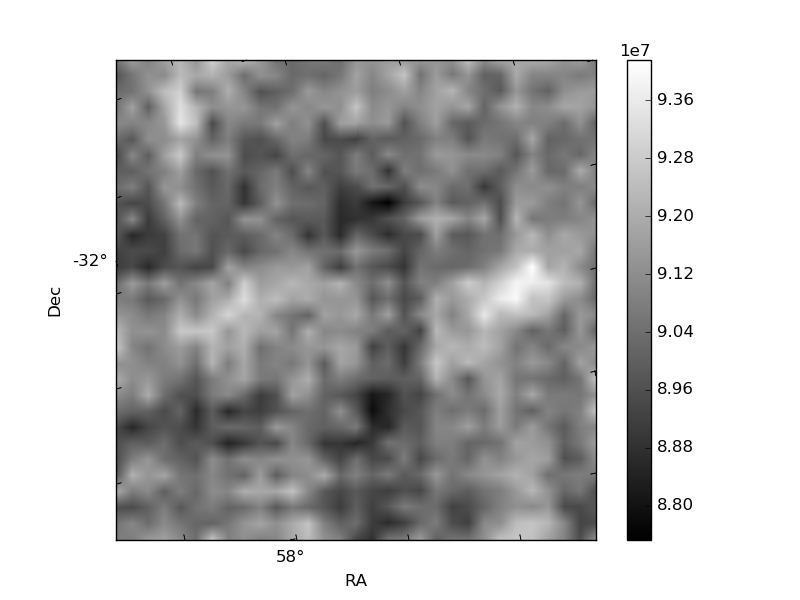
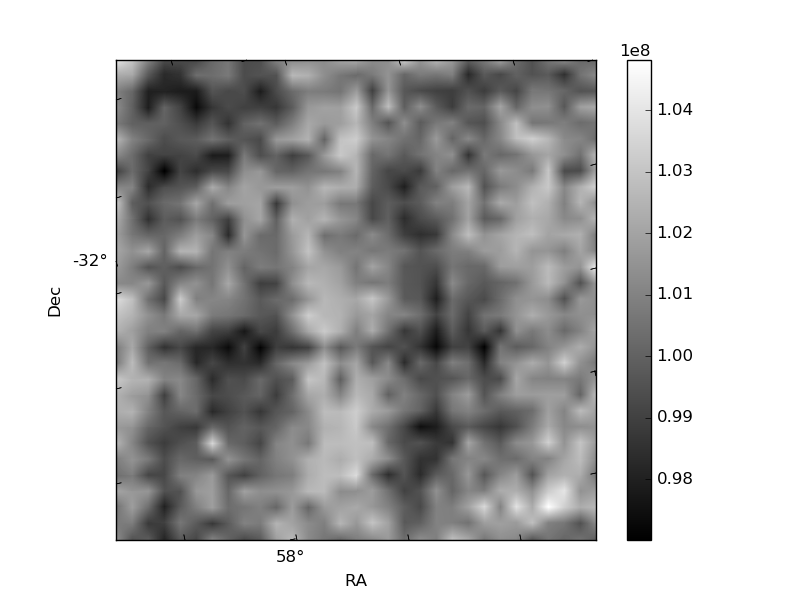
Histogram calculated using DETX and DETY for each event in the final _common_clean file
| Quadrant A | 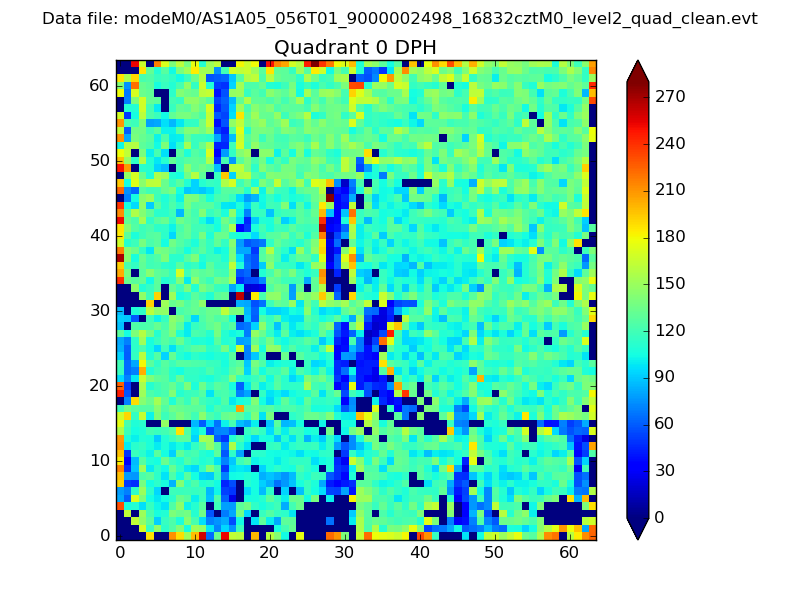 |
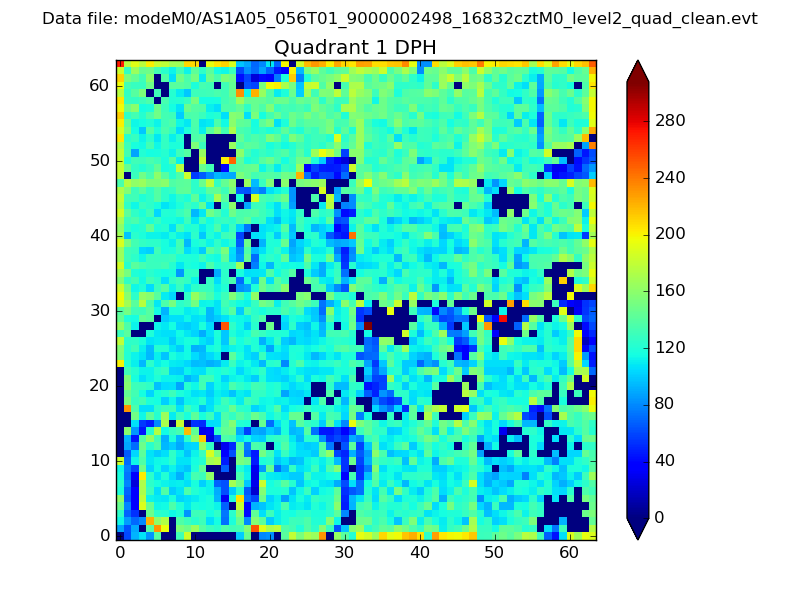 |
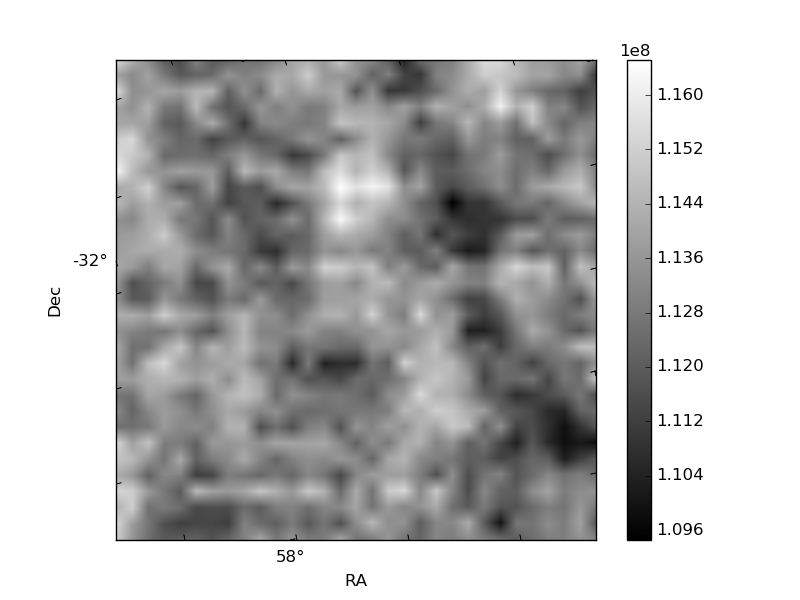
Quadrant B |
|---|---|---|---|
| Quadrant D | 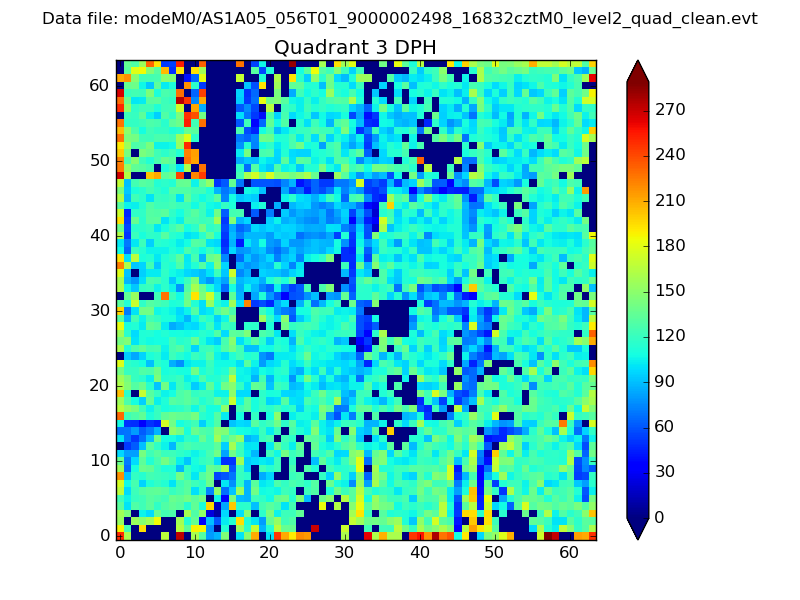 |
 |
Quadrant C |
| Plot type | Count rate plots | Images |
|---|---|---|
| Comparison with Poisson distribution Blue bars denote a histogram of data divided into 1 sec bins. Red curve is a Poisson curve with rate = median count rate of data. |
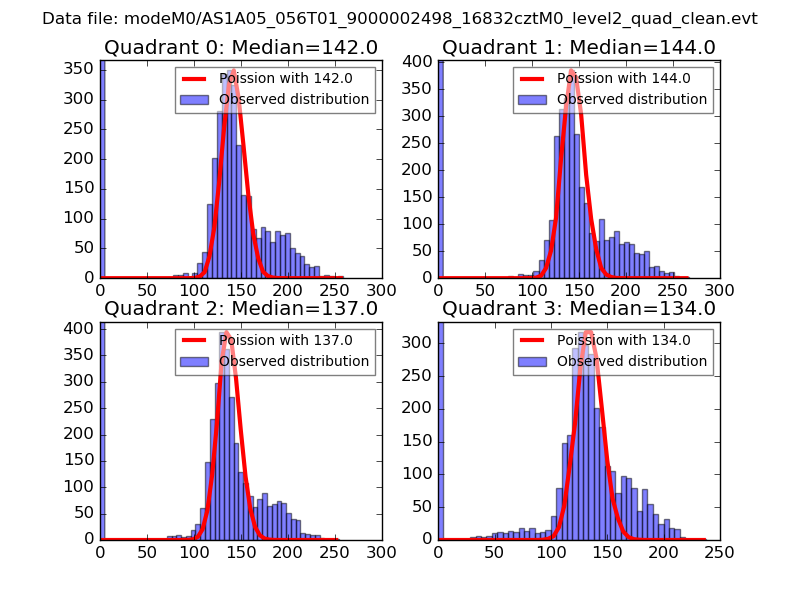 |
 |
| Quadrant-wise count rates Data is divided into 100 sec bins |
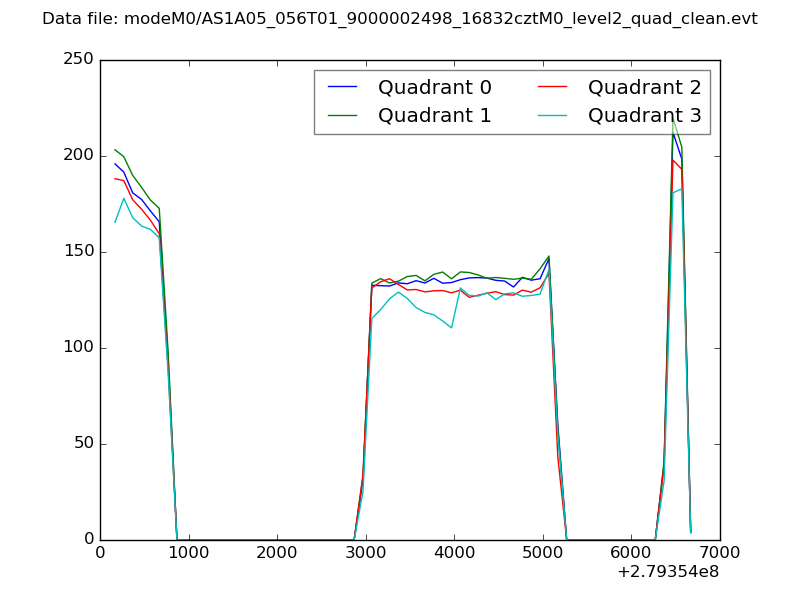 |
|
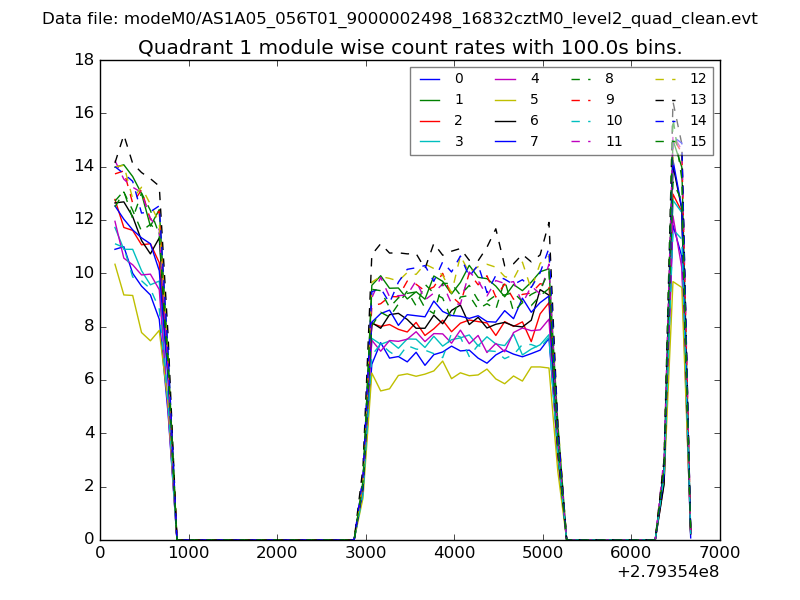
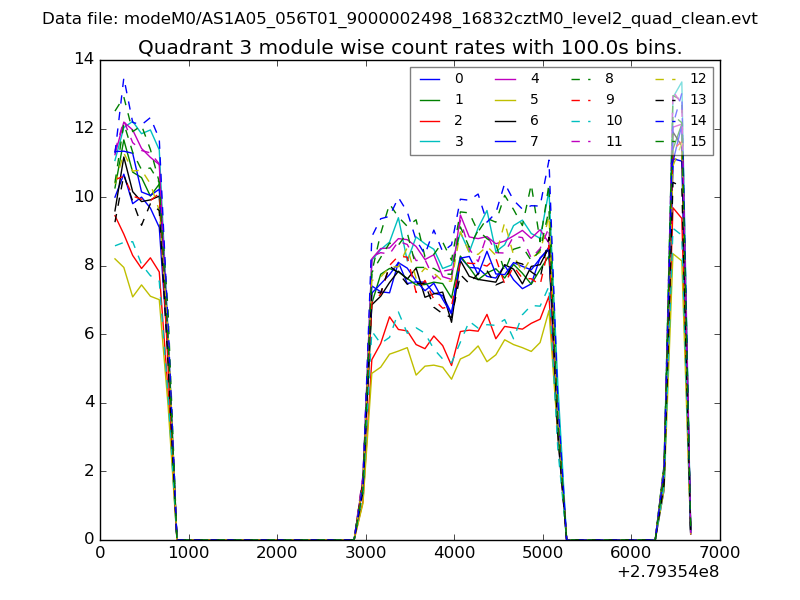
| Module-wise count rates for Quadrant A Data is divided into 100 sec bins |
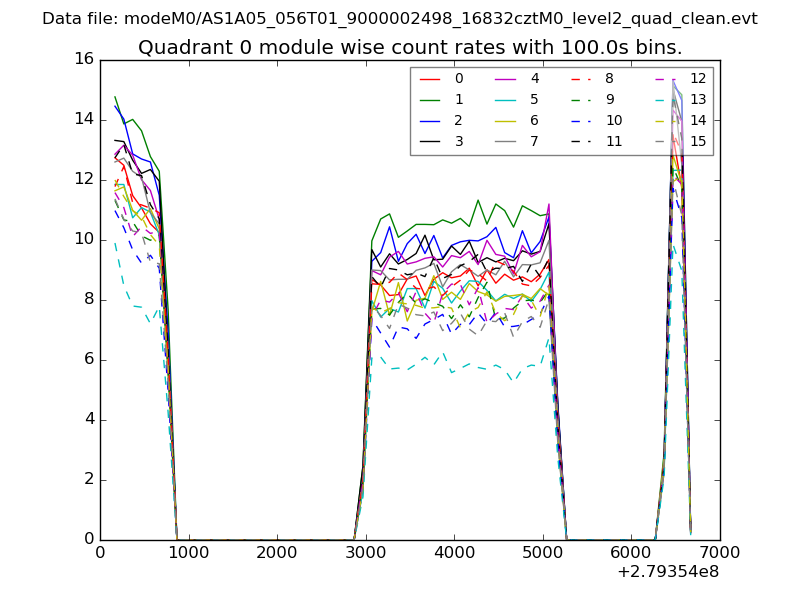 |
 |
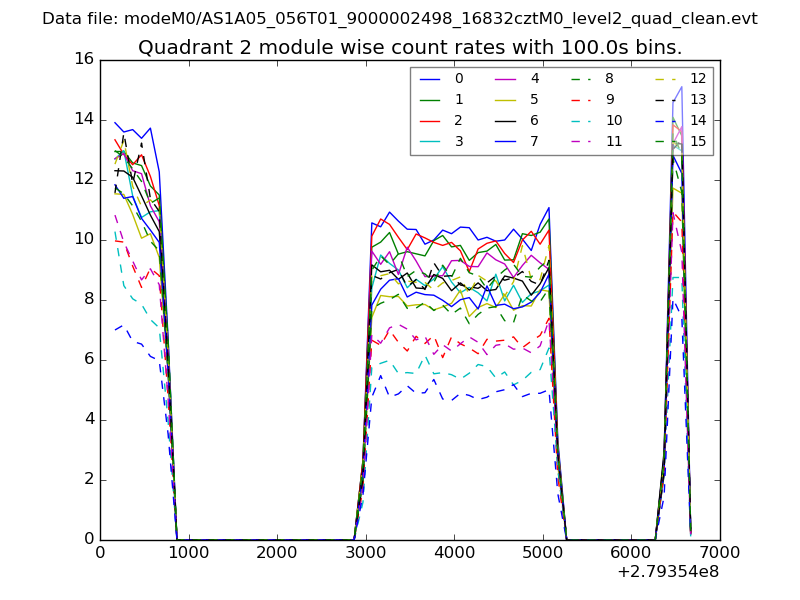
| Module-wise count rates for Quadrant B Data is divided into 100 sec bins |
 |
 |
| Module-wise count rates for Quadrant C Data is divided into 100 sec bins |
 |
 |
| Module-wise count rates for Quadrant D Data is divided into 100 sec bins |
 |
 |
| Parameter | Plot |
|---|---|
| CZT HV Monitor | 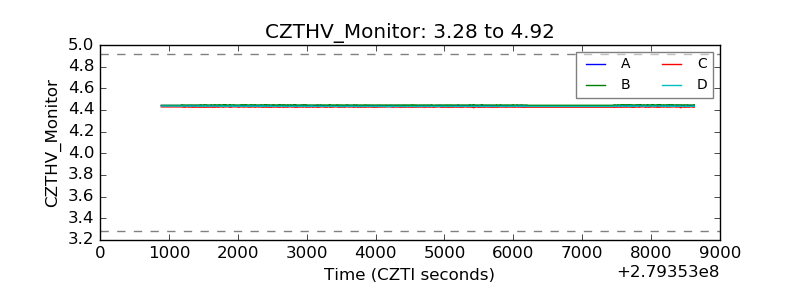 |
| D_VDD | 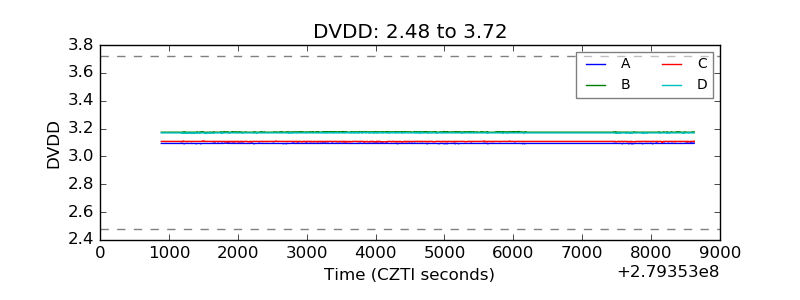 |
| Temperature 1 | 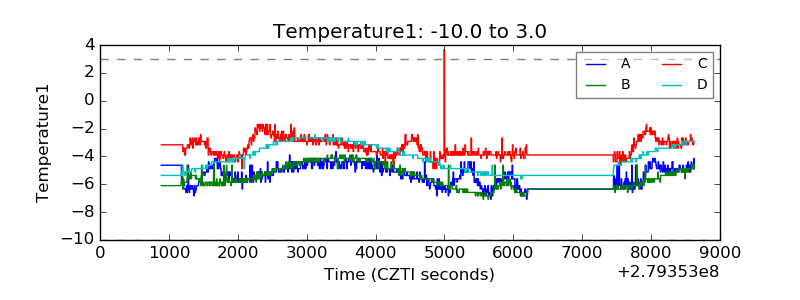 |
| Veto HV Monitor | 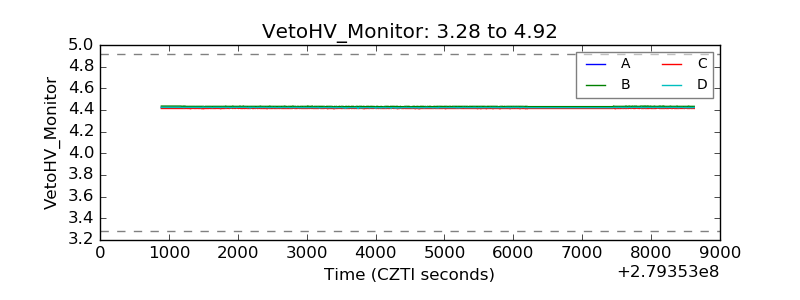 |
| Veto LLD | 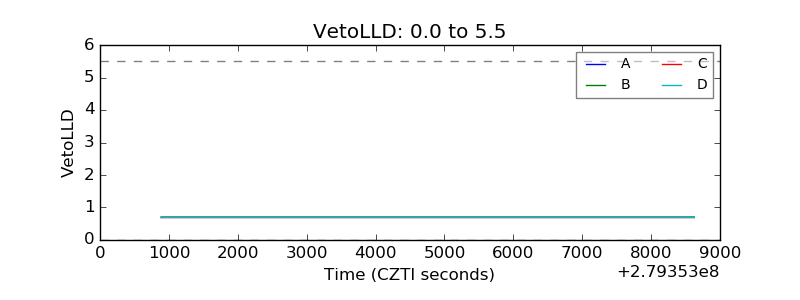 |
| Alpha Counter | 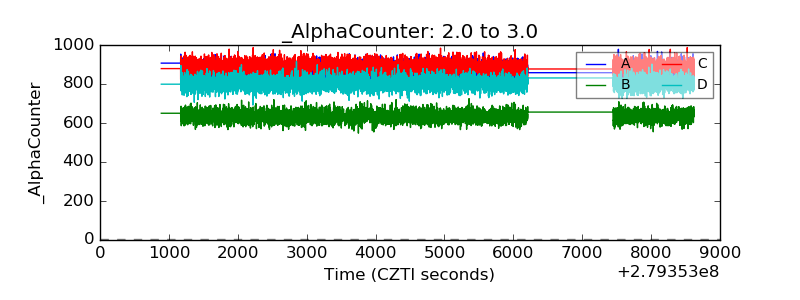 |
| _CPM_Rate | 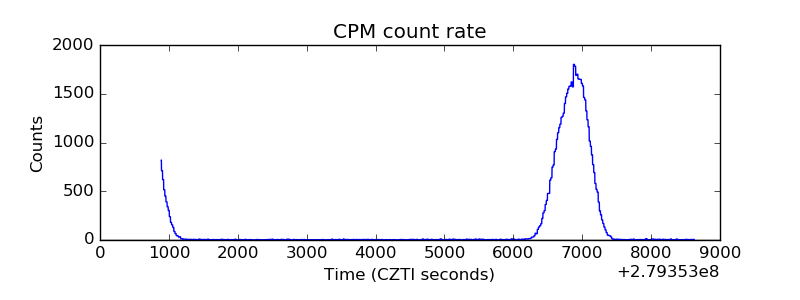 |
| CZT Counter | 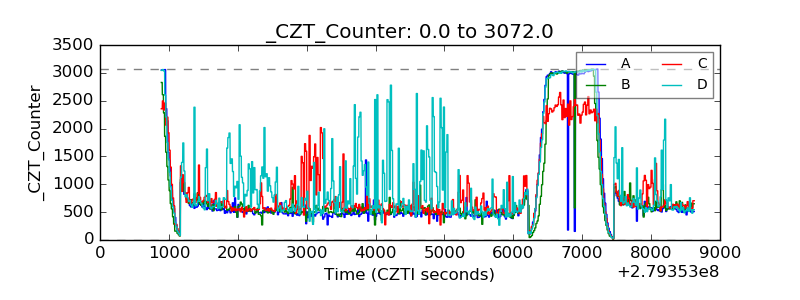 |
| +2.5 Volts monitor |  |
| +5 Volts monitor | 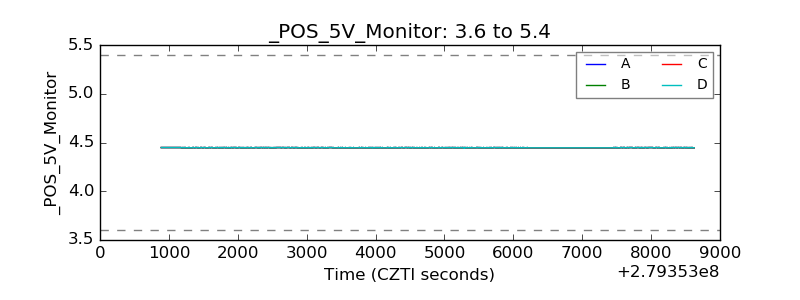 |
| _ROLL_ROT | 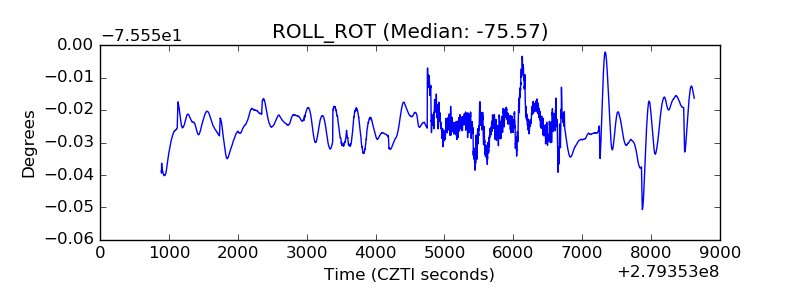 |
| _Roll_DEC | 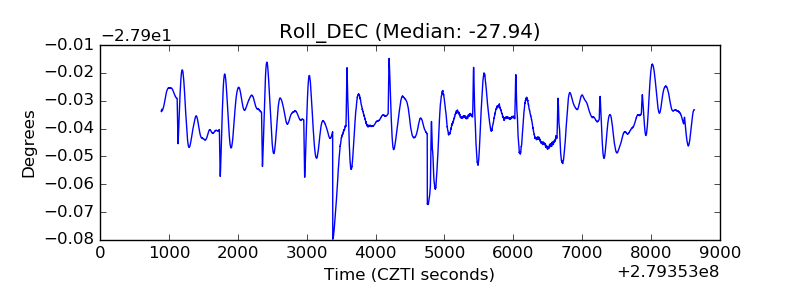 |
| _Roll_RA | 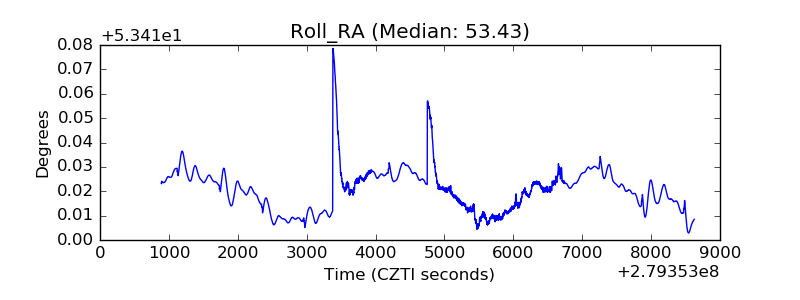 |
| Veto Counter | 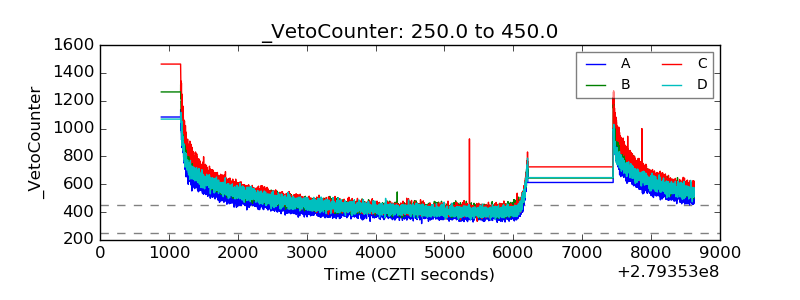 |