| Param | Original file | Final file |
|---|---|---|
| Filename | modeM0/AS1A05_056T01_9000002498_16833cztM0_level2.evt | modeM0/AS1A05_056T01_9000002498_16833cztM0_level2_quad_clean.evt |
| Size (bytes) | 504,956,160 | 66,257,280 |
| Size | 481.6 MB | 63.2 MB |
| Events in quadrant A | 3,347,141 | 400,754 |
| Events in quadrant B | 3,690,882 | 407,936 |
| Events in quadrant C | 3,860,037 | 385,488 |
| Events in quadrant D | 3,974,789 | 379,800 |
| Mode M9 | |||
|---|---|---|---|
| Quadrant | BADHDUFLAG | Total packets | Discarded packets |
| A | 0 | 14 | 0 |
| B | 0 | 14 | 0 |
| C | 0 | 14 | 0 |
| D | 0 | 15 | 0 |
| Mode SS | |||
|---|---|---|---|
| Quadrant | BADHDUFLAG | Total packets | Discarded packets |
| A | 0 | 126 | 0 |
| B | 0 | 126 | 0 |
| C | 0 | 126 | 0 |
| D | 0 | 126 | 0 |
| Mode M0 | |||
|---|---|---|---|
| Quadrant | BADHDUFLAG | Total packets | Discarded packets |
| A | 0 | 13784 | 3 |
| B | 0 | 14899 | 2 |
| C | 0 | 15626 | 2 |
| D | 0 | 15873 | 2 |
| Quadrant | Total seconds | Saturated seconds | Saturation percentage |
|---|---|---|---|
| A | 6189 | 96 | 1.551139% |
| B | 6189 | 134 | 2.165132% |
| C | 6189 | 167 | 2.698336% |
| D | 6189 | 228 | 3.683955% |
Noise dominated data is calculated using 1-second bins in cleaned event files. If a bin has >2000 counts, and if more than 50% of those come from <1% of pixels, then it is considered to be noise-dominated and hence unusable.
| Quadrant | # 1 sec bins | Bins with >0 counts | Bins with >2000 counts | High rate bins dominated by noise | Noise dominated (total time) | Noise dominated (detector-on time) | Marked lightcurve |
|---|---|---|---|---|---|---|---|
| A | 7470 | 6191 | 2 | 2 | 0.03% | 0.03% | 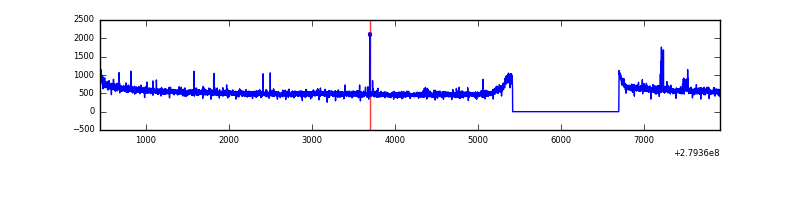 |
| B | 7470 | 6191 | 12 | 12 | 0.16% | 0.19% | 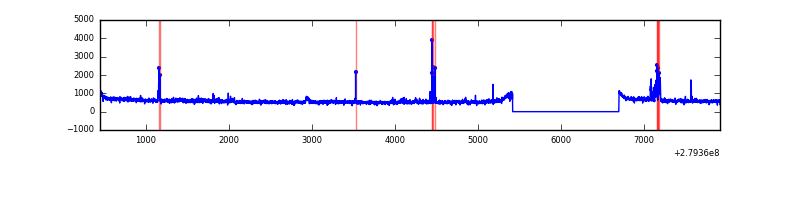 |
| C | 7470 | 6190 | 1 | 1 | 0.01% | 0.02% | 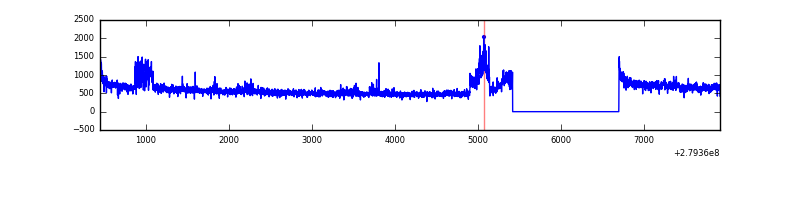 |
| D | 7470 | 6191 | 107 | 107 | 1.43% | 1.73% | 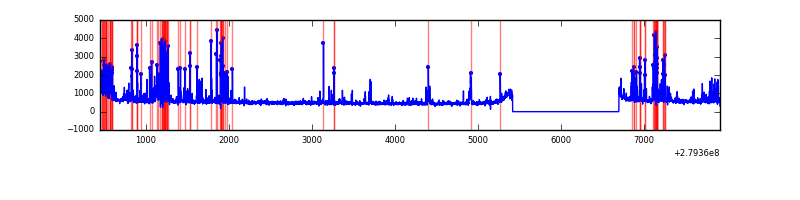 |
Top three noisy pixels from each quadrant. If the there are fewer than three noisy pixels in the level2.evt file, extra rows are filled as -1
| Pixel properties | Quadrant properties | ||||||
|---|---|---|---|---|---|---|---|
| Quadrant | DetID | PixID | Counts | Sigma | Mean | Median | Sigma |
| A | 15 | 174 | 38979 | 224.65 | 856 | 839 | 169.8 |
| A | 9 | 143 | 20633 | 116.59 | 856 | 839 | 169.8 |
| A | 0 | 226 | 7540 | 39.47 | 856 | 839 | 169.8 |
| B | 0 | 229 | 186017 | 1160.03 | 854 | 836 | 159.6 |
| B | 4 | 173 | 122864 | 764.42 | 854 | 836 | 159.6 |
| B | 15 | 35 | 32679 | 199.48 | 854 | 836 | 159.6 |
| C | 3 | 233 | 490269 | 2565.22 | 829 | 839 | 190.8 |
| C | 14 | 238 | 129397 | 673.8 | 829 | 839 | 190.8 |
| C | 0 | 207 | 6860 | 31.56 | 829 | 839 | 190.8 |
| D | 1 | 52 | 717581 | 3622.77 | 830 | 808 | 197.9 |
| D | 5 | 222 | 108480 | 544.2 | 830 | 808 | 197.9 |
| D | 2 | 234 | 23206 | 113.21 | 830 | 808 | 197.9 |
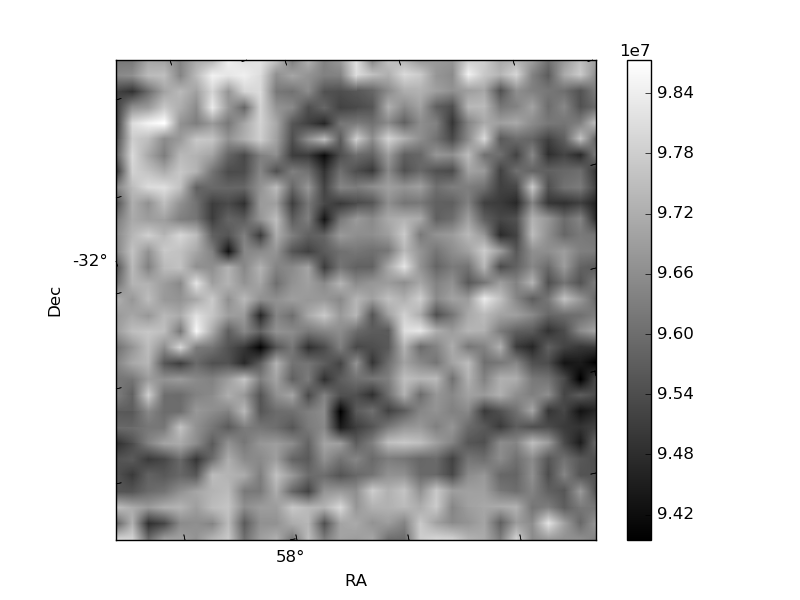
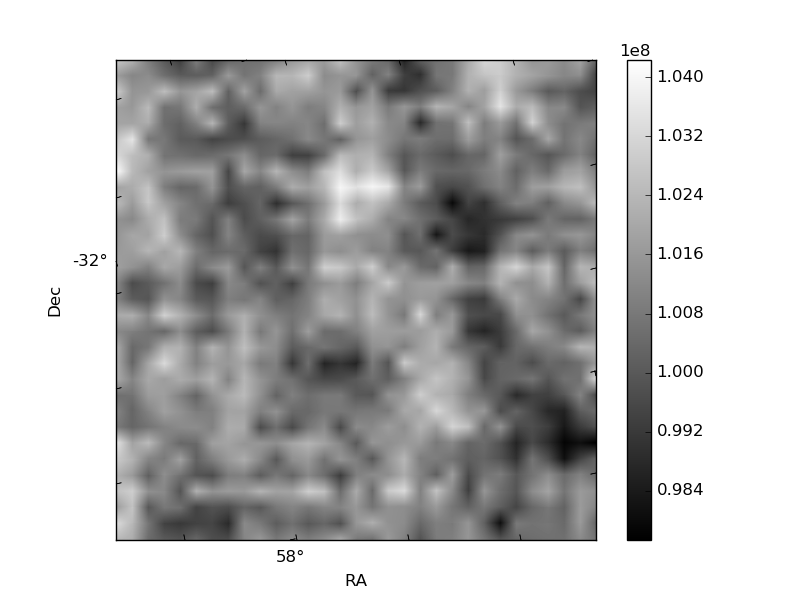
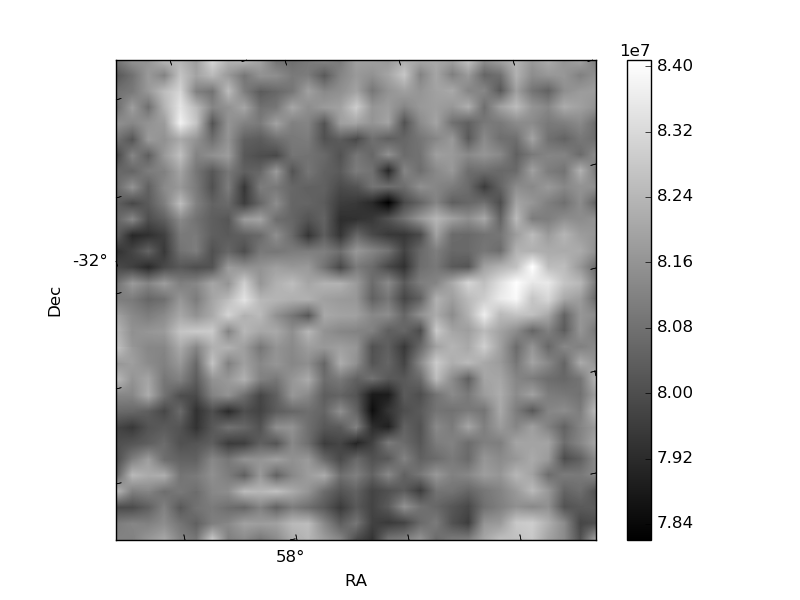
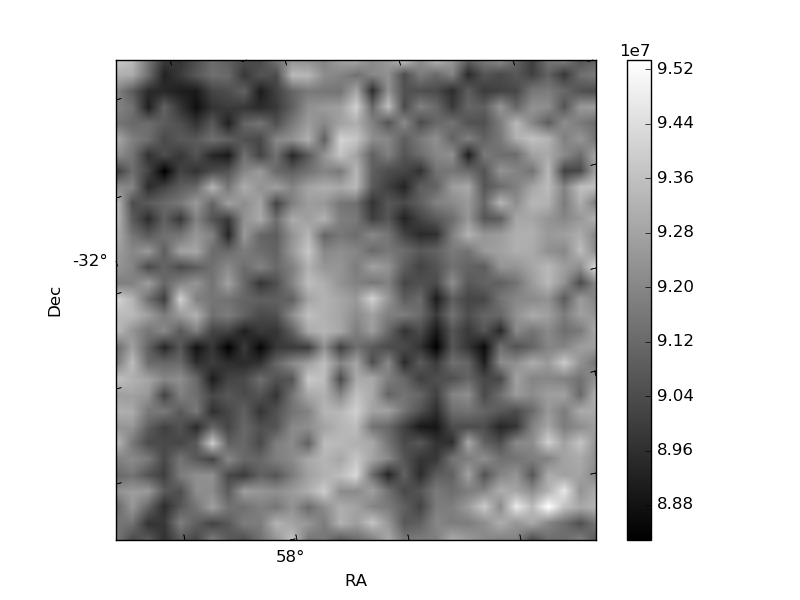
Histogram calculated using DETX and DETY for each event in the final _common_clean file
| Quadrant A | 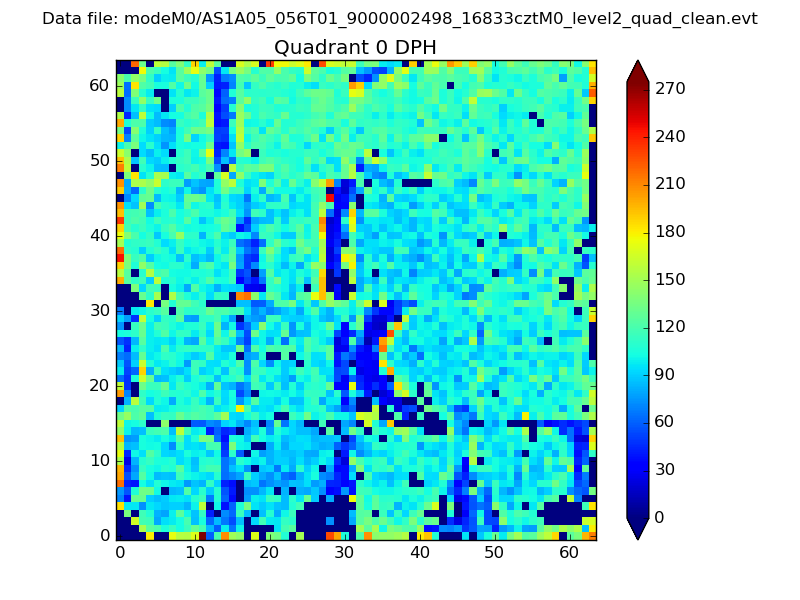 |
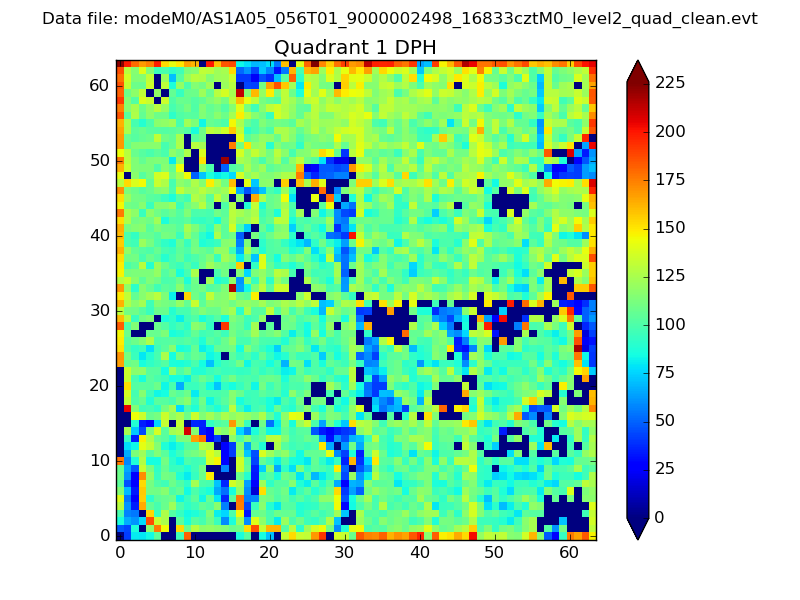 |
Quadrant B |
|---|---|---|---|
| Quadrant D | 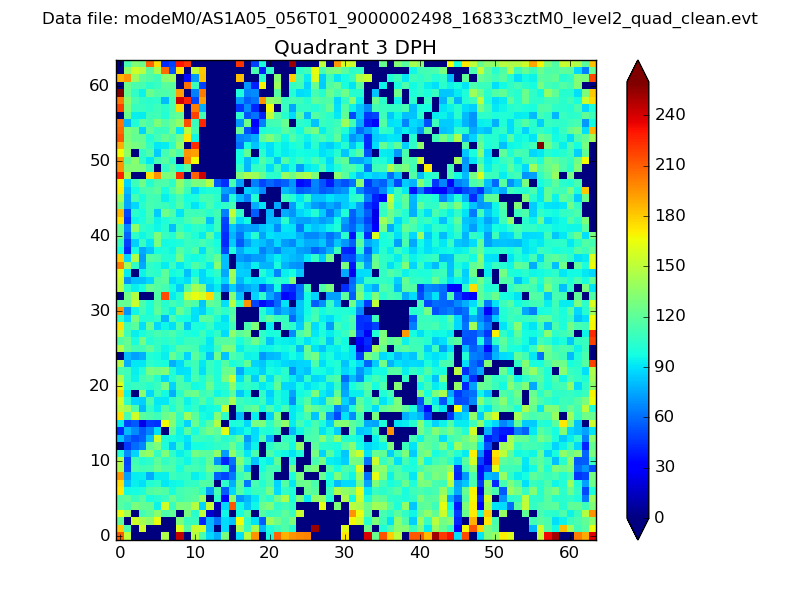 |
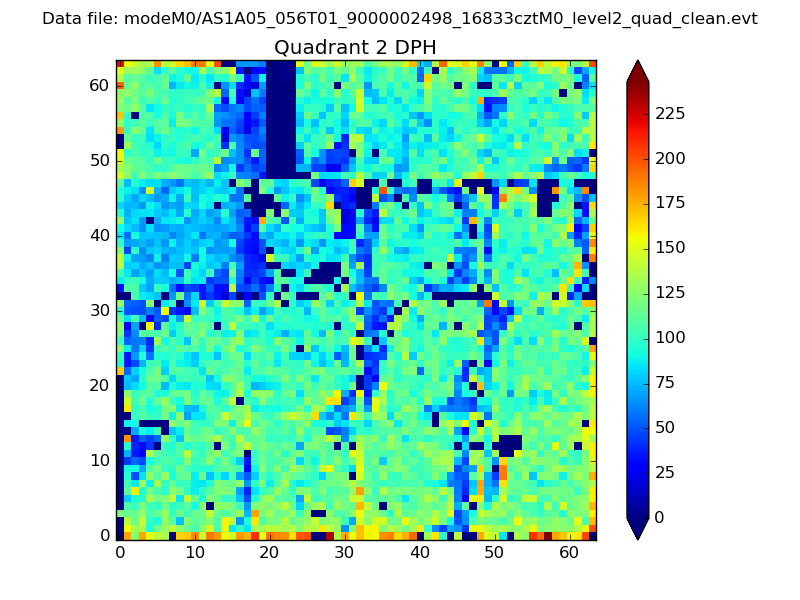 |
Quadrant C |
| Plot type | Count rate plots | Images |
|---|---|---|
| Comparison with Poisson distribution Blue bars denote a histogram of data divided into 1 sec bins. Red curve is a Poisson curve with rate = median count rate of data. |
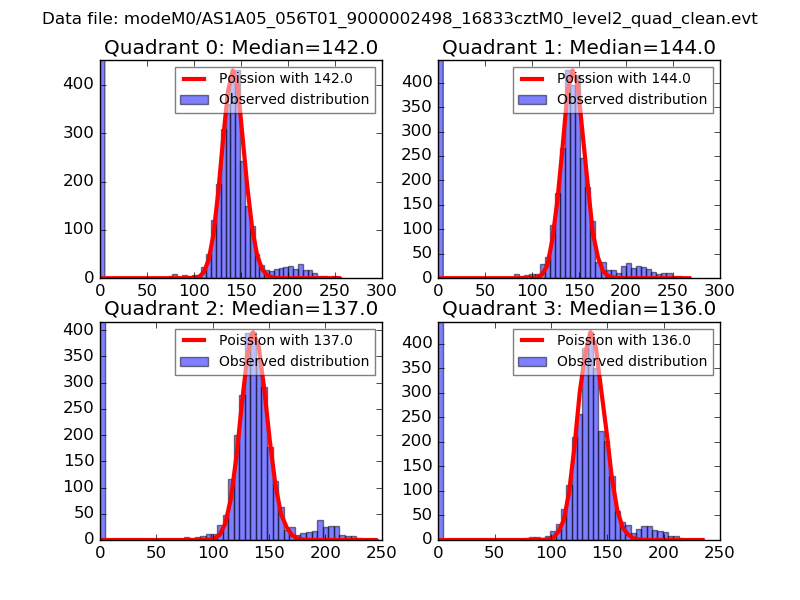 |
 |
| Quadrant-wise count rates Data is divided into 100 sec bins |
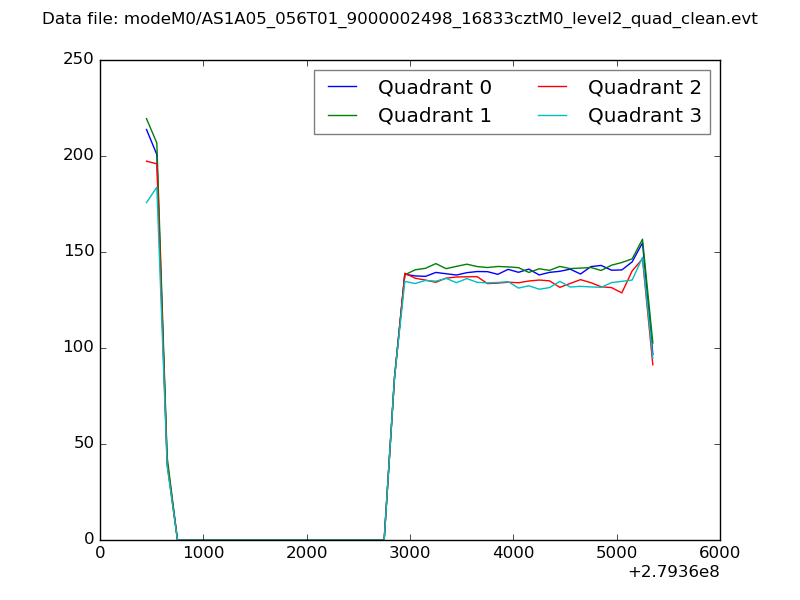 |
|
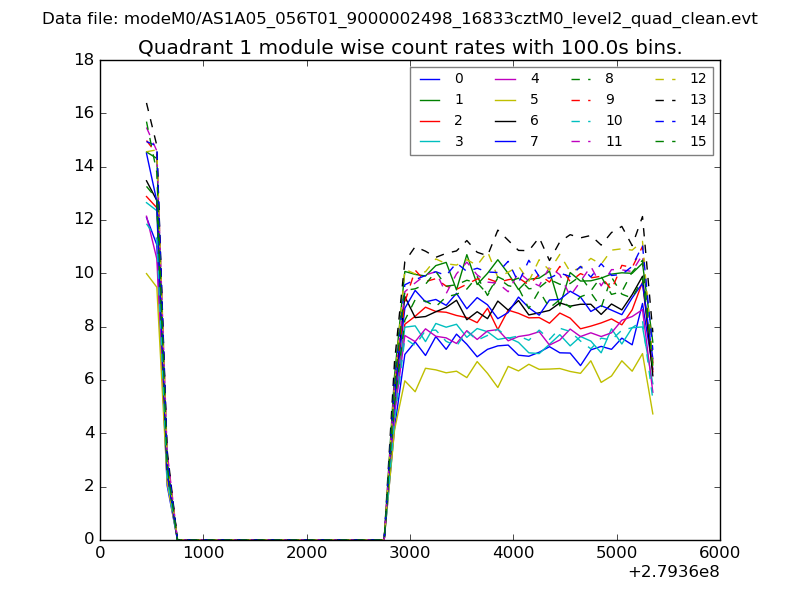
| Module-wise count rates for Quadrant A Data is divided into 100 sec bins |
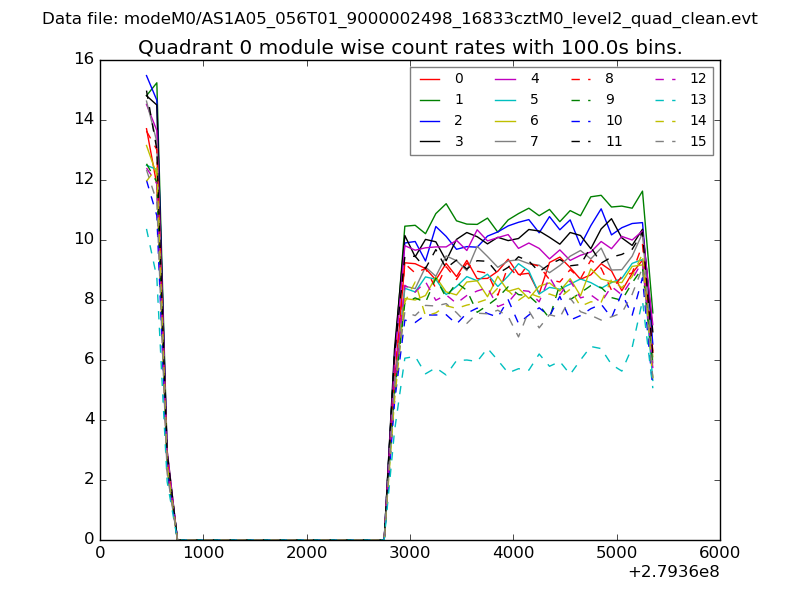 |
 |
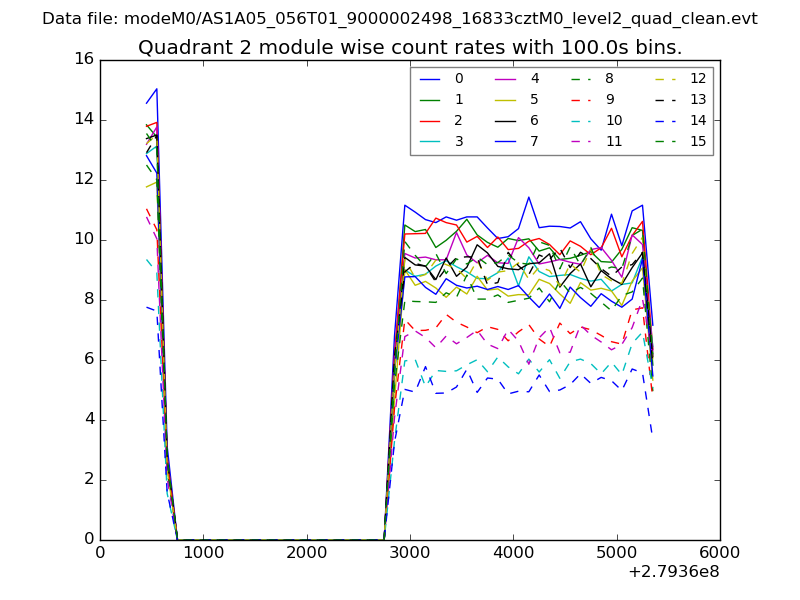
| Module-wise count rates for Quadrant B Data is divided into 100 sec bins |
 |
 |
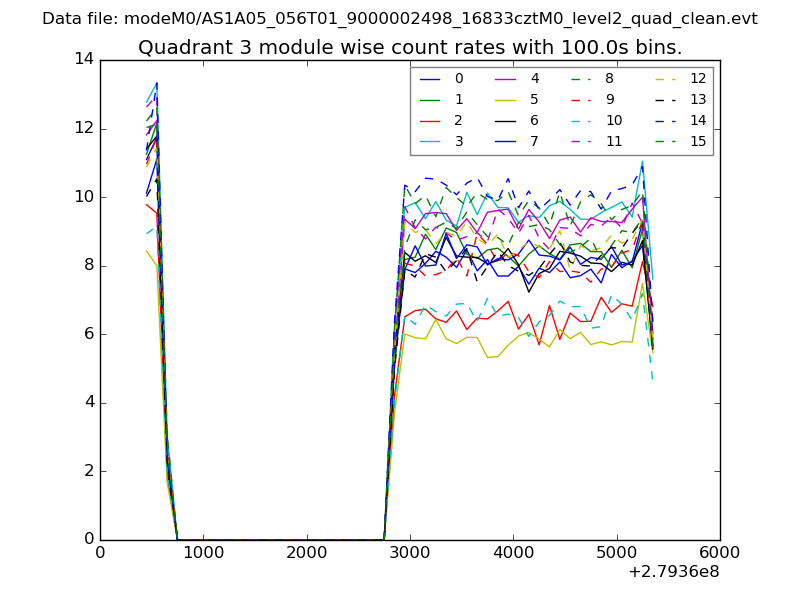
| Module-wise count rates for Quadrant C Data is divided into 100 sec bins |
 |
 |
| Module-wise count rates for Quadrant D Data is divided into 100 sec bins |
 |
 |
| Parameter | Plot |
|---|---|
| CZT HV Monitor | 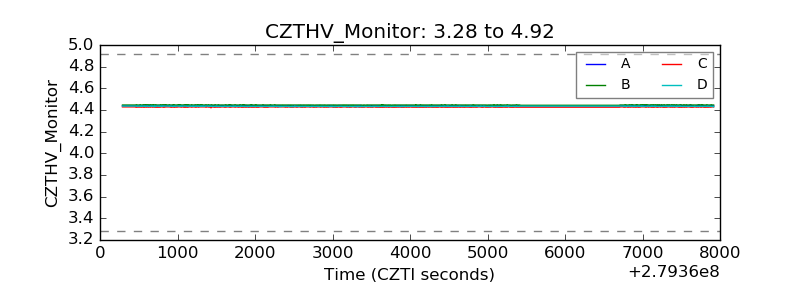 |
| D_VDD | 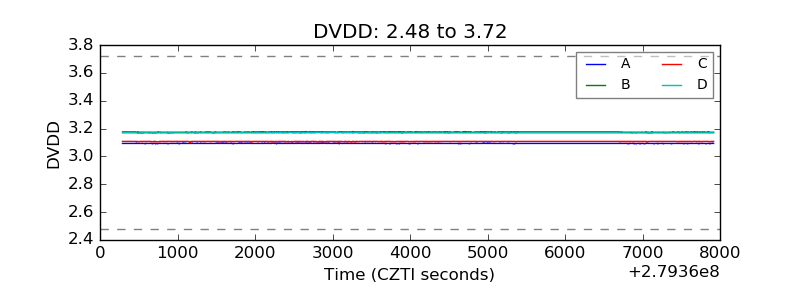 |
| Temperature 1 | 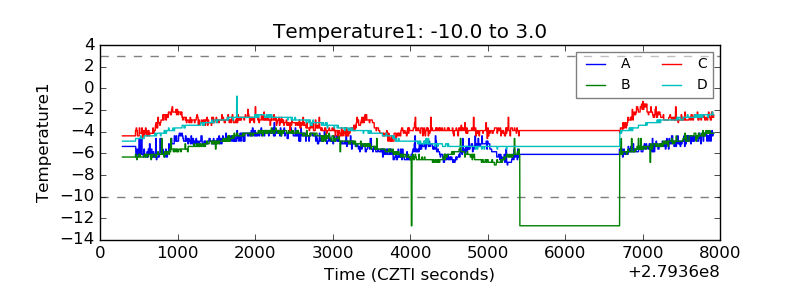 |
| Veto HV Monitor | 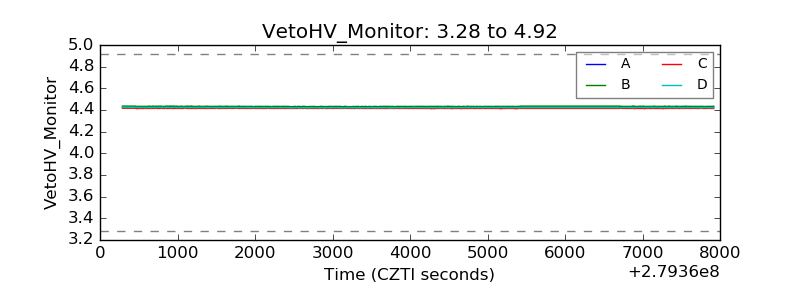 |
| Veto LLD | 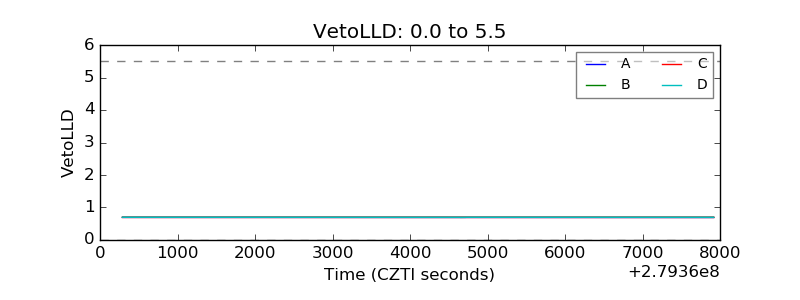 |
| Alpha Counter | 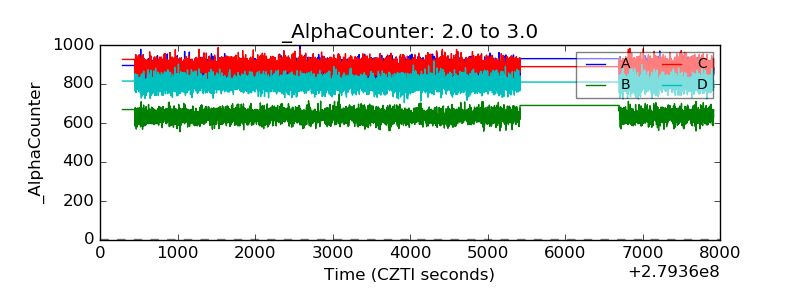 |
| _CPM_Rate |  |
| CZT Counter | 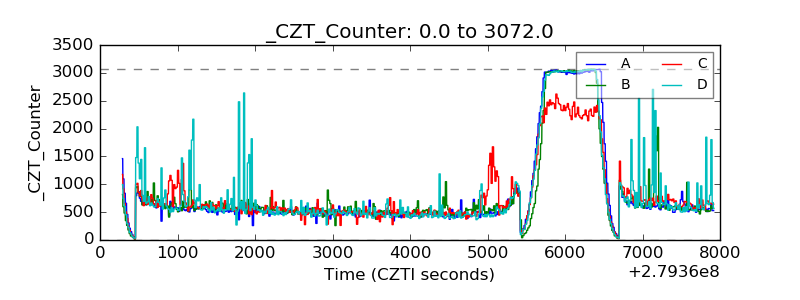 |
| +2.5 Volts monitor |  |
| +5 Volts monitor |  |
| _ROLL_ROT | 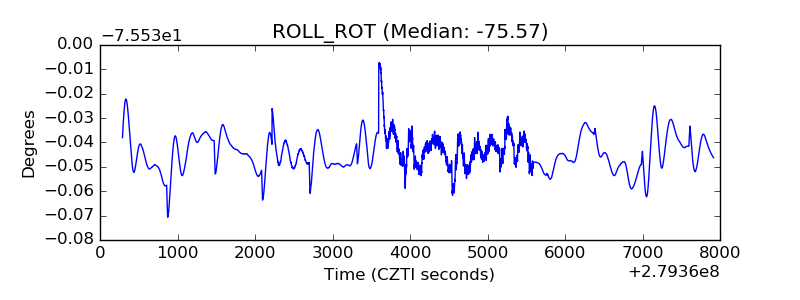 |
| _Roll_DEC | 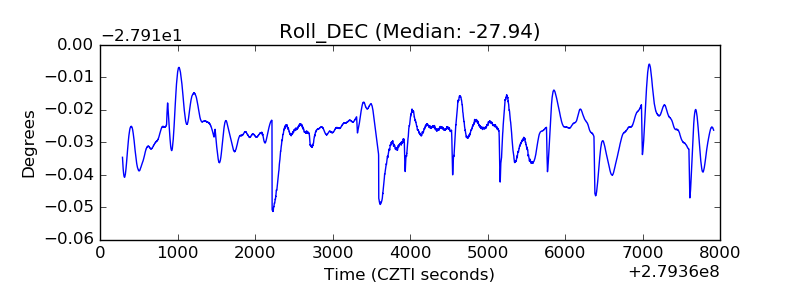 |
| _Roll_RA |  |
| Veto Counter | 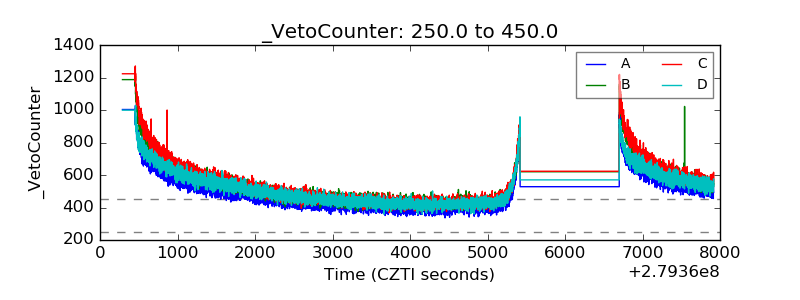 |