| Param | Original file | Final file |
|---|---|---|
| Filename | modeM0/AS1A05_056T01_9000002498_16835cztM0_level2.evt | modeM0/AS1A05_056T01_9000002498_16835cztM0_level2_quad_clean.evt |
| Size (bytes) | 543,251,520 | 79,361,280 |
| Size | 518.1 MB | 75.7 MB |
| Events in quadrant A | 3,334,456 | 502,337 |
| Events in quadrant B | 3,478,821 | 508,883 |
| Events in quadrant C | 3,870,164 | 479,403 |
| Events in quadrant D | 5,332,204 | 462,998 |
| Mode M9 | |||
|---|---|---|---|
| Quadrant | BADHDUFLAG | Total packets | Discarded packets |
| A | 0 | 23 | 0 |
| B | 0 | 23 | 0 |
| C | 0 | 23 | 0 |
| D | 0 | 24 | 0 |
| Mode SS | |||
|---|---|---|---|
| Quadrant | BADHDUFLAG | Total packets | Discarded packets |
| A | 0 | 130 | 0 |
| B | 0 | 130 | 0 |
| C | 0 | 130 | 0 |
| D | 0 | 130 | 0 |
| Mode M0 | |||
|---|---|---|---|
| Quadrant | BADHDUFLAG | Total packets | Discarded packets |
| A | 0 | 13861 | 3 |
| B | 0 | 14092 | 2 |
| C | 0 | 15941 | 2 |
| D | 0 | 20350 | 2 |
| Quadrant | Total seconds | Saturated seconds | Saturation percentage |
|---|---|---|---|
| A | 6445 | 147 | 2.280838% |
| B | 6445 | 156 | 2.420481% |
| C | 6445 | 193 | 2.994569% |
| D | 6445 | 371 | 5.756400% |
Noise dominated data is calculated using 1-second bins in cleaned event files. If a bin has >2000 counts, and if more than 50% of those come from <1% of pixels, then it is considered to be noise-dominated and hence unusable.
| Quadrant | # 1 sec bins | Bins with >0 counts | Bins with >2000 counts | High rate bins dominated by noise | Noise dominated (total time) | Noise dominated (detector-on time) | Marked lightcurve |
|---|---|---|---|---|---|---|---|
| A | 7626 | 6447 | 2 | 2 | 0.03% | 0.03% | 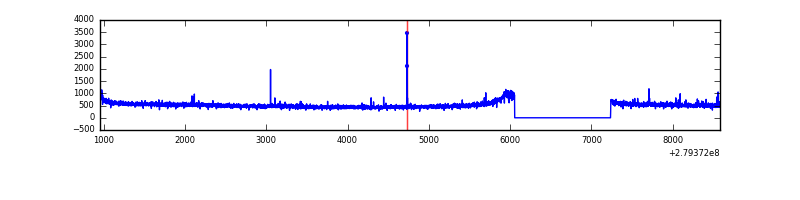 |
| B | 7626 | 6447 | 1 | 1 | 0.01% | 0.02% | 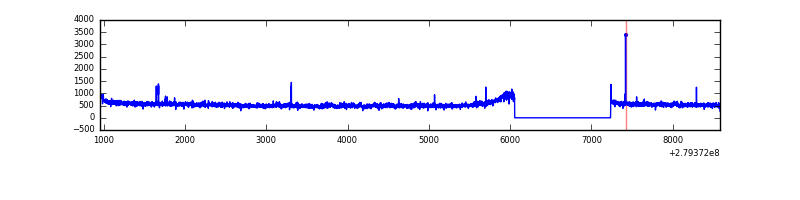 |
| C | 7626 | 6447 | 0 | 0 | 0.00% | 0.00% | 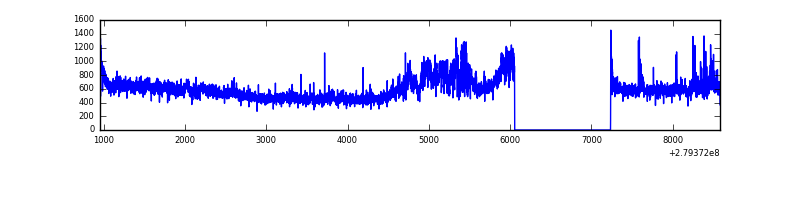 |
| D | 7626 | 6447 | 244 | 244 | 3.20% | 3.78% | 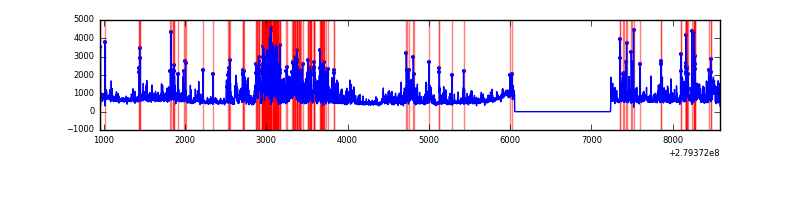 |
Top three noisy pixels from each quadrant. If the there are fewer than three noisy pixels in the level2.evt file, extra rows are filled as -1
| Pixel properties | Quadrant properties | ||||||
|---|---|---|---|---|---|---|---|
| Quadrant | DetID | PixID | Counts | Sigma | Mean | Median | Sigma |
| A | 9 | 143 | 35603 | 203.5 | 855 | 838 | 170.8 |
| A | 13 | 228 | 11534 | 62.61 | 855 | 838 | 170.8 |
| A | 0 | 226 | 7395 | 38.38 | 855 | 838 | 170.8 |
| B | 0 | 229 | 114236 | 701.84 | 852 | 832 | 161.6 |
| B | 15 | 35 | 25793 | 154.48 | 852 | 832 | 161.6 |
| B | 12 | 111 | 19408 | 114.96 | 852 | 832 | 161.6 |
| C | 3 | 233 | 465753 | 2463.42 | 816 | 824 | 188.7 |
| C | 14 | 238 | 126409 | 665.41 | 816 | 824 | 188.7 |
| C | 7 | 247 | 50598 | 263.73 | 816 | 824 | 188.7 |
| D | 1 | 52 | 2131914 | 10770.57 | 818 | 796 | 197.9 |
| D | 5 | 222 | 94179 | 471.95 | 818 | 796 | 197.9 |
| D | 2 | 234 | 25927 | 127.01 | 818 | 796 | 197.9 |
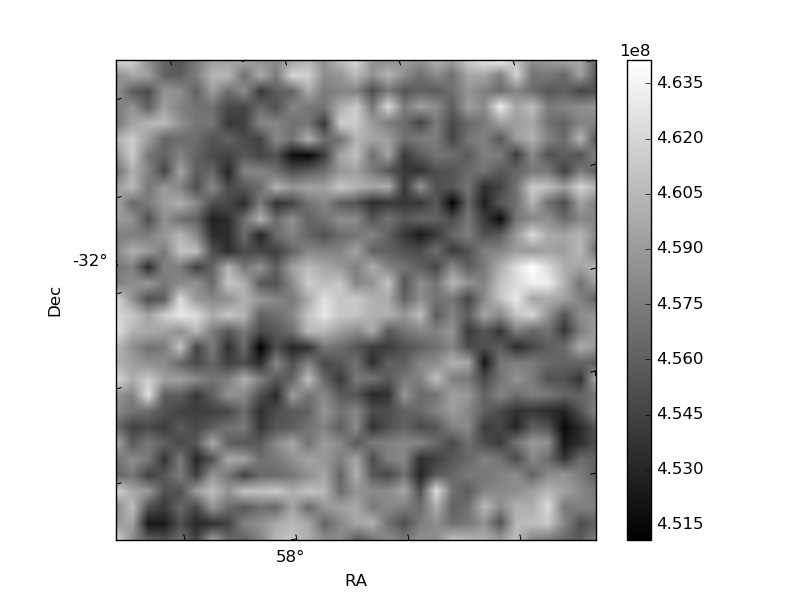
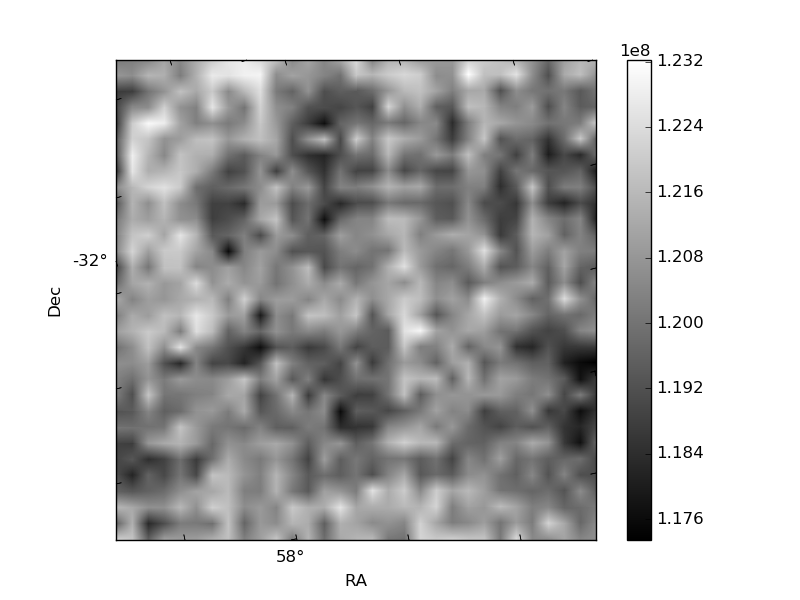
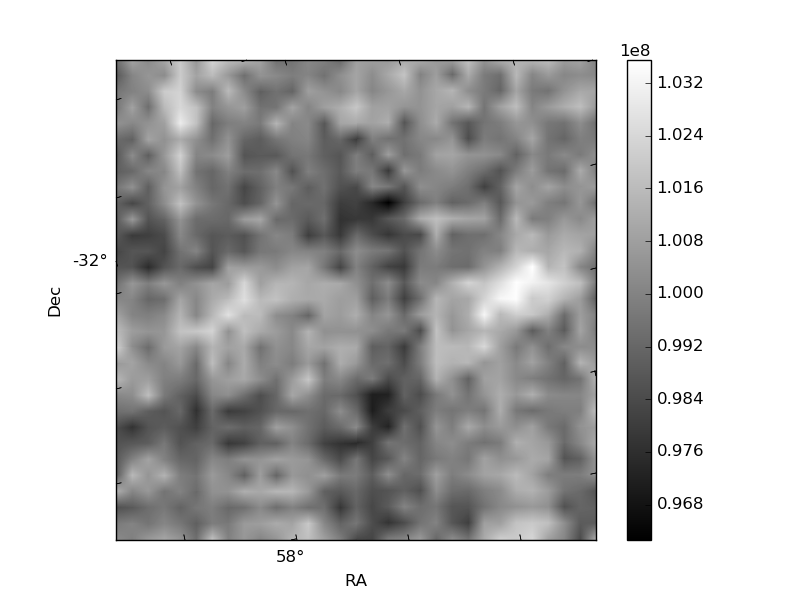
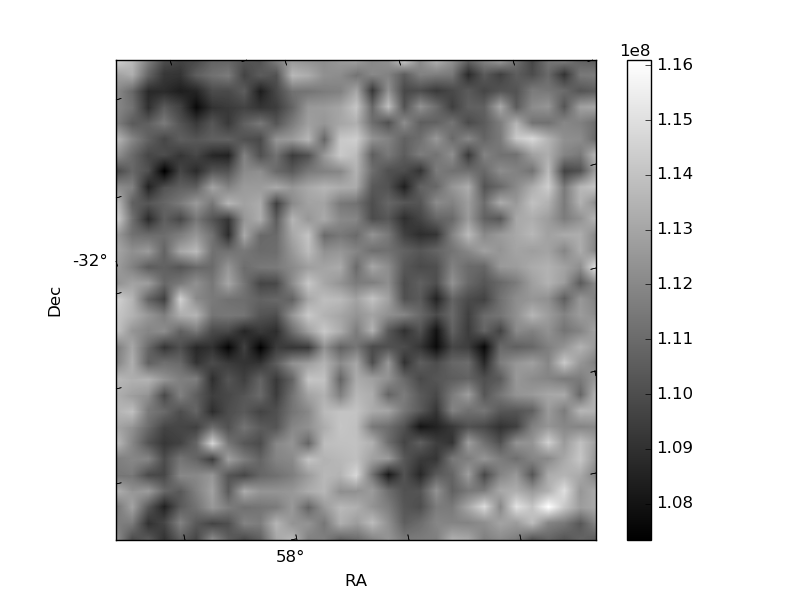
Histogram calculated using DETX and DETY for each event in the final _common_clean file
| Quadrant A | 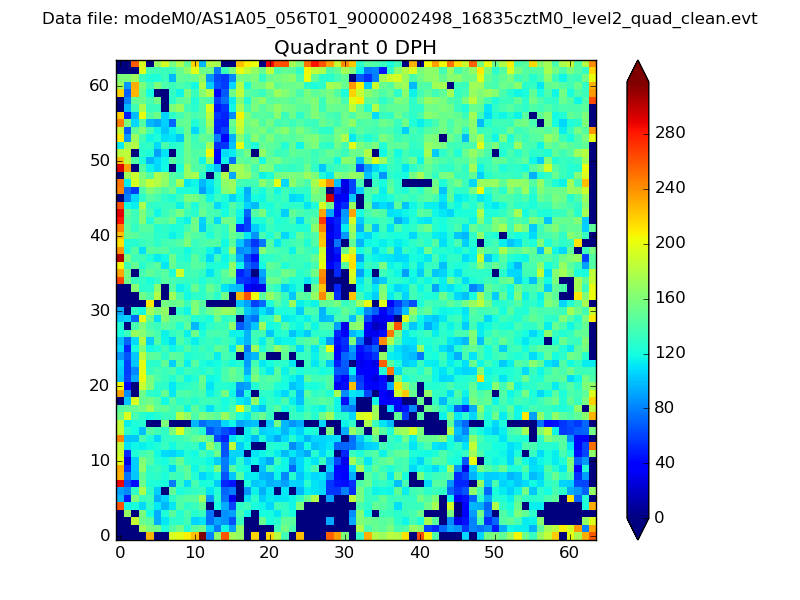 |
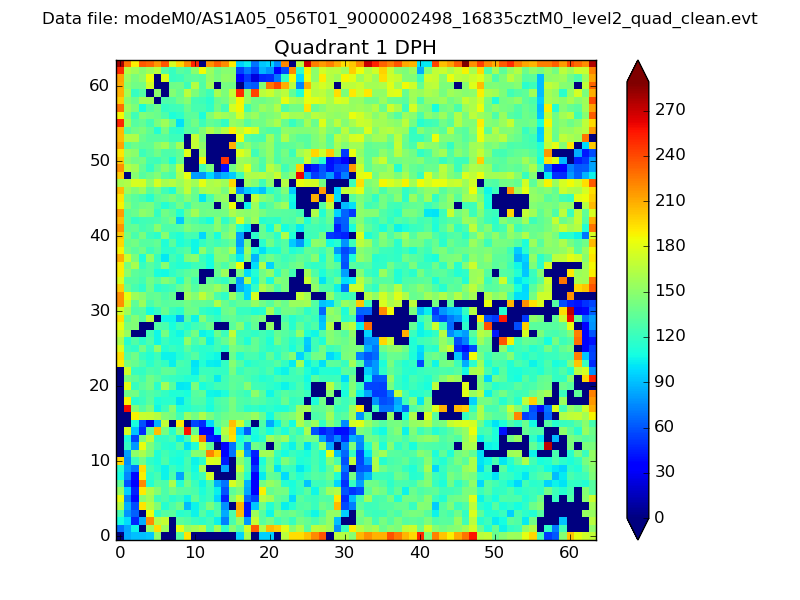 |
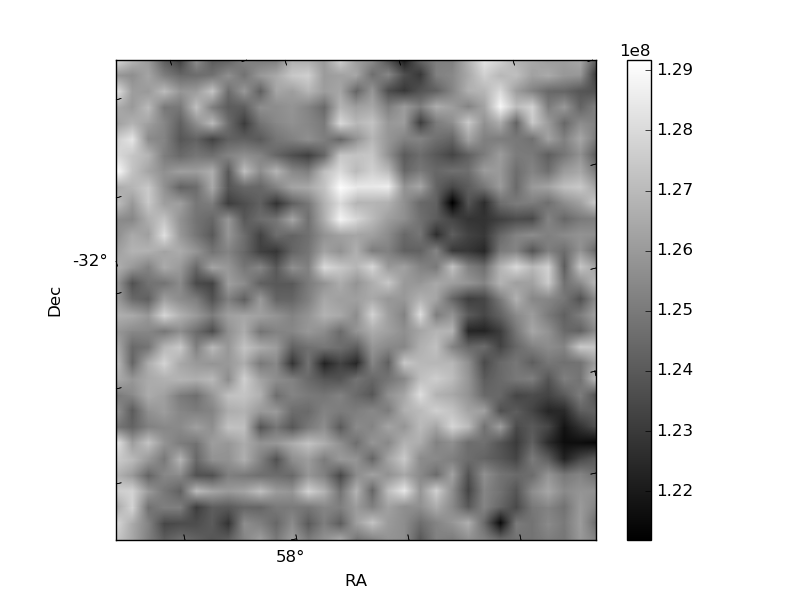
Quadrant B |
|---|---|---|---|
| Quadrant D | 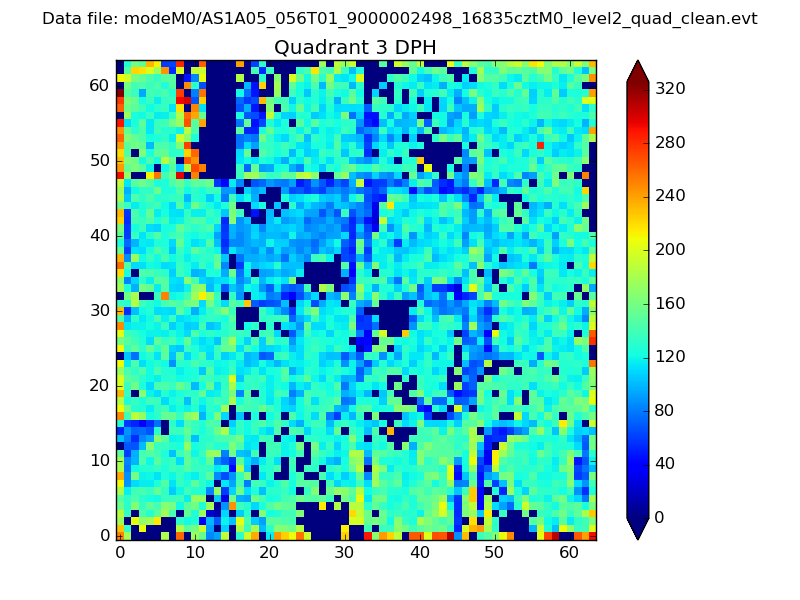 |
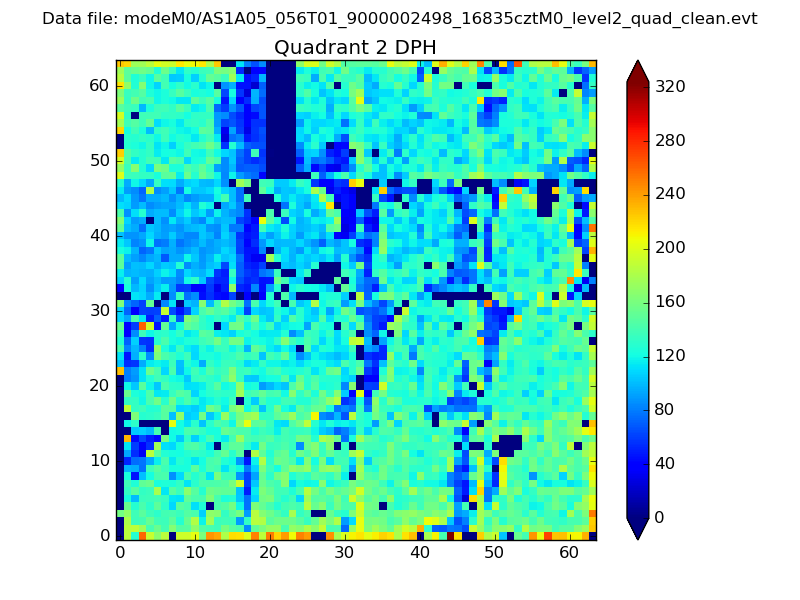 |
Quadrant C |
| Plot type | Count rate plots | Images |
|---|---|---|
| Comparison with Poisson distribution Blue bars denote a histogram of data divided into 1 sec bins. Red curve is a Poisson curve with rate = median count rate of data. |
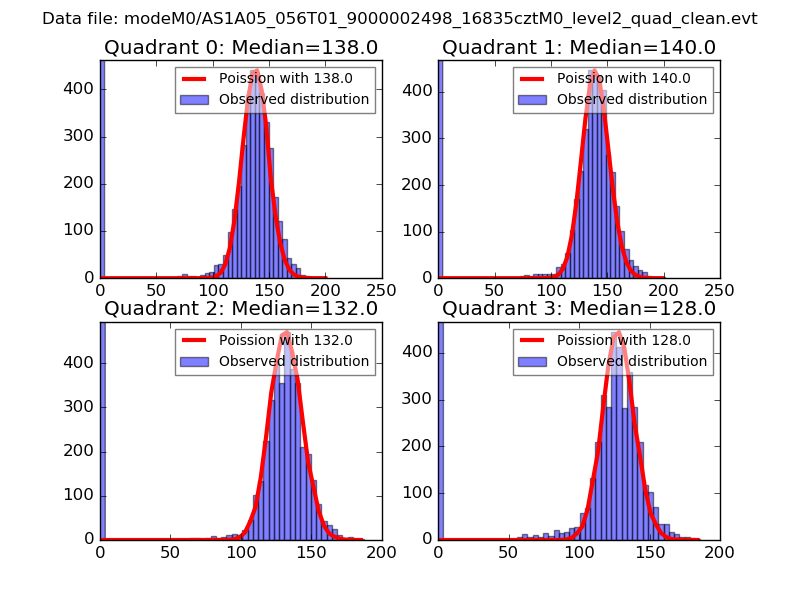 |
 |
| Quadrant-wise count rates Data is divided into 100 sec bins |
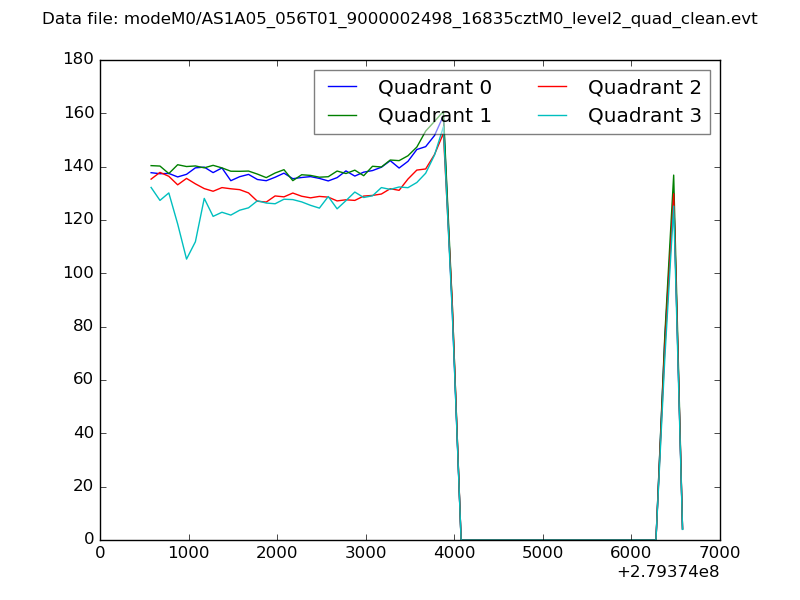 |
|
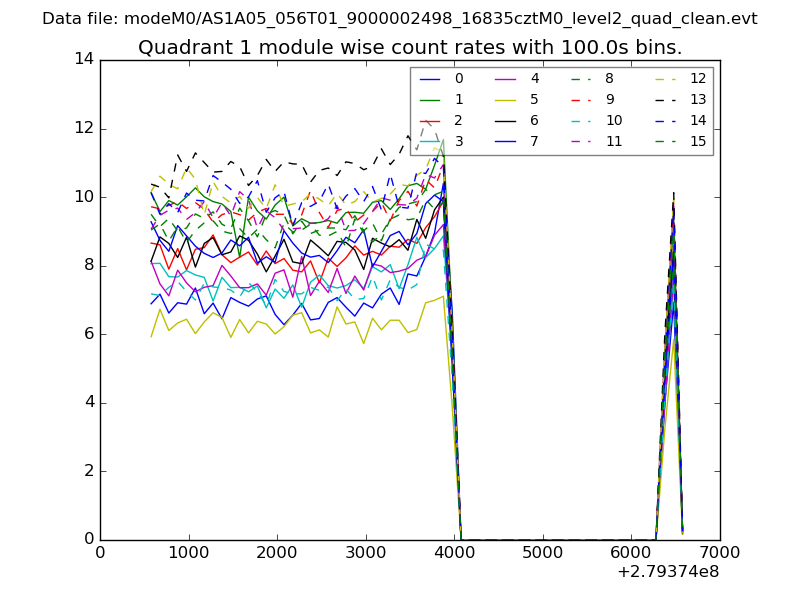
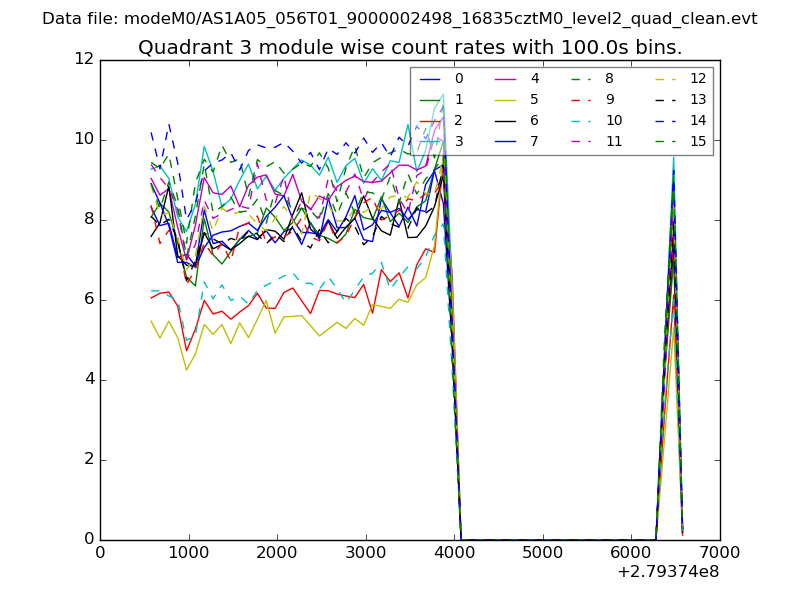
| Module-wise count rates for Quadrant A Data is divided into 100 sec bins |
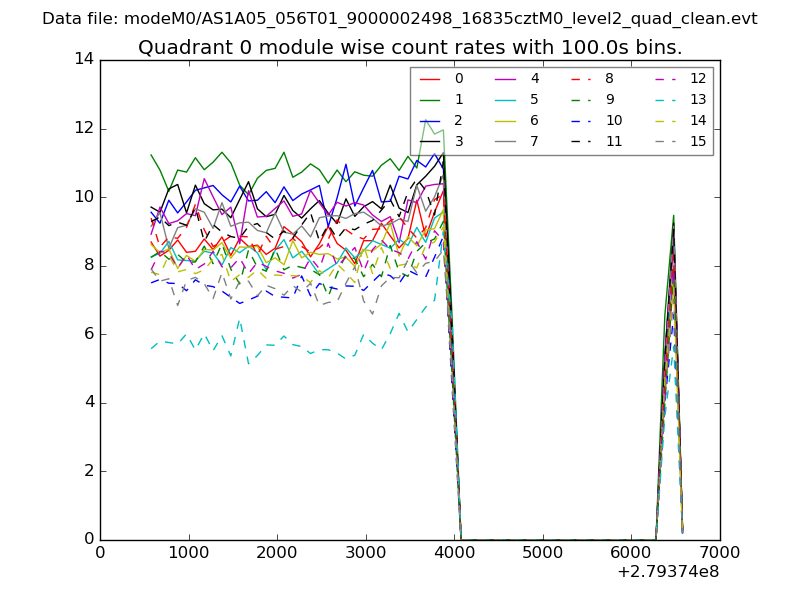 |
 |
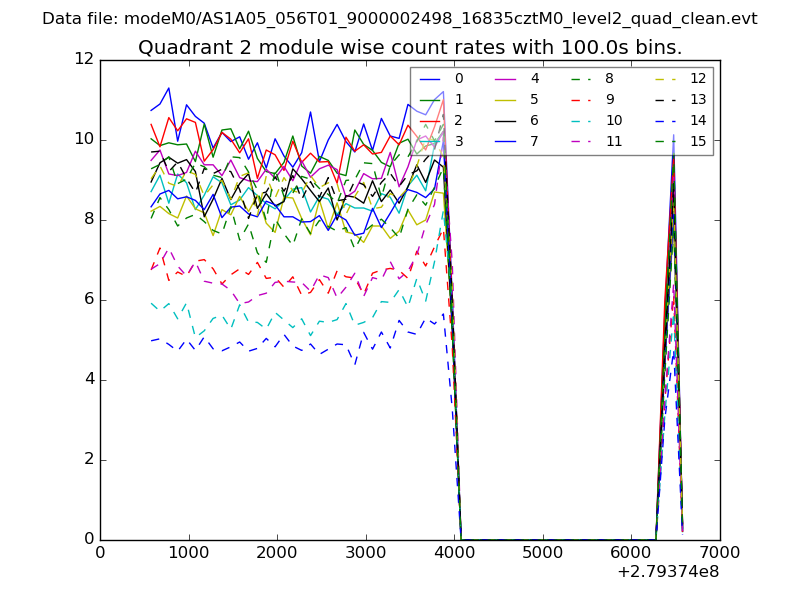
| Module-wise count rates for Quadrant B Data is divided into 100 sec bins |
 |
 |
| Module-wise count rates for Quadrant C Data is divided into 100 sec bins |
 |
 |
| Module-wise count rates for Quadrant D Data is divided into 100 sec bins |
 |
 |
| Parameter | Plot |
|---|---|
| CZT HV Monitor | 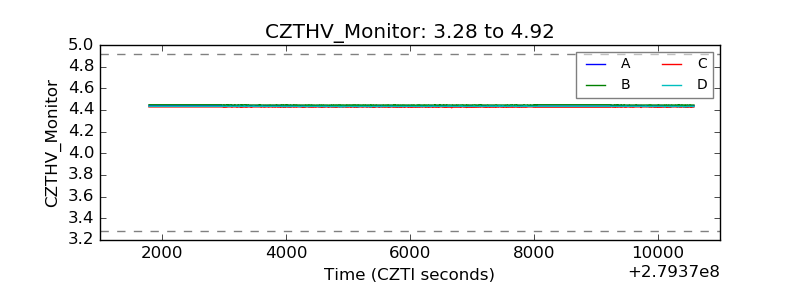 |
| D_VDD | 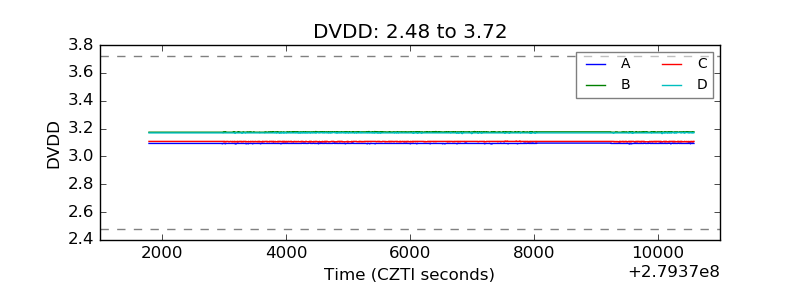 |
| Temperature 1 | 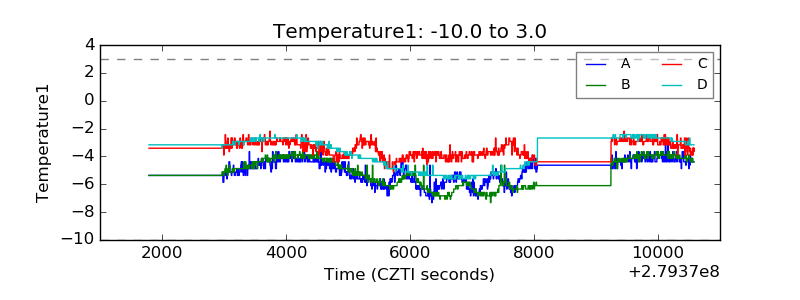 |
| Veto HV Monitor | 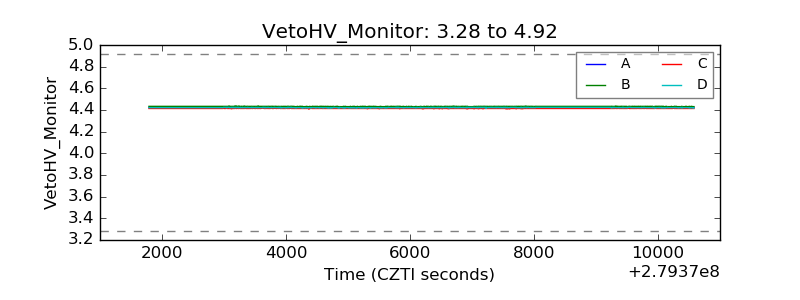 |
| Veto LLD | 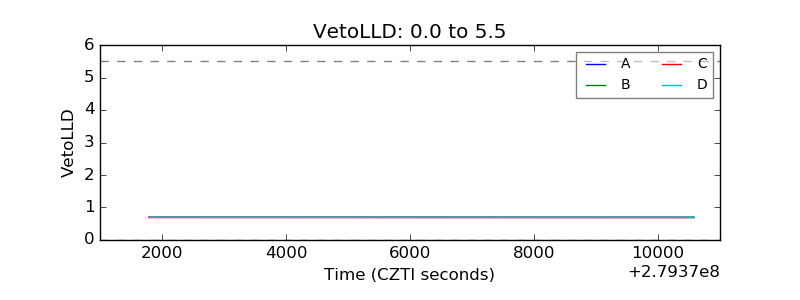 |
| Alpha Counter | 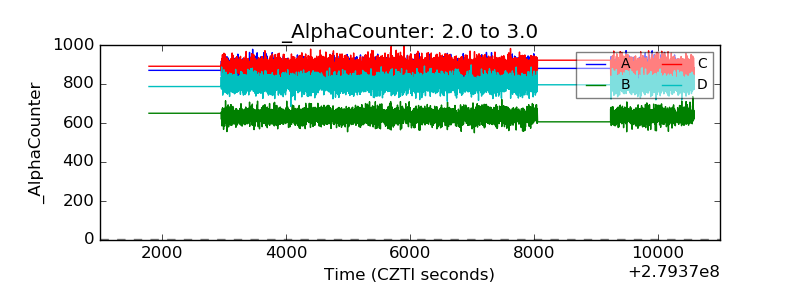 |
| _CPM_Rate | 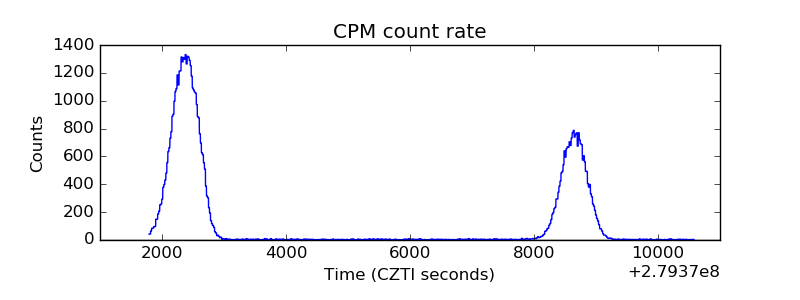 |
| CZT Counter | 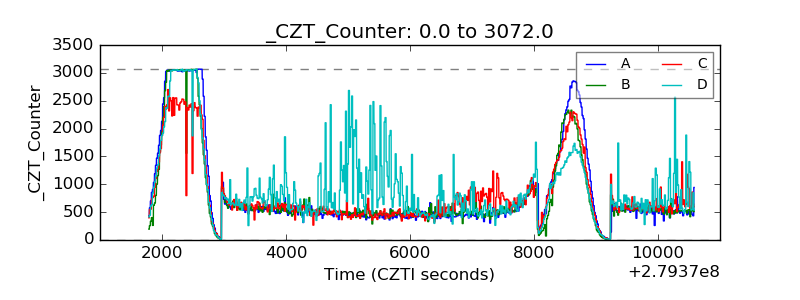 |
| +2.5 Volts monitor |  |
| +5 Volts monitor | 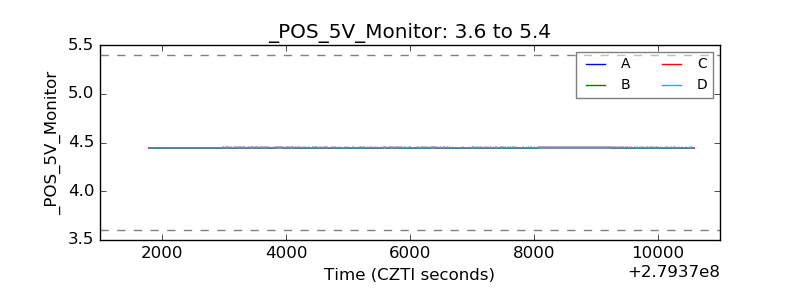 |
| _ROLL_ROT | 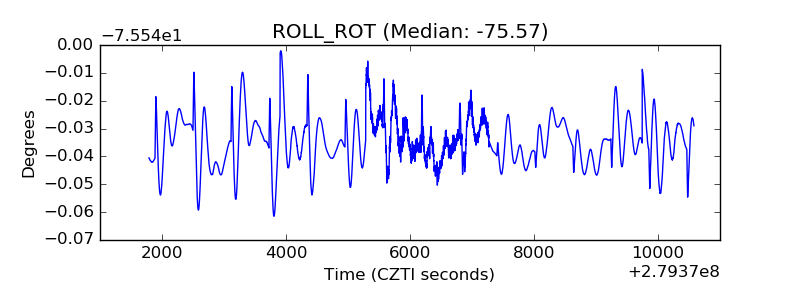 |
| _Roll_DEC | 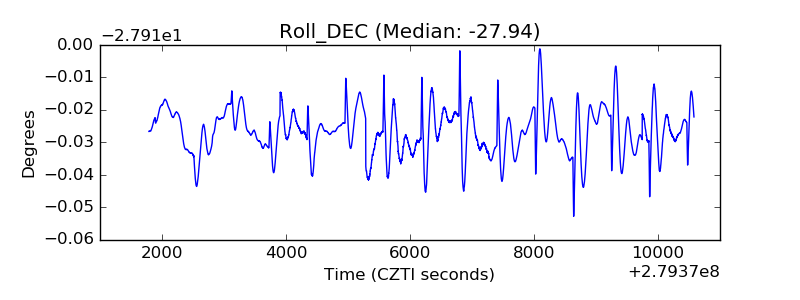 |
| _Roll_RA |  |
| Veto Counter | 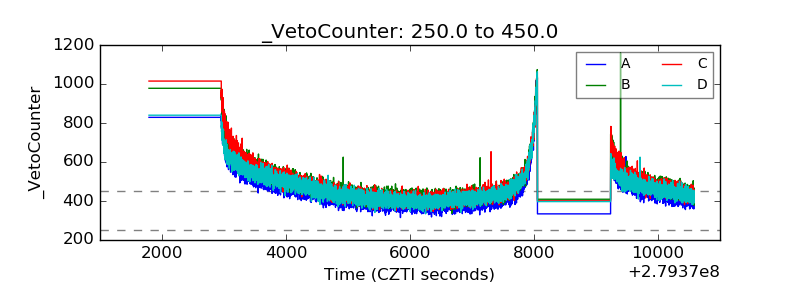 |