| Param | Original file | Final file |
|---|---|---|
| Filename | modeM0/AS1A05_056T01_9000002498_16842cztM0_level2.evt | modeM0/AS1A05_056T01_9000002498_16842cztM0_level2_quad_clean.evt |
| Size (bytes) | 1,348,807,680 | 228,997,440 |
| Size | 1.3 GB | 218.4 MB |
| Events in quadrant A | 8,481,199 | 1,455,605 |
| Events in quadrant B | 9,028,196 | 1,477,145 |
| Events in quadrant C | 8,916,256 | 1,388,232 |
| Events in quadrant D | 13,177,631 | 1,344,302 |
| Mode M9 | |||
|---|---|---|---|
| Quadrant | BADHDUFLAG | Total packets | Discarded packets |
| A | 0 | 24 | 0 |
| B | 0 | 24 | 0 |
| C | 0 | 24 | 0 |
| D | 0 | 24 | 0 |
| Mode SS | |||
|---|---|---|---|
| Quadrant | BADHDUFLAG | Total packets | Discarded packets |
| A | 0 | 376 | 0 |
| B | 0 | 376 | 0 |
| C | 0 | 376 | 0 |
| D | 0 | 376 | 0 |
| Mode M0 | |||
|---|---|---|---|
| Quadrant | BADHDUFLAG | Total packets | Discarded packets |
| A | 0 | 37564 | 5 |
| B | 0 | 38255 | 4 |
| C | 0 | 38004 | 4 |
| D | 0 | 51743 | 4 |
| Quadrant | Total seconds | Saturated seconds | Saturation percentage |
|---|---|---|---|
| A | 18438 | 67 | 0.363380% |
| B | 18438 | 99 | 0.536935% |
| C | 18438 | 154 | 0.835232% |
| D | 18438 | 966 | 5.239180% |
Noise dominated data is calculated using 1-second bins in cleaned event files. If a bin has >2000 counts, and if more than 50% of those come from <1% of pixels, then it is considered to be noise-dominated and hence unusable.
| Quadrant | # 1 sec bins | Bins with >0 counts | Bins with >2000 counts | High rate bins dominated by noise | Noise dominated (total time) | Noise dominated (detector-on time) | Marked lightcurve |
|---|---|---|---|---|---|---|---|
| A | 20854 | 18443 | 3 | 3 | 0.01% | 0.02% | 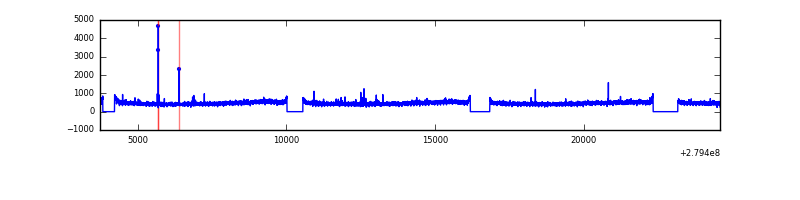 |
| B | 20854 | 18443 | 5 | 5 | 0.02% | 0.03% | 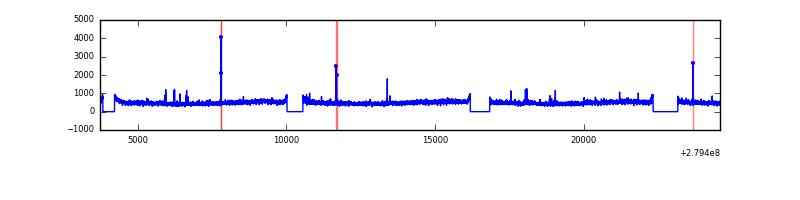 |
| C | 20854 | 18443 | 1 | 1 | 0.00% | 0.01% | 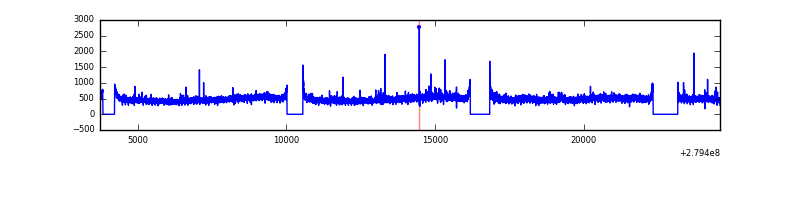 |
| D | 20854 | 18443 | 658 | 658 | 3.16% | 3.57% | 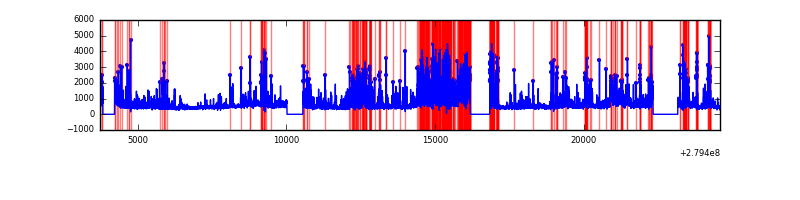 |
Top three noisy pixels from each quadrant. If the there are fewer than three noisy pixels in the level2.evt file, extra rows are filled as -1
| Pixel properties | Quadrant properties | ||||||
|---|---|---|---|---|---|---|---|
| Quadrant | DetID | PixID | Counts | Sigma | Mean | Median | Sigma |
| A | 9 | 143 | 47739 | 102.98 | 2196 | 2150 | 442.7 |
| A | 0 | 226 | 18890 | 37.81 | 2196 | 2150 | 442.7 |
| A | 3 | 137 | 16642 | 32.74 | 2196 | 2150 | 442.7 |
| B | 0 | 229 | 234429 | 548.09 | 2198 | 2144 | 423.8 |
| B | 3 | 64 | 110591 | 255.89 | 2198 | 2144 | 423.8 |
| B | 4 | 173 | 64443 | 147.0 | 2198 | 2144 | 423.8 |
| C | 14 | 238 | 322771 | 650.41 | 2110 | 2122 | 493.0 |
| C | 3 | 233 | 222062 | 446.13 | 2110 | 2122 | 493.0 |
| C | 0 | 207 | 90126 | 178.51 | 2110 | 2122 | 493.0 |
| D | 1 | 52 | 4569394 | 9058.52 | 2081 | 2024 | 504.2 |
| D | 5 | 222 | 588861 | 1163.88 | 2081 | 2024 | 504.2 |
| D | 2 | 234 | 57721 | 110.46 | 2081 | 2024 | 504.2 |
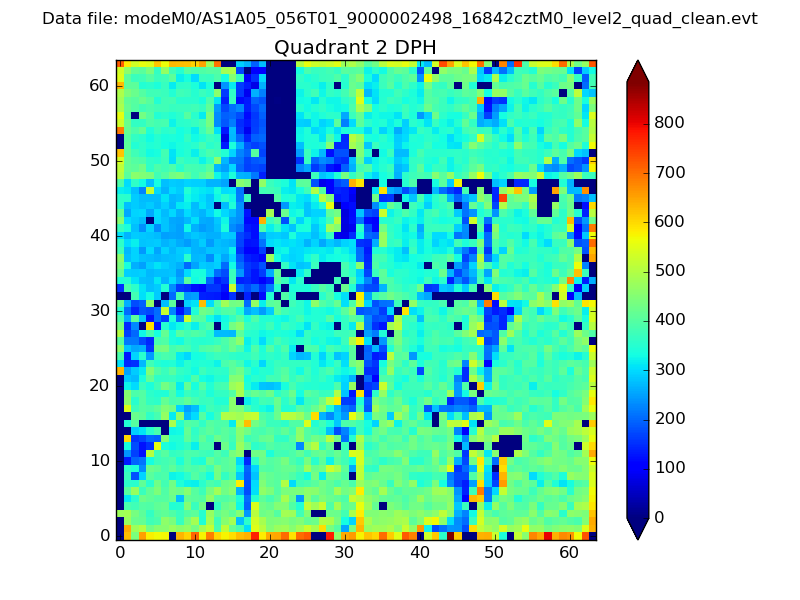
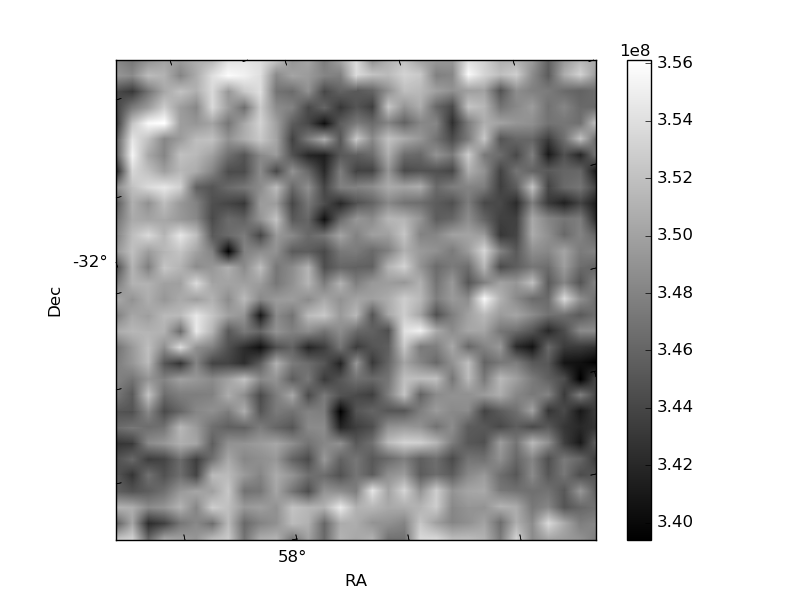
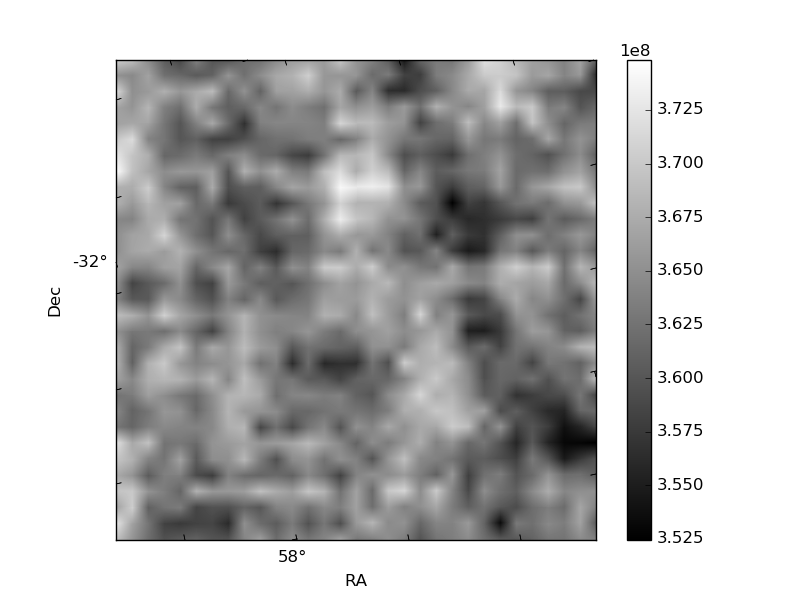
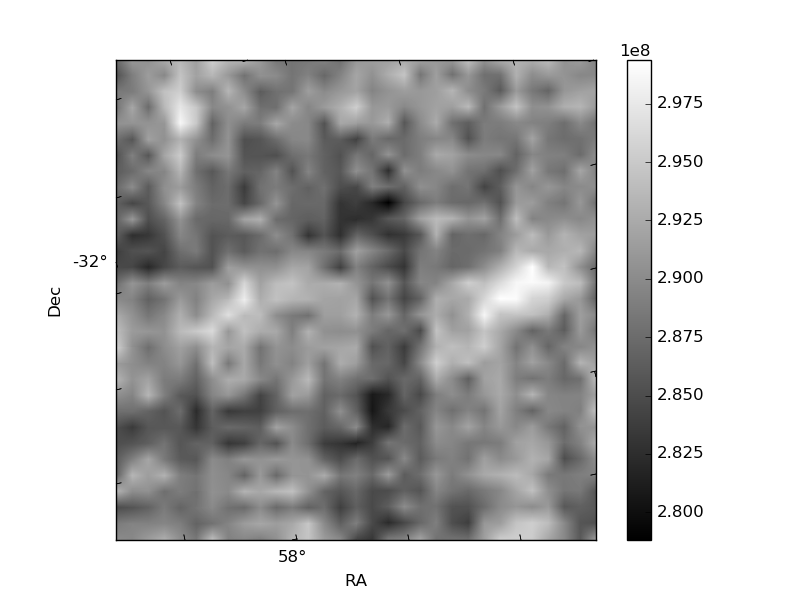
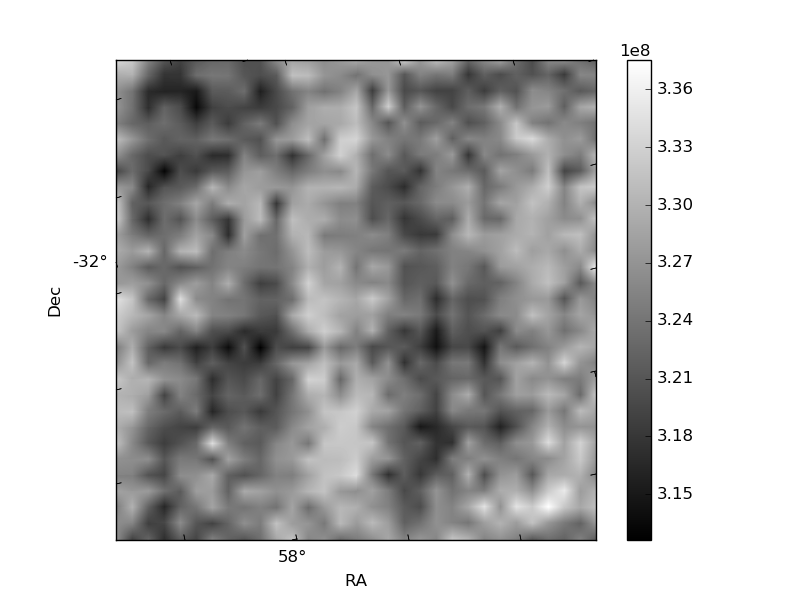
Histogram calculated using DETX and DETY for each event in the final _common_clean file
| Quadrant A | 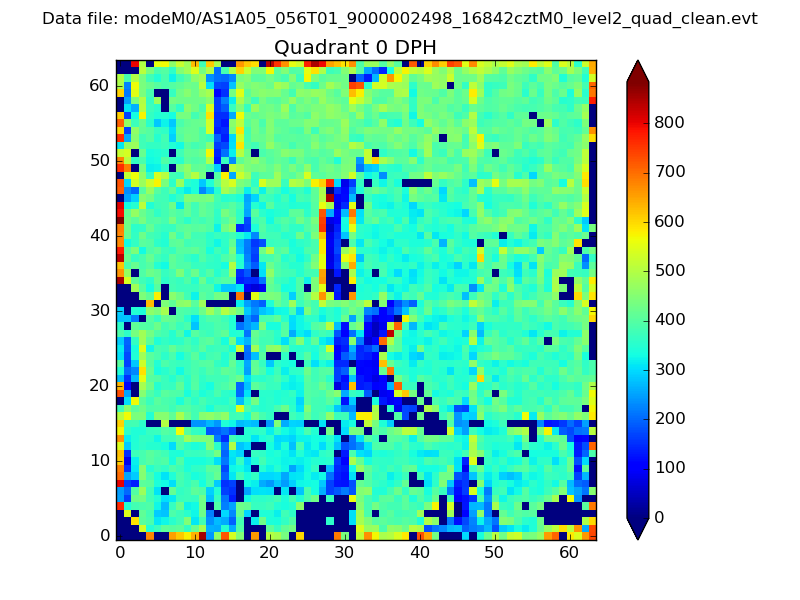 |
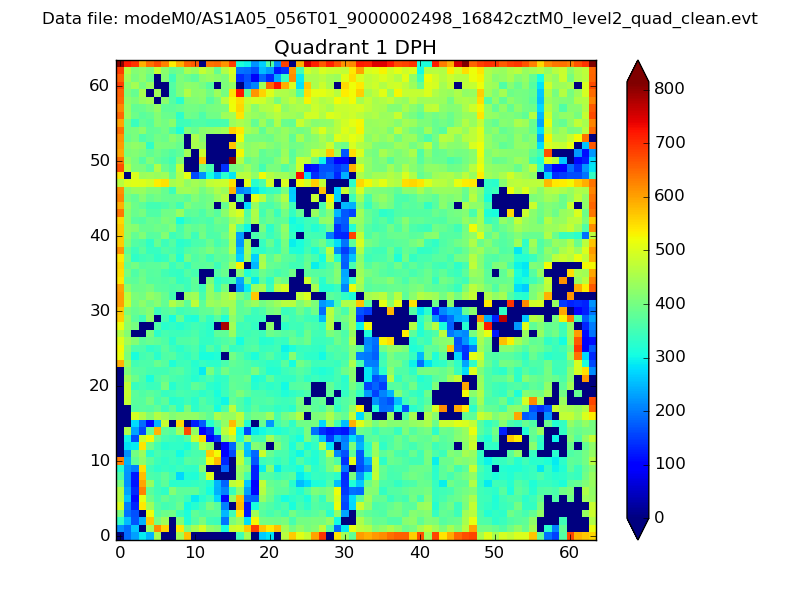 |
Quadrant B |
|---|---|---|---|
| Quadrant D | 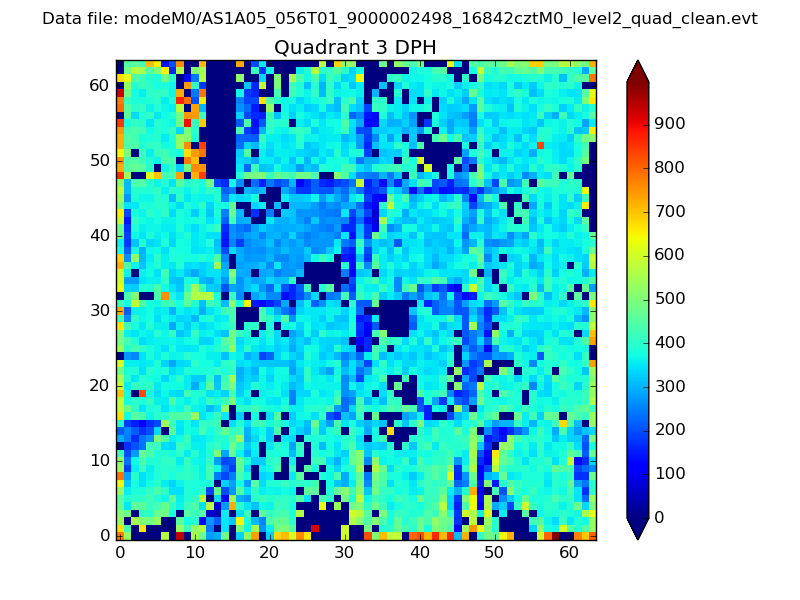 |
 |
Quadrant C |
| Plot type | Count rate plots | Images |
|---|---|---|
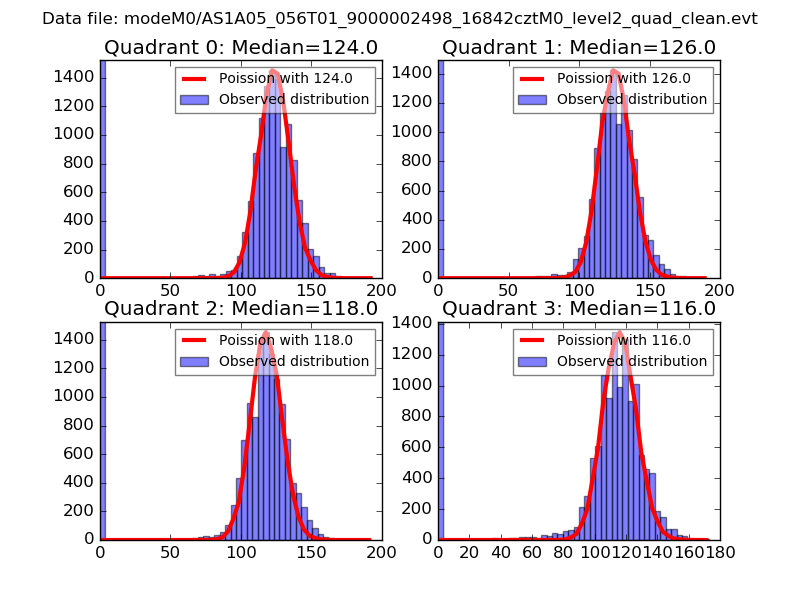
| Comparison with Poisson distribution Blue bars denote a histogram of data divided into 1 sec bins. Red curve is a Poisson curve with rate = median count rate of data. |
 |
 |
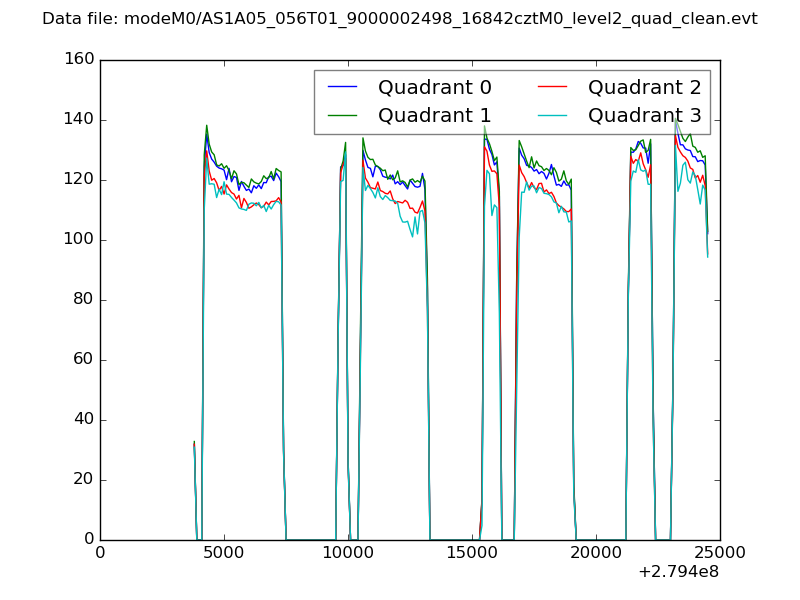
| Quadrant-wise count rates Data is divided into 100 sec bins |
 |
|
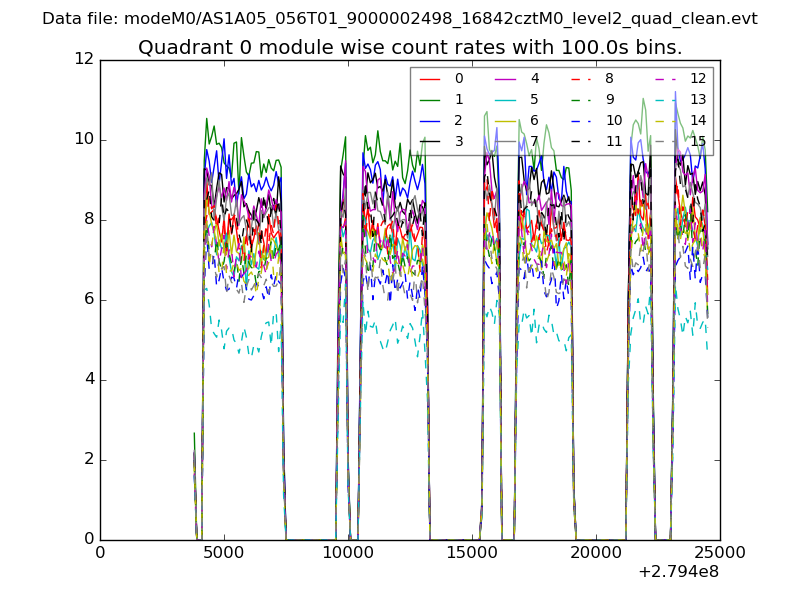
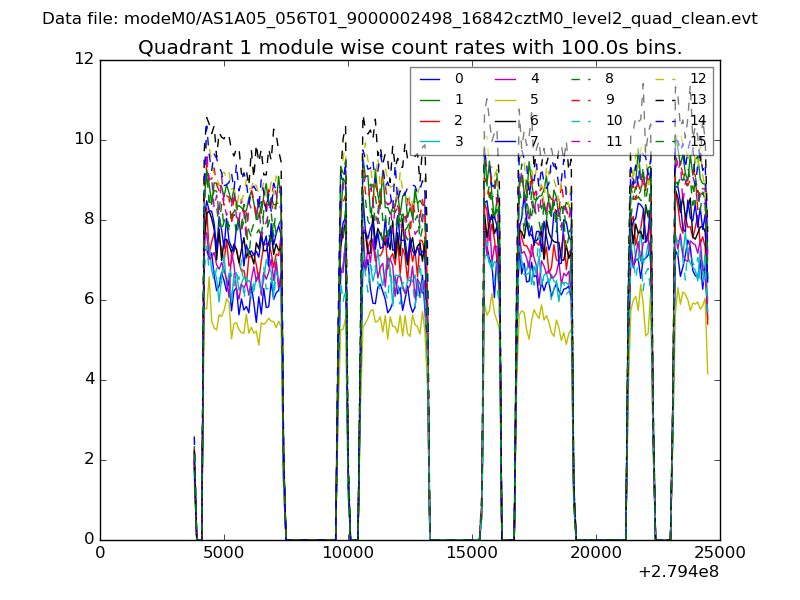
| Module-wise count rates for Quadrant A Data is divided into 100 sec bins |
 |
 |
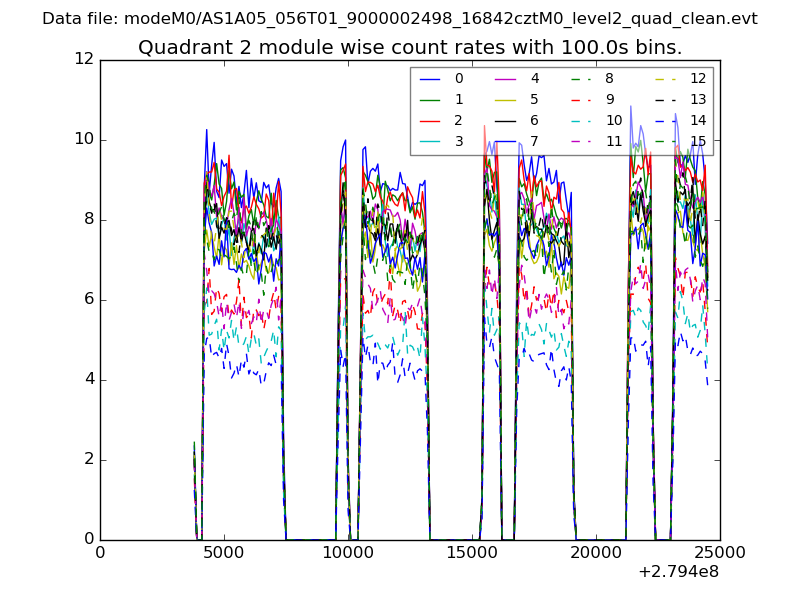
| Module-wise count rates for Quadrant B Data is divided into 100 sec bins |
 |
 |
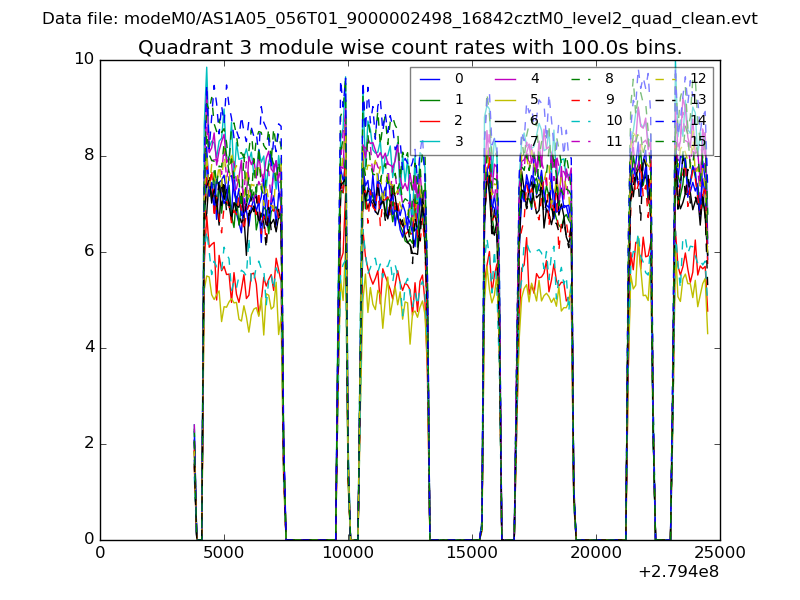
| Module-wise count rates for Quadrant C Data is divided into 100 sec bins |
 |
 |
| Module-wise count rates for Quadrant D Data is divided into 100 sec bins |
 |
 |
| Parameter | Plot |
|---|---|
| CZT HV Monitor | 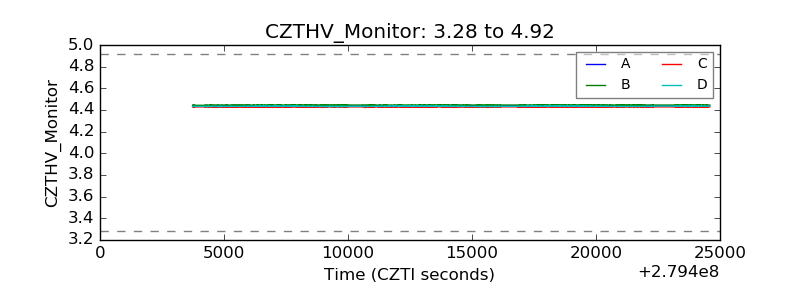 |
| D_VDD | 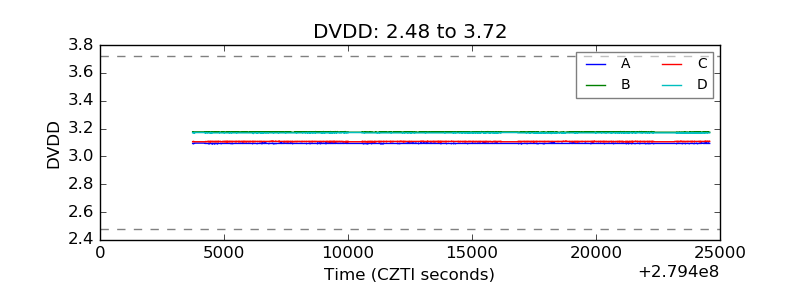 |
| Temperature 1 | 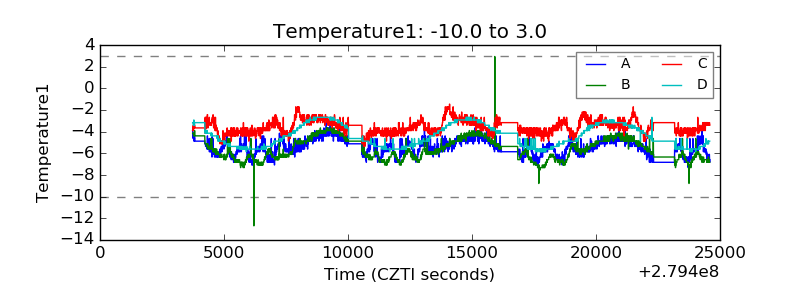 |
| Veto HV Monitor | 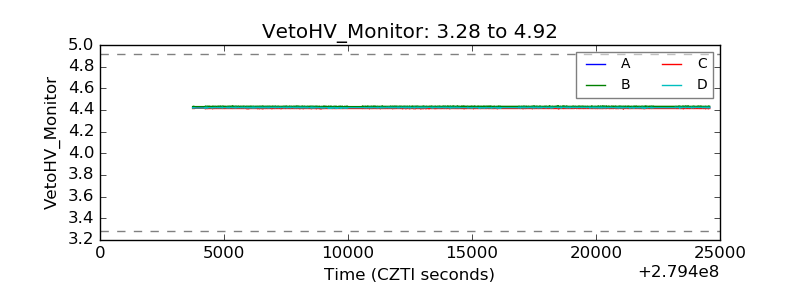 |
| Veto LLD | 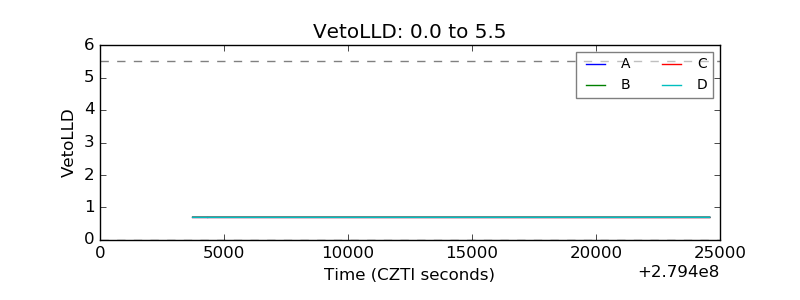 |
| Alpha Counter | 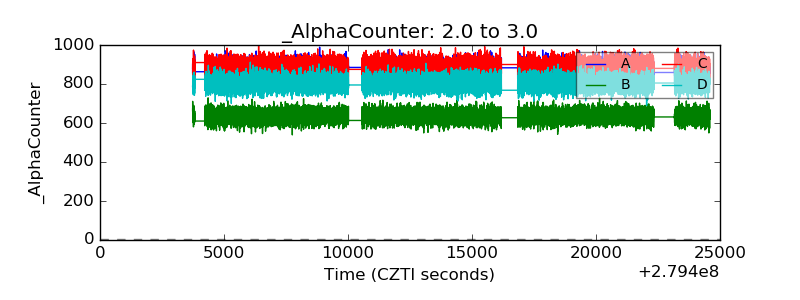 |
| _CPM_Rate | 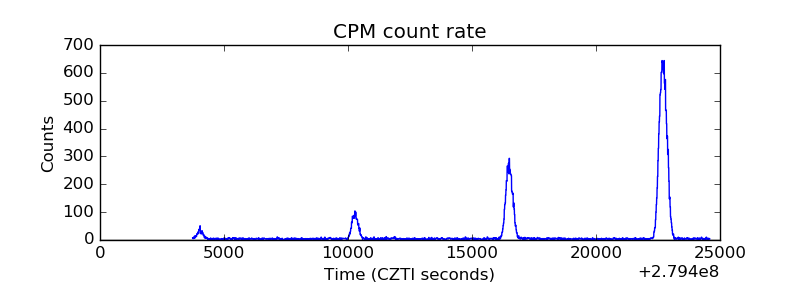 |
| CZT Counter | 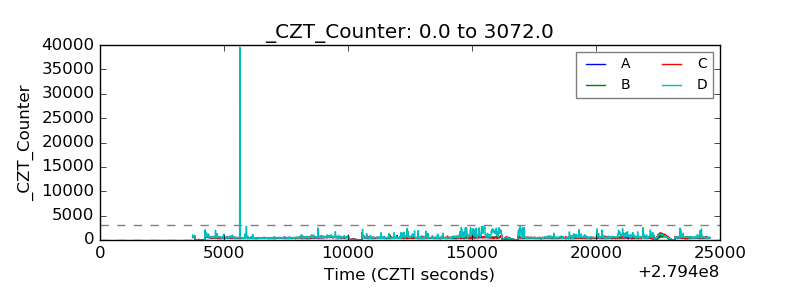 |
| +2.5 Volts monitor |  |
| +5 Volts monitor |  |
| _ROLL_ROT | 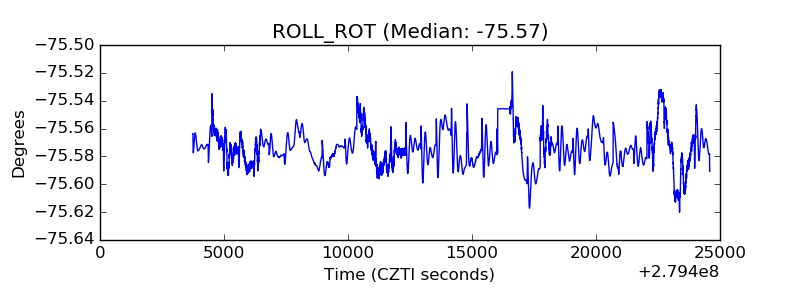 |
| _Roll_DEC | 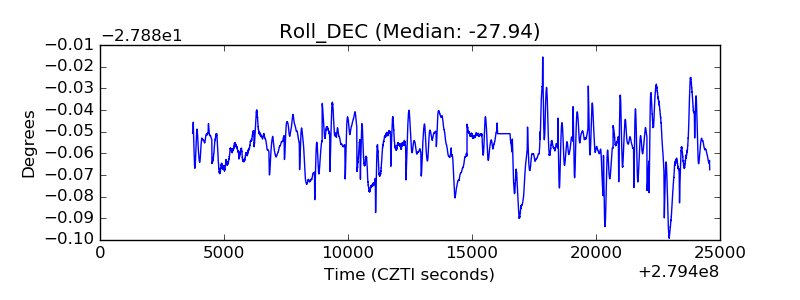 |
| _Roll_RA | 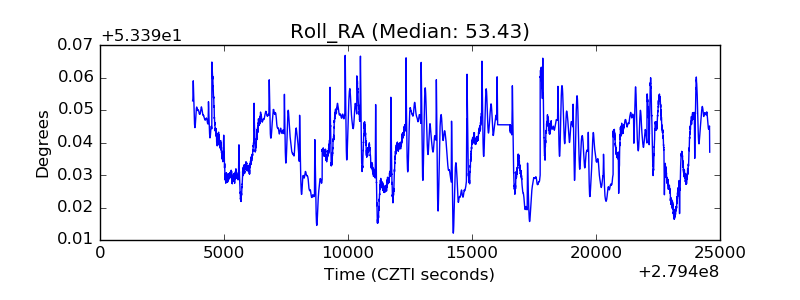 |
| Veto Counter | 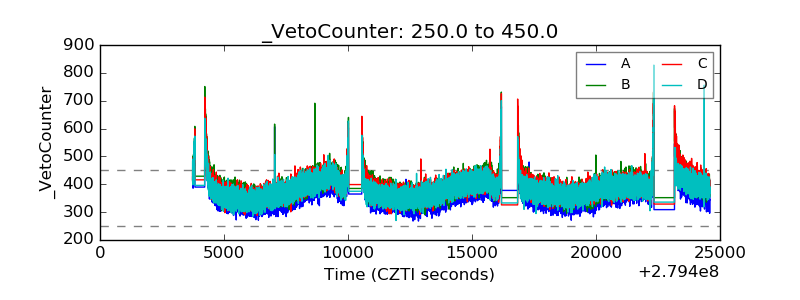 |