| Param | Original file | Final file |
|---|---|---|
| Filename | modeM0/AS1A05_056T01_9000002498_16845cztM0_level2.evt | modeM0/AS1A05_056T01_9000002498_16845cztM0_level2_quad_clean.evt |
| Size (bytes) | 469,342,080 | 86,385,600 |
| Size | 447.6 MB | 82.4 MB |
| Events in quadrant A | 3,119,069 | 549,824 |
| Events in quadrant B | 3,288,784 | 566,584 |
| Events in quadrant C | 3,412,489 | 533,795 |
| Events in quadrant D | 3,960,661 | 520,687 |
| Mode M9 | |||
|---|---|---|---|
| Quadrant | BADHDUFLAG | Total packets | Discarded packets |
| A | 0 | 11 | 0 |
| B | 0 | 11 | 0 |
| C | 0 | 11 | 0 |
| D | 0 | 11 | 0 |
| Mode SS | |||
|---|---|---|---|
| Quadrant | BADHDUFLAG | Total packets | Discarded packets |
| A | 0 | 130 | 0 |
| B | 0 | 130 | 0 |
| C | 0 | 130 | 0 |
| D | 0 | 130 | 0 |
| Mode M0 | |||
|---|---|---|---|
| Quadrant | BADHDUFLAG | Total packets | Discarded packets |
| A | 0 | 13230 | 3 |
| B | 0 | 13430 | 2 |
| C | 0 | 14204 | 2 |
| D | 0 | 15879 | 2 |
| Quadrant | Total seconds | Saturated seconds | Saturation percentage |
|---|---|---|---|
| A | 6376 | 39 | 0.611669% |
| B | 6376 | 44 | 0.690088% |
| C | 6376 | 104 | 1.631117% |
| D | 6376 | 145 | 2.274153% |
Noise dominated data is calculated using 1-second bins in cleaned event files. If a bin has >2000 counts, and if more than 50% of those come from <1% of pixels, then it is considered to be noise-dominated and hence unusable.
| Quadrant | # 1 sec bins | Bins with >0 counts | Bins with >2000 counts | High rate bins dominated by noise | Noise dominated (total time) | Noise dominated (detector-on time) | Marked lightcurve |
|---|---|---|---|---|---|---|---|
| A | 7457 | 6378 | 2 | 2 | 0.03% | 0.03% | 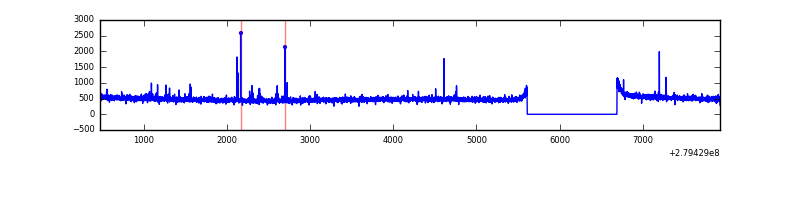 |
| B | 7457 | 6378 | 0 | 0 | 0.00% | 0.00% | 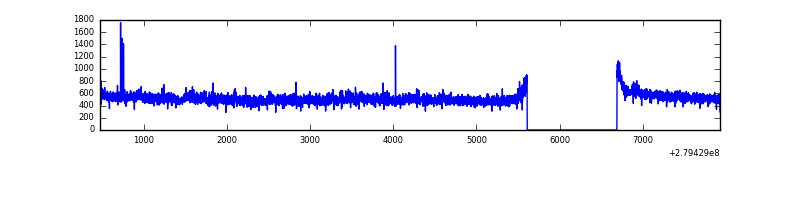 |
| C | 7457 | 6378 | 2 | 2 | 0.03% | 0.03% | 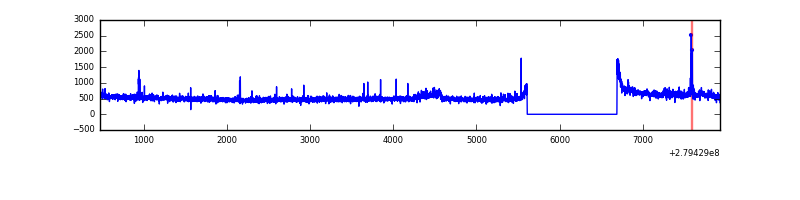 |
| D | 7457 | 6378 | 71 | 71 | 0.95% | 1.11% | 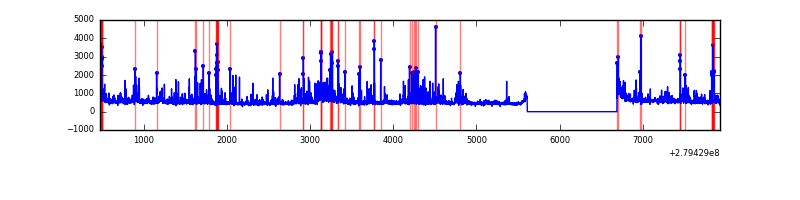 |
Top three noisy pixels from each quadrant. If the there are fewer than three noisy pixels in the level2.evt file, extra rows are filled as -1
| Pixel properties | Quadrant properties | ||||||
|---|---|---|---|---|---|---|---|
| Quadrant | DetID | PixID | Counts | Sigma | Mean | Median | Sigma |
| A | 9 | 143 | 45377 | 276.27 | 800 | 782 | 161.4 |
| A | 0 | 226 | 6789 | 37.21 | 800 | 782 | 161.4 |
| A | 3 | 137 | 5789 | 31.02 | 800 | 782 | 161.4 |
| B | 0 | 229 | 94696 | 620.96 | 799 | 779 | 151.2 |
| B | 3 | 64 | 28501 | 183.29 | 799 | 779 | 151.2 |
| B | 0 | 214 | 28076 | 180.48 | 799 | 779 | 151.2 |
| C | 3 | 233 | 159927 | 875.63 | 779 | 785 | 181.7 |
| C | 14 | 238 | 118664 | 648.59 | 779 | 785 | 181.7 |
| C | 0 | 207 | 75210 | 409.5 | 779 | 785 | 181.7 |
| D | 1 | 52 | 736896 | 3912.3 | 780 | 757 | 188.2 |
| D | 5 | 222 | 232618 | 1232.25 | 780 | 757 | 188.2 |
| D | 15 | 145 | 22935 | 117.87 | 780 | 757 | 188.2 |
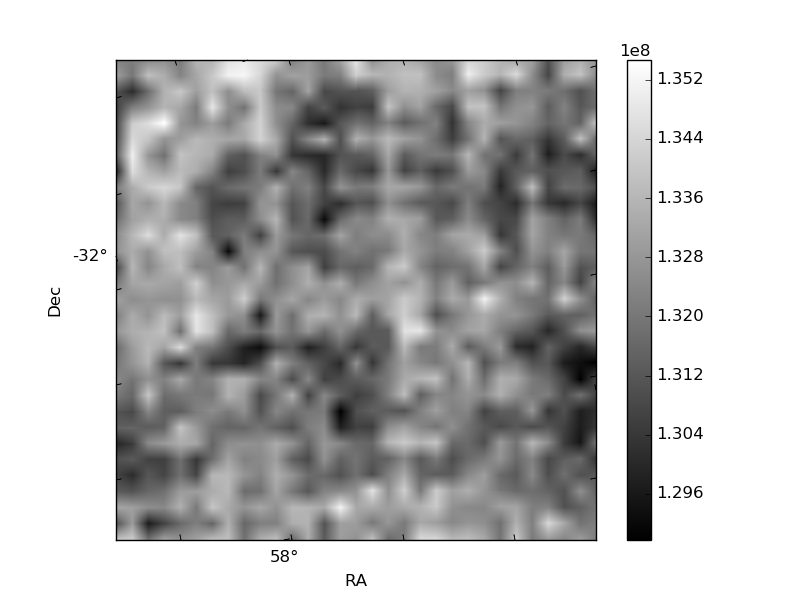
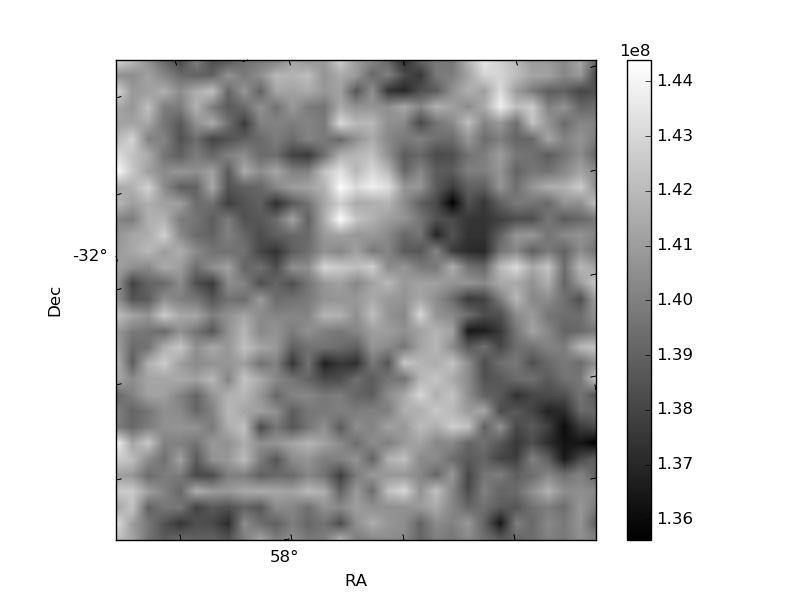
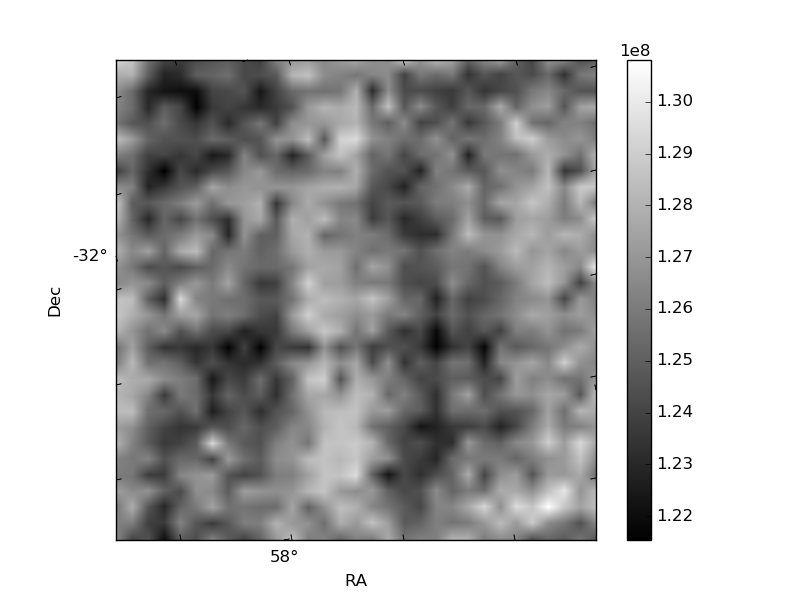
Histogram calculated using DETX and DETY for each event in the final _common_clean file
| Quadrant A | 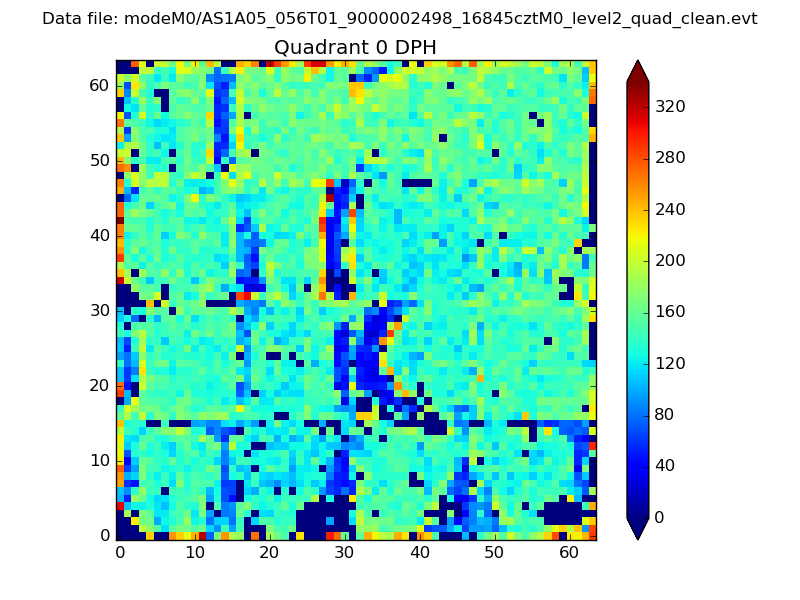 |
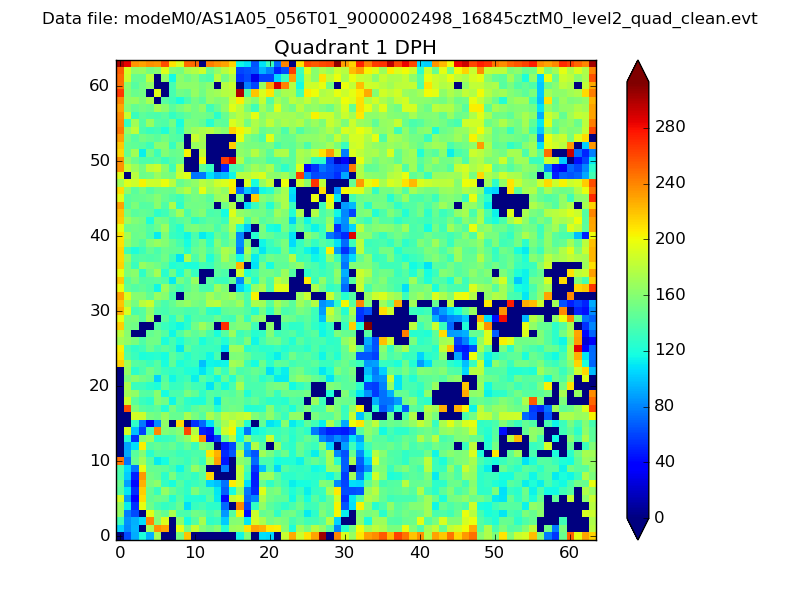 |
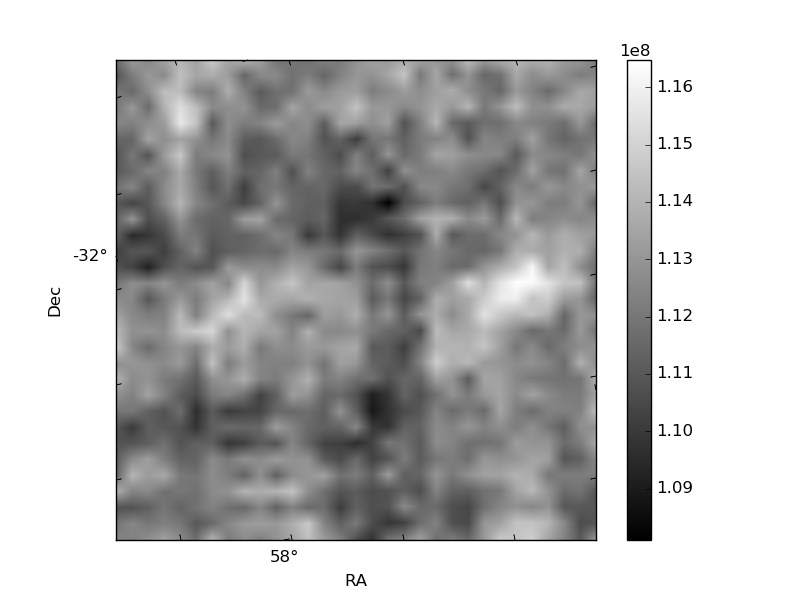
Quadrant B |
|---|---|---|---|
| Quadrant D | 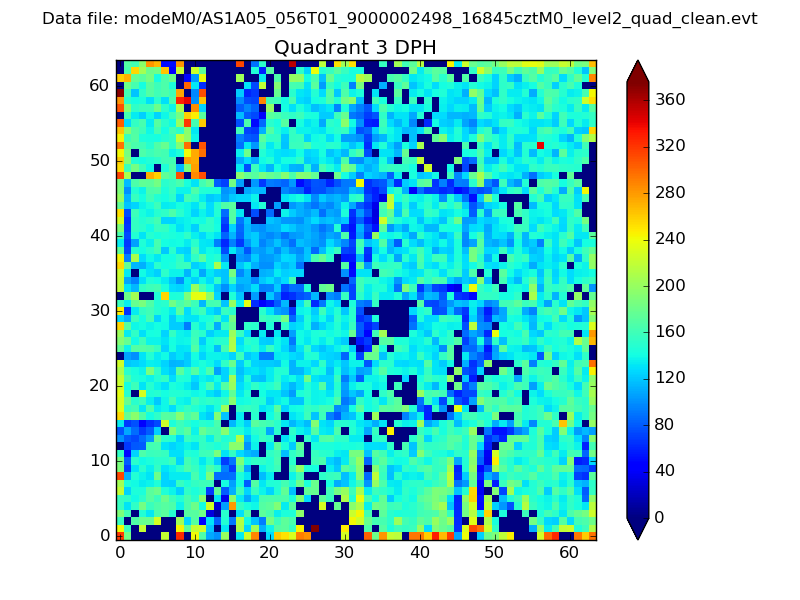 |
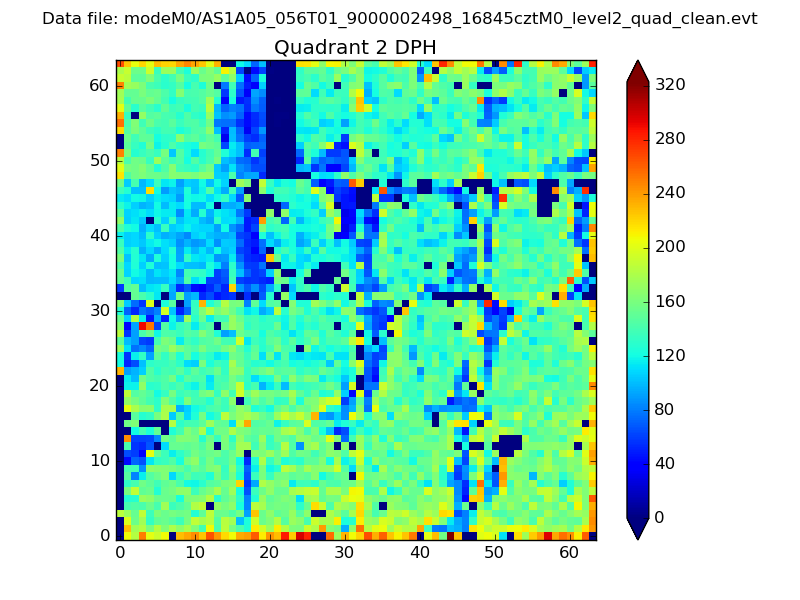 |
Quadrant C |
| Plot type | Count rate plots | Images |
|---|---|---|
| Comparison with Poisson distribution Blue bars denote a histogram of data divided into 1 sec bins. Red curve is a Poisson curve with rate = median count rate of data. |
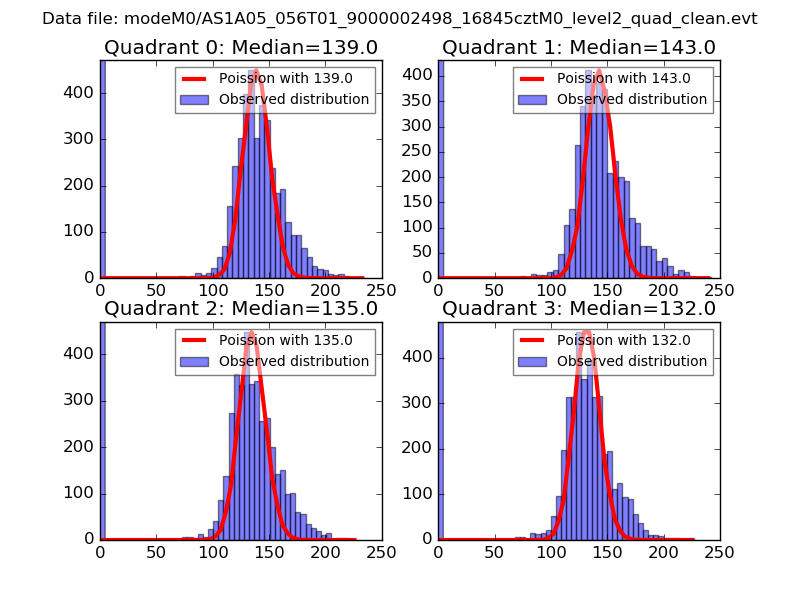 |
 |
| Quadrant-wise count rates Data is divided into 100 sec bins |
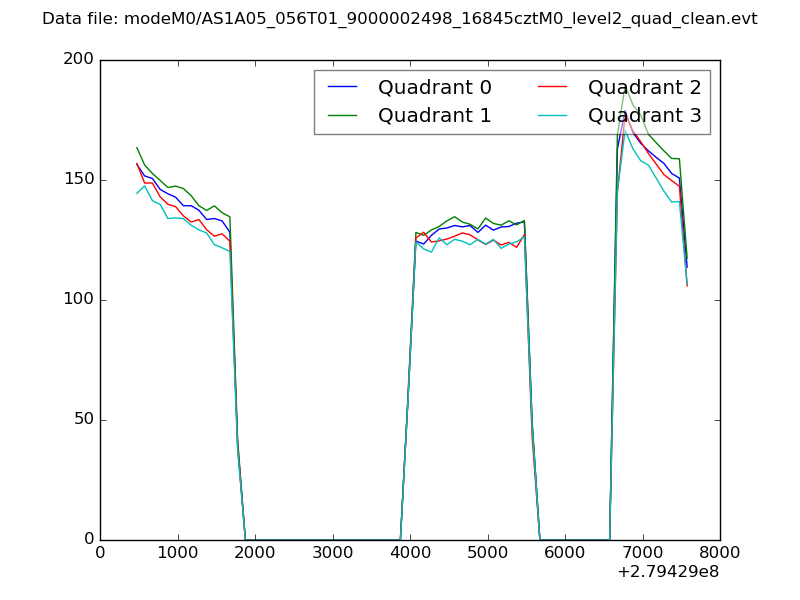 |
|
| Module-wise count rates for Quadrant A Data is divided into 100 sec bins |
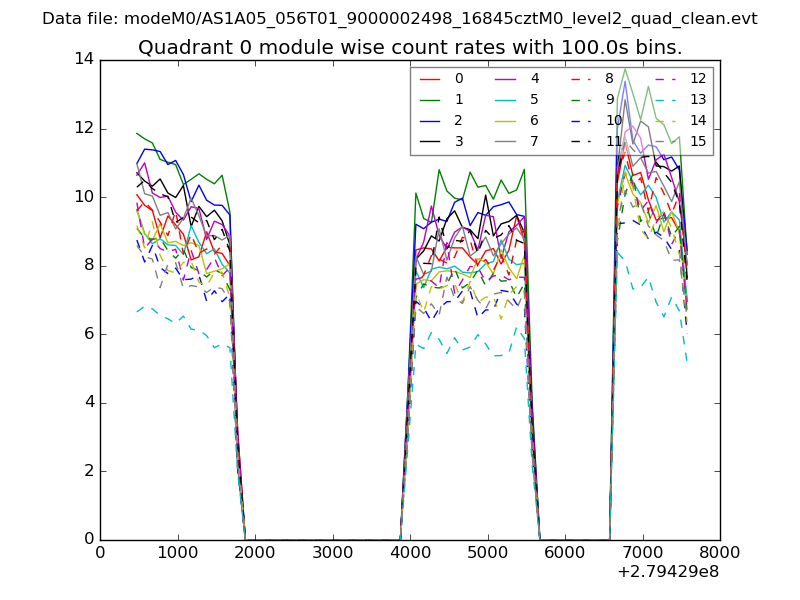 |
 |
| Module-wise count rates for Quadrant B Data is divided into 100 sec bins |
 |
 |
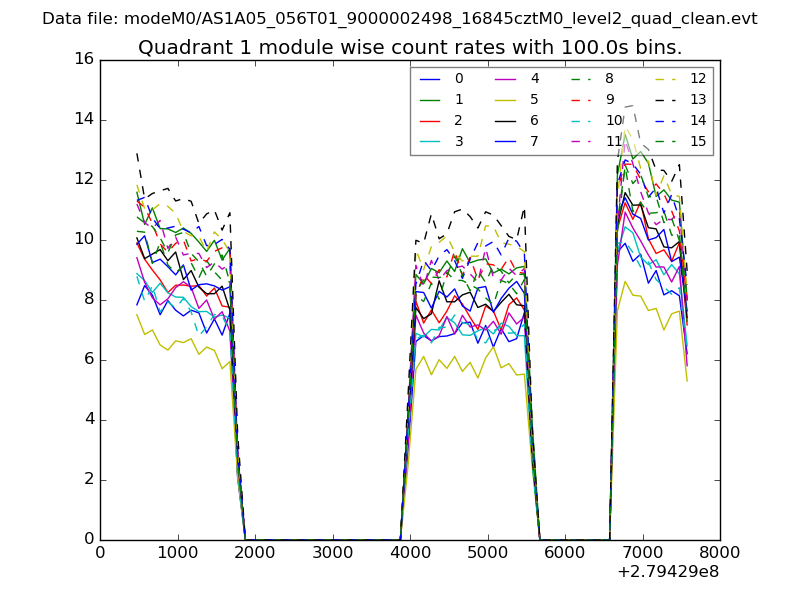
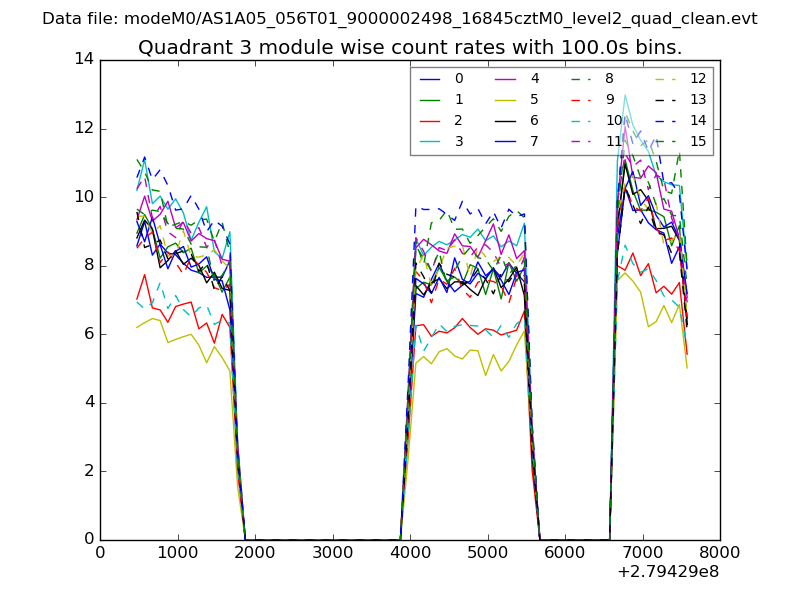
| Module-wise count rates for Quadrant C Data is divided into 100 sec bins |
 |
 |
| Module-wise count rates for Quadrant D Data is divided into 100 sec bins |
 |
 |
| Parameter | Plot |
|---|---|
| CZT HV Monitor | 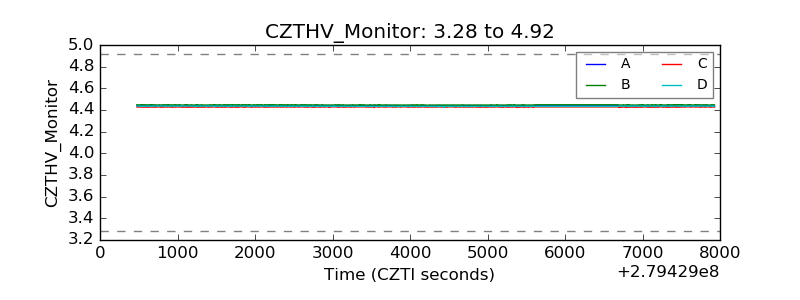 |
| D_VDD | 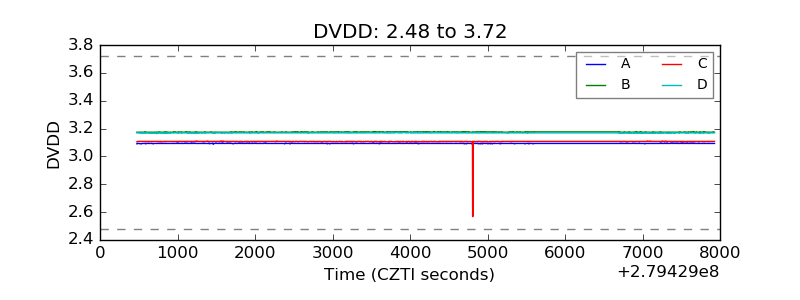 |
| Temperature 1 | 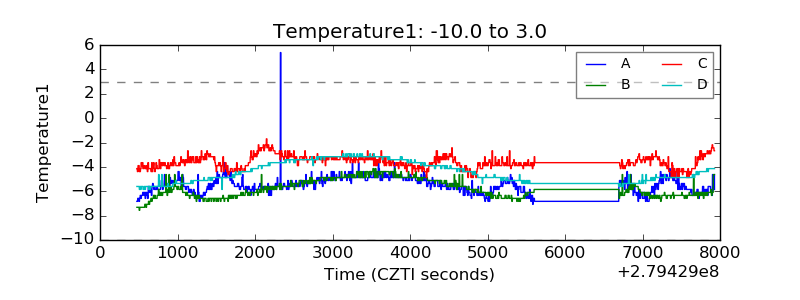 |
| Veto HV Monitor | 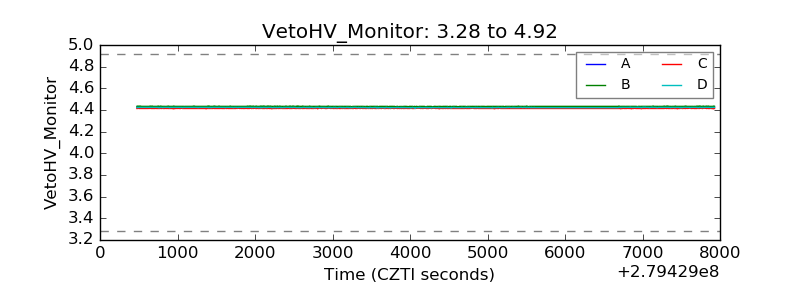 |
| Veto LLD | 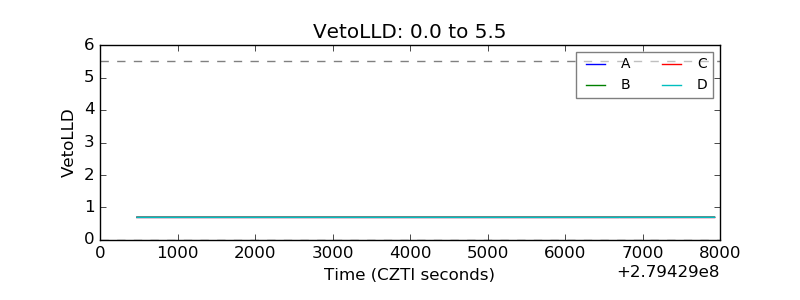 |
| Alpha Counter | 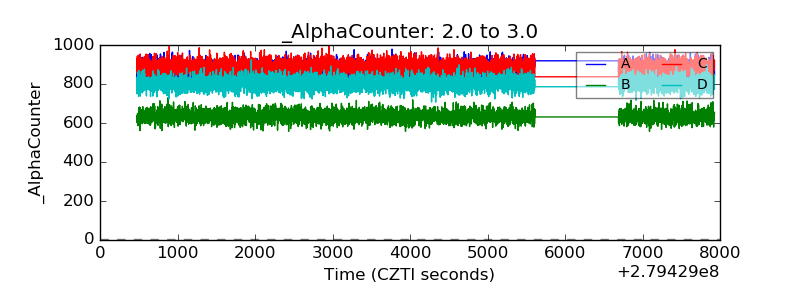 |
| _CPM_Rate | 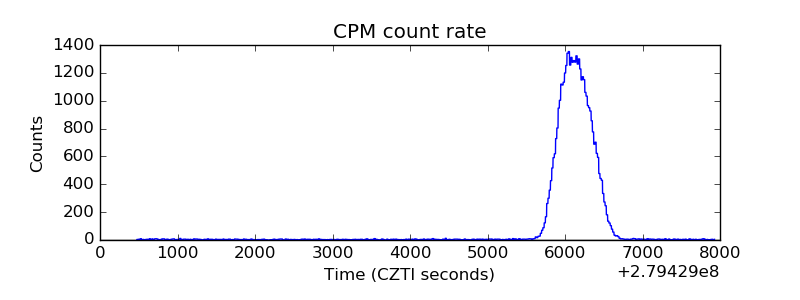 |
| CZT Counter | 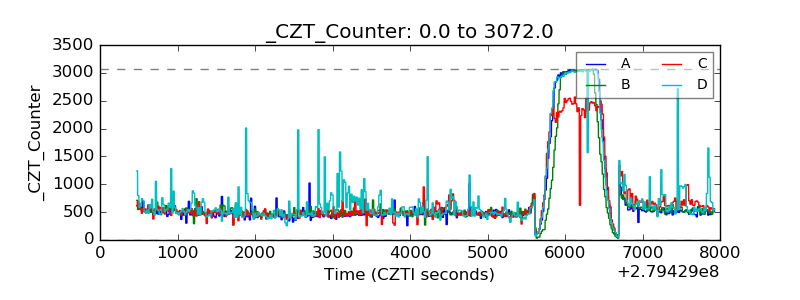 |
| +2.5 Volts monitor |  |
| +5 Volts monitor | 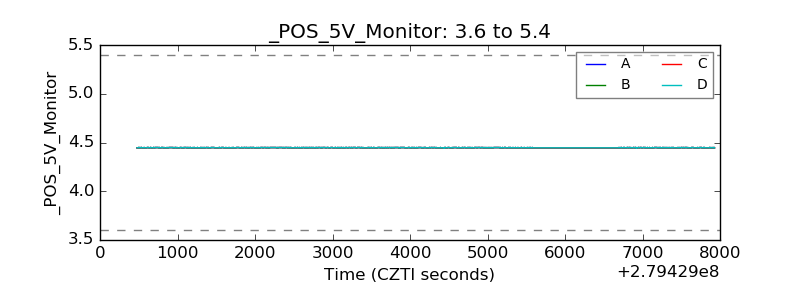 |
| _ROLL_ROT | 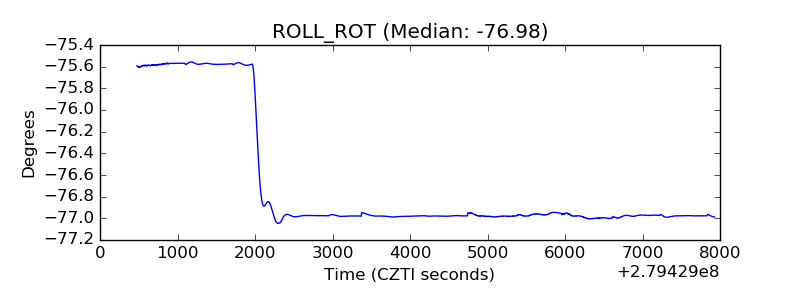 |
| _Roll_DEC | 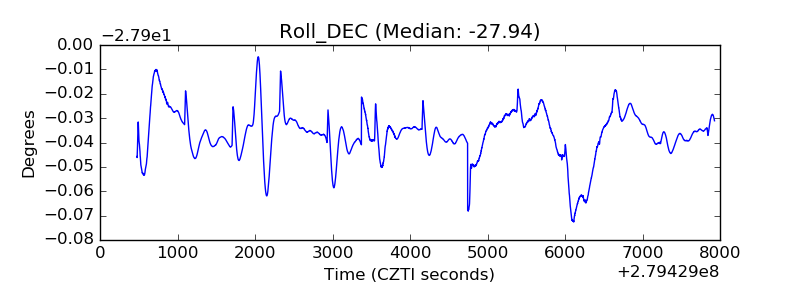 |
| _Roll_RA |  |
| Veto Counter | 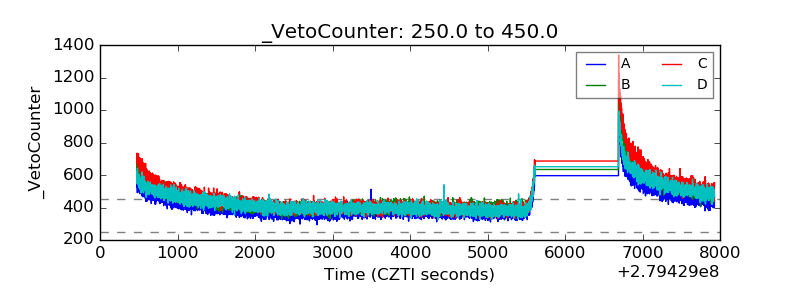 |