| Param | Original file | Final file |
|---|---|---|
| Filename | modeM0/AS1A05_056T01_9000002498_16846cztM0_level2.evt | modeM0/AS1A05_056T01_9000002498_16846cztM0_level2_quad_clean.evt |
| Size (bytes) | 493,686,720 | 81,357,120 |
| Size | 470.8 MB | 77.6 MB |
| Events in quadrant A | 3,232,336 | 512,403 |
| Events in quadrant B | 3,432,264 | 528,202 |
| Events in quadrant C | 3,776,444 | 497,482 |
| Events in quadrant D | 4,081,436 | 484,389 |
| Mode M9 | |||
|---|---|---|---|
| Quadrant | BADHDUFLAG | Total packets | Discarded packets |
| A | 0 | 17 | 0 |
| B | 0 | 17 | 0 |
| C | 0 | 17 | 0 |
| D | 0 | 18 | 0 |
| Mode SS | |||
|---|---|---|---|
| Quadrant | BADHDUFLAG | Total packets | Discarded packets |
| A | 0 | 128 | 0 |
| B | 0 | 128 | 0 |
| C | 0 | 128 | 0 |
| D | 0 | 128 | 0 |
| Mode M0 | |||
|---|---|---|---|
| Quadrant | BADHDUFLAG | Total packets | Discarded packets |
| A | 0 | 13552 | 3 |
| B | 0 | 14026 | 2 |
| C | 0 | 15344 | 2 |
| D | 0 | 16257 | 2 |
| Quadrant | Total seconds | Saturated seconds | Saturation percentage |
|---|---|---|---|
| A | 6321 | 76 | 1.202341% |
| B | 6321 | 92 | 1.455466% |
| C | 6321 | 156 | 2.467964% |
| D | 6321 | 175 | 2.768549% |
Noise dominated data is calculated using 1-second bins in cleaned event files. If a bin has >2000 counts, and if more than 50% of those come from <1% of pixels, then it is considered to be noise-dominated and hence unusable.
| Quadrant | # 1 sec bins | Bins with >0 counts | Bins with >2000 counts | High rate bins dominated by noise | Noise dominated (total time) | Noise dominated (detector-on time) | Marked lightcurve |
|---|---|---|---|---|---|---|---|
| A | 7497 | 6323 | 1 | 1 | 0.01% | 0.02% | 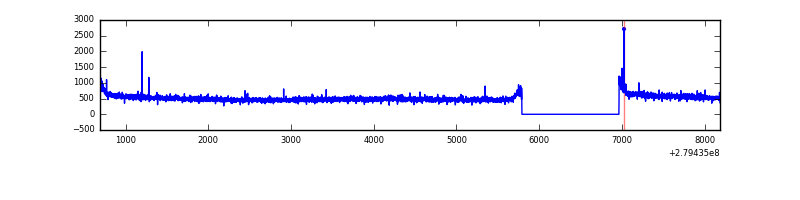 |
| B | 7497 | 6323 | 1 | 1 | 0.01% | 0.02% | 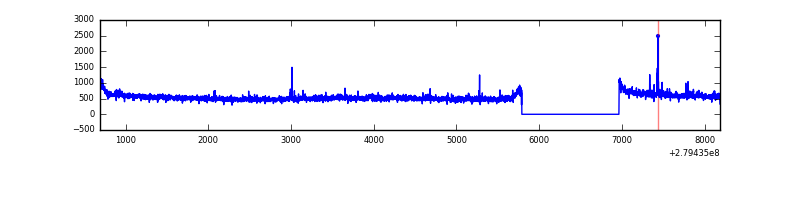 |
| C | 7497 | 6323 | 2 | 2 | 0.03% | 0.03% | 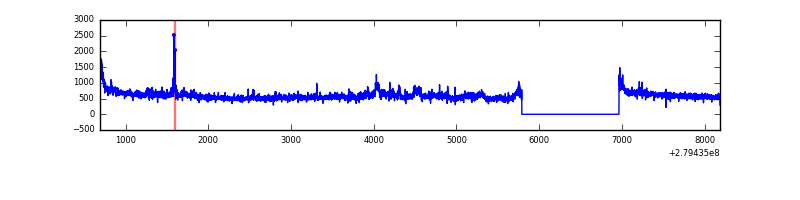 |
| D | 7497 | 6323 | 95 | 95 | 1.27% | 1.50% | 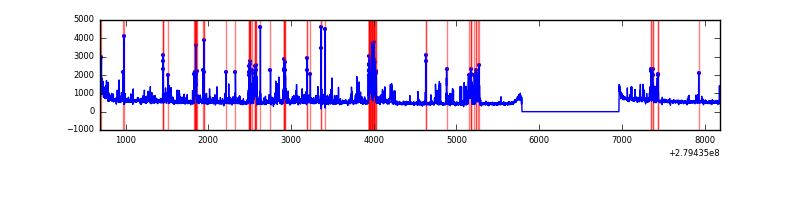 |
Top three noisy pixels from each quadrant. If the there are fewer than three noisy pixels in the level2.evt file, extra rows are filled as -1
| Pixel properties | Quadrant properties | ||||||
|---|---|---|---|---|---|---|---|
| Quadrant | DetID | PixID | Counts | Sigma | Mean | Median | Sigma |
| A | 9 | 143 | 18037 | 103.57 | 834 | 819 | 166.2 |
| A | 13 | 228 | 8472 | 46.03 | 834 | 819 | 166.2 |
| A | 0 | 226 | 7241 | 38.63 | 834 | 819 | 166.2 |
| B | 3 | 64 | 89488 | 567.18 | 836 | 816 | 156.3 |
| B | 0 | 229 | 49276 | 309.97 | 836 | 816 | 156.3 |
| B | 10 | 16 | 25820 | 159.93 | 836 | 816 | 156.3 |
| C | 3 | 233 | 389686 | 2038.76 | 816 | 826 | 190.7 |
| C | 14 | 238 | 124762 | 649.79 | 816 | 826 | 190.7 |
| C | 0 | 207 | 69260 | 358.79 | 816 | 826 | 190.7 |
| D | 1 | 52 | 788735 | 3980.99 | 818 | 797 | 197.9 |
| D | 5 | 222 | 151853 | 763.2 | 818 | 797 | 197.9 |
| D | 2 | 234 | 22602 | 110.17 | 818 | 797 | 197.9 |
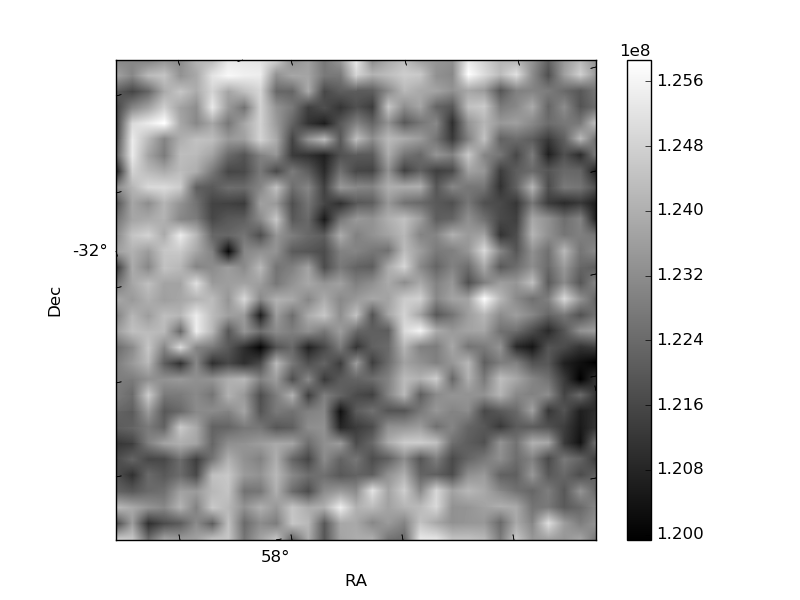
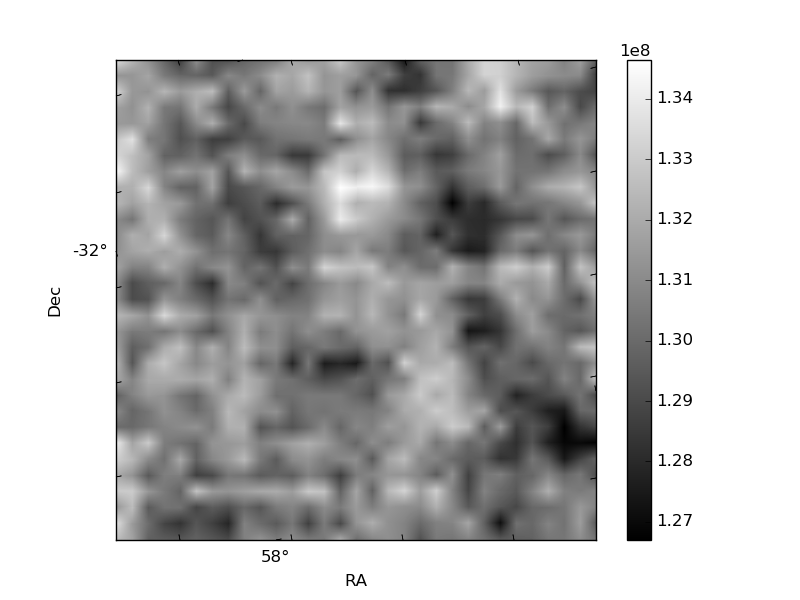
Histogram calculated using DETX and DETY for each event in the final _common_clean file
| Quadrant A | 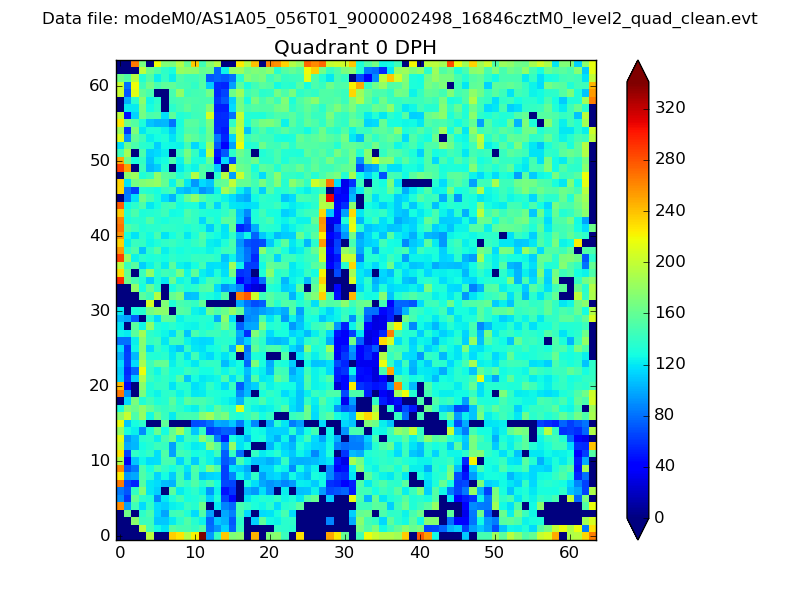 |
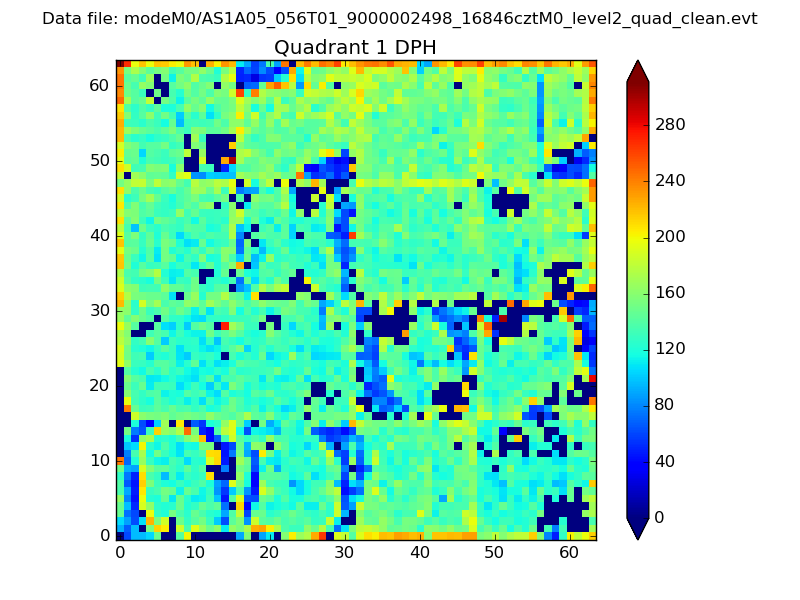 |
Quadrant B |
|---|---|---|---|
| Quadrant D |  |
 |
Quadrant C |
| Plot type | Count rate plots | Images |
|---|---|---|
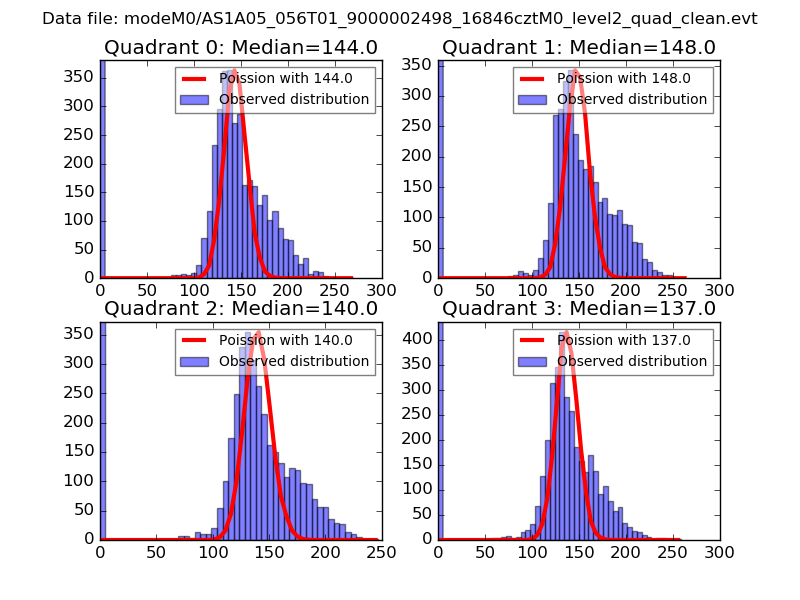
| Comparison with Poisson distribution Blue bars denote a histogram of data divided into 1 sec bins. Red curve is a Poisson curve with rate = median count rate of data. |
 |
 |
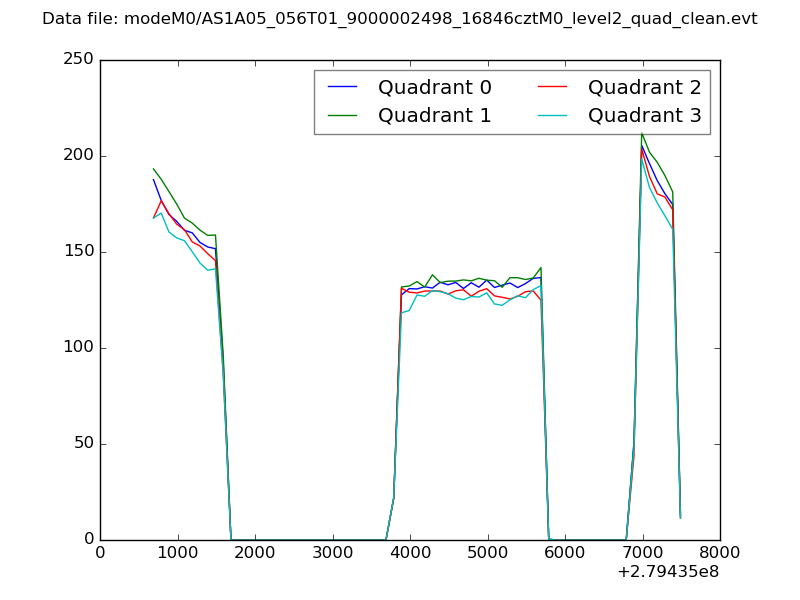
| Quadrant-wise count rates Data is divided into 100 sec bins |
 |
|
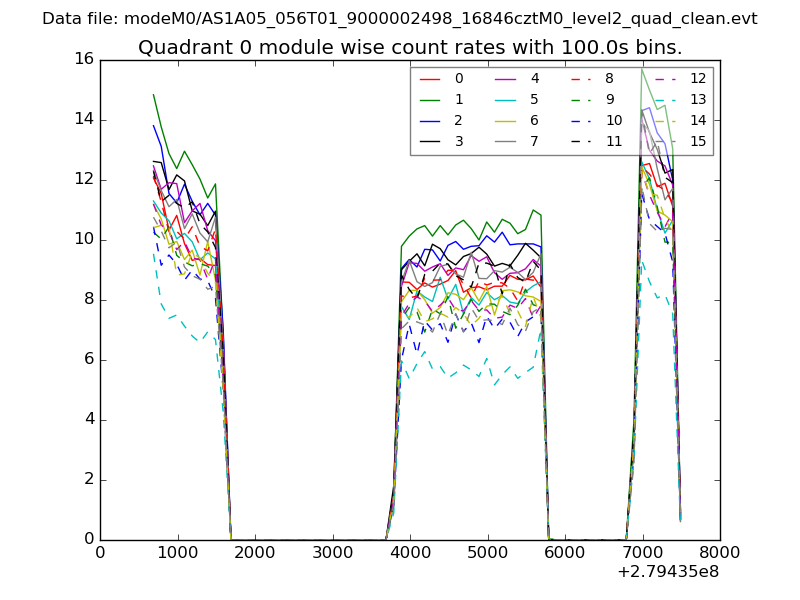
| Module-wise count rates for Quadrant A Data is divided into 100 sec bins |
 |
 |
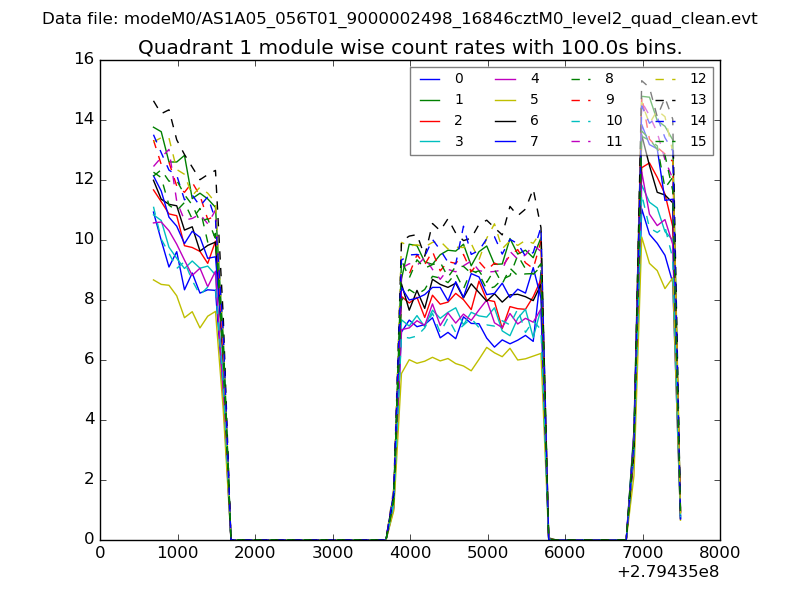
| Module-wise count rates for Quadrant B Data is divided into 100 sec bins |
 |
 |
| Module-wise count rates for Quadrant C Data is divided into 100 sec bins |
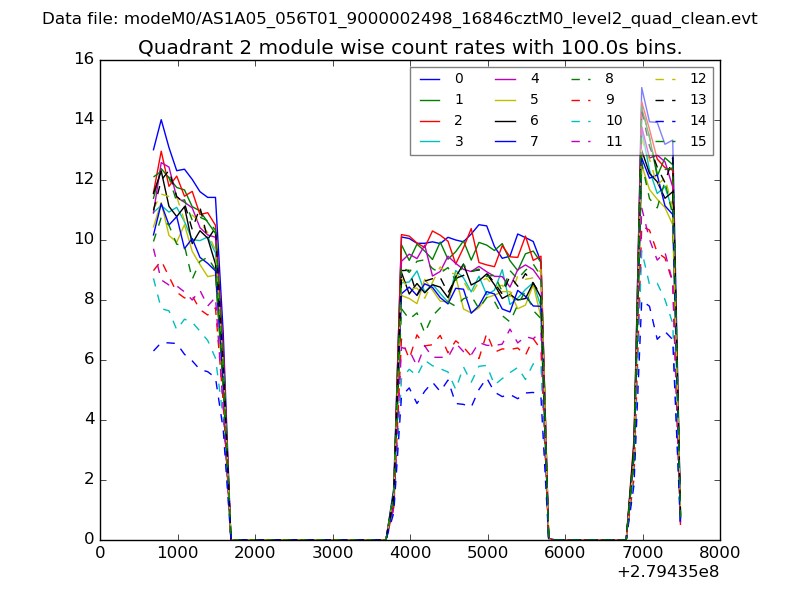 |
 |
| Module-wise count rates for Quadrant D Data is divided into 100 sec bins |
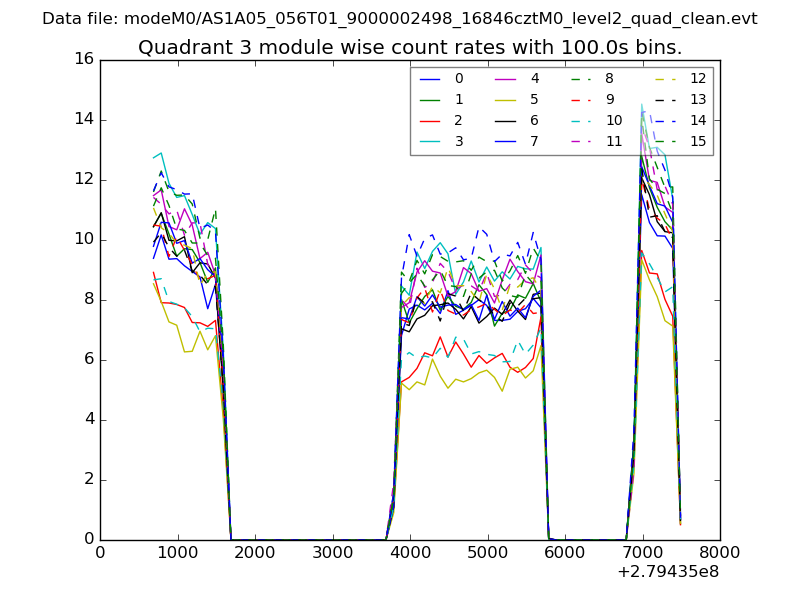 |
 |
| Parameter | Plot |
|---|---|
| CZT HV Monitor |  |
| D_VDD | 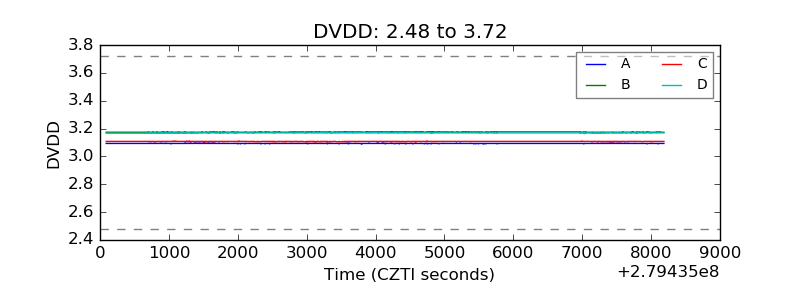 |
| Temperature 1 | 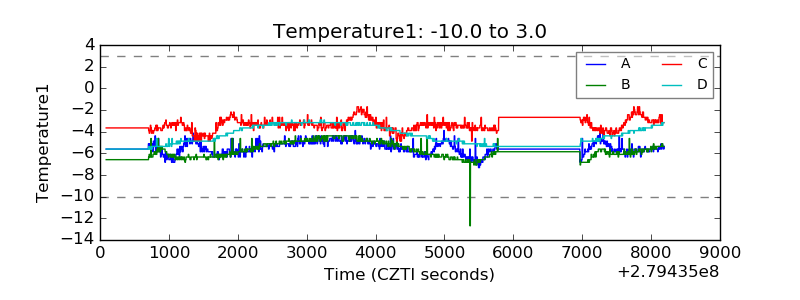 |
| Veto HV Monitor | 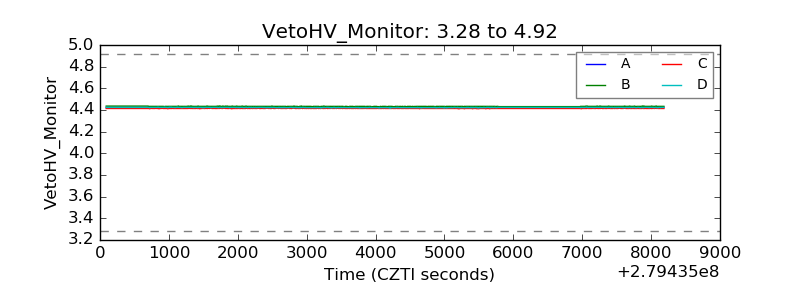 |
| Veto LLD | 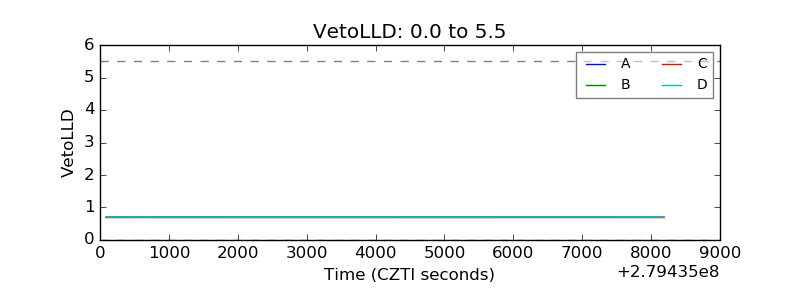 |
| Alpha Counter | 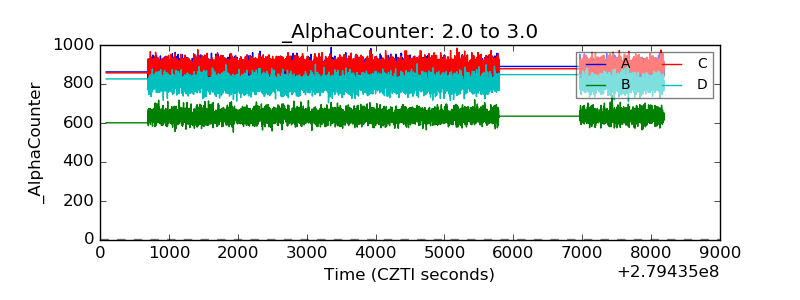 |
| _CPM_Rate | 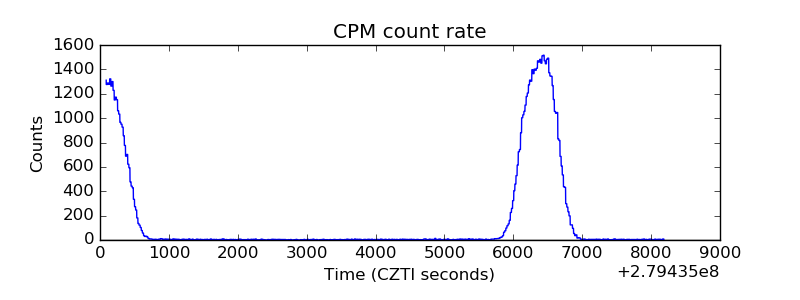 |
| CZT Counter |  |
| +2.5 Volts monitor |  |
| +5 Volts monitor | 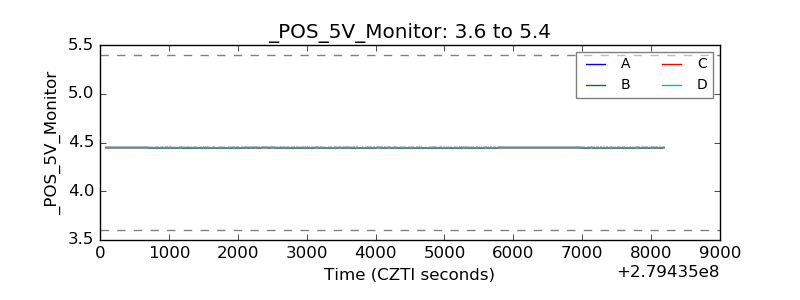 |
| _ROLL_ROT | 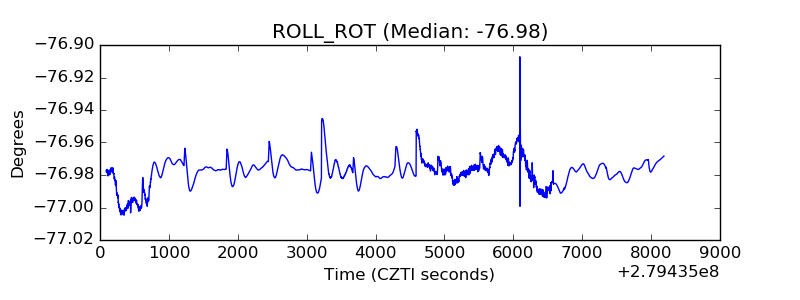 |
| _Roll_DEC | 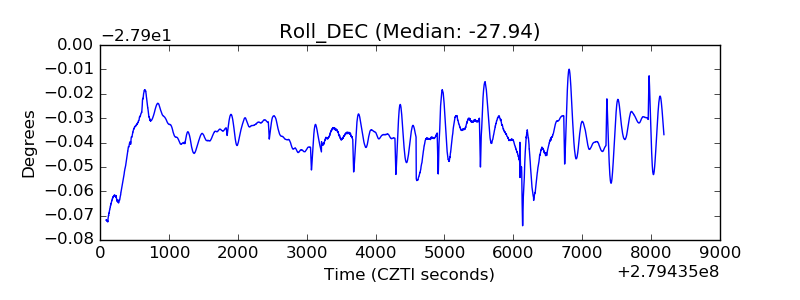 |
| _Roll_RA | 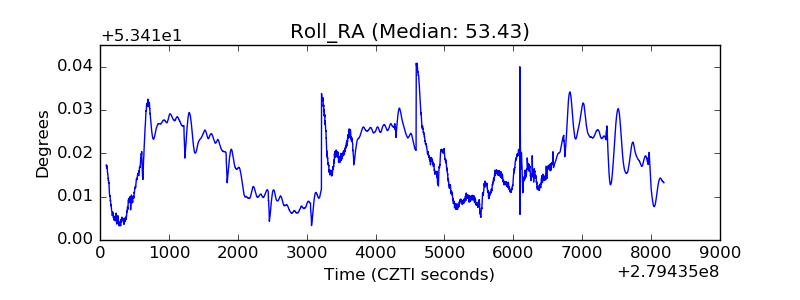 |
| Veto Counter | 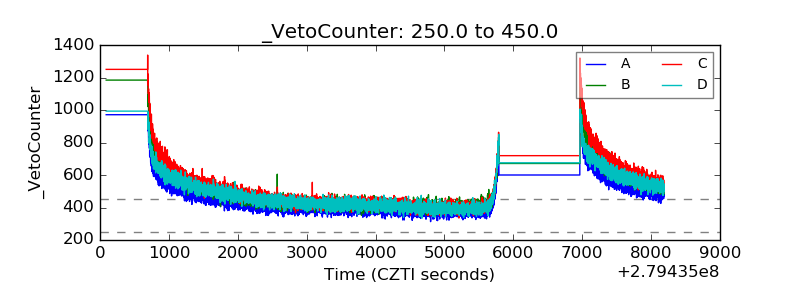 |