| Param | Original file | Final file |
|---|---|---|
| Filename | modeM0/AS1A05_056T01_9000002498_16848cztM0_level2.evt | modeM0/AS1A05_056T01_9000002498_16848cztM0_level2_quad_clean.evt |
| Size (bytes) | 502,254,720 | 66,185,280 |
| Size | 479.0 MB | 63.1 MB |
| Events in quadrant A | 3,397,347 | 397,106 |
| Events in quadrant B | 3,612,188 | 405,524 |
| Events in quadrant C | 3,425,285 | 387,889 |
| Events in quadrant D | 4,353,480 | 378,799 |
| Mode M9 | |||
|---|---|---|---|
| Quadrant | BADHDUFLAG | Total packets | Discarded packets |
| A | 0 | 21 | 0 |
| B | 0 | 21 | 0 |
| C | 0 | 21 | 0 |
| D | 0 | 22 | 0 |
| Mode SS | |||
|---|---|---|---|
| Quadrant | BADHDUFLAG | Total packets | Discarded packets |
| A | 0 | 128 | 0 |
| B | 0 | 128 | 0 |
| C | 0 | 128 | 0 |
| D | 0 | 128 | 0 |
| Mode M0 | |||
|---|---|---|---|
| Quadrant | BADHDUFLAG | Total packets | Discarded packets |
| A | 0 | 13834 | 3 |
| B | 0 | 14440 | 2 |
| C | 0 | 14067 | 2 |
| D | 0 | 17078 | 2 |
| Quadrant | Total seconds | Saturated seconds | Saturation percentage |
|---|---|---|---|
| A | 6220 | 120 | 1.929260% |
| B | 6220 | 168 | 2.700965% |
| C | 6220 | 175 | 2.813505% |
| D | 6220 | 335 | 5.385852% |
Noise dominated data is calculated using 1-second bins in cleaned event files. If a bin has >2000 counts, and if more than 50% of those come from <1% of pixels, then it is considered to be noise-dominated and hence unusable.
| Quadrant | # 1 sec bins | Bins with >0 counts | Bins with >2000 counts | High rate bins dominated by noise | Noise dominated (total time) | Noise dominated (detector-on time) | Marked lightcurve |
|---|---|---|---|---|---|---|---|
| A | 7496 | 6222 | 0 | 0 | 0.00% | 0.00% | 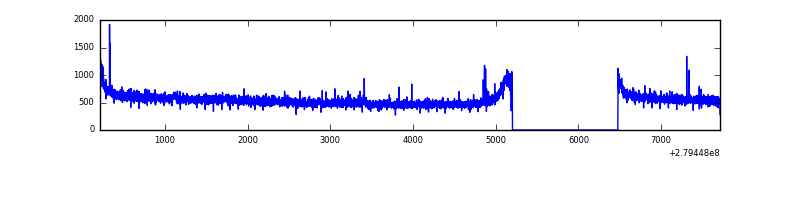 |
| B | 7496 | 6222 | 19 | 19 | 0.25% | 0.31% | 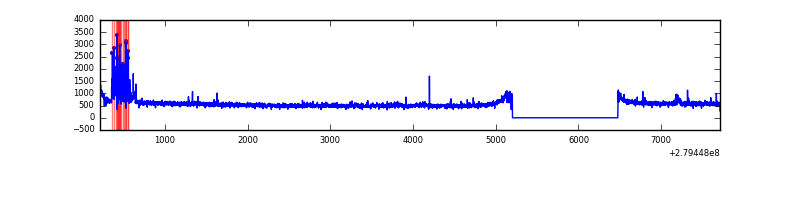 |
| C | 7496 | 6222 | 0 | 0 | 0.00% | 0.00% | 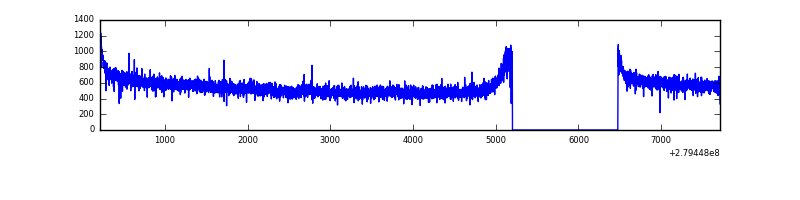 |
| D | 7496 | 6222 | 175 | 175 | 2.33% | 2.81% | 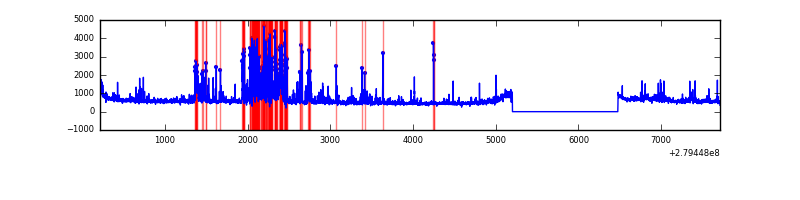 |
Top three noisy pixels from each quadrant. If the there are fewer than three noisy pixels in the level2.evt file, extra rows are filled as -1
| Pixel properties | Quadrant properties | ||||||
|---|---|---|---|---|---|---|---|
| Quadrant | DetID | PixID | Counts | Sigma | Mean | Median | Sigma |
| A | 13 | 228 | 58185 | 334.71 | 864 | 847 | 171.3 |
| A | 9 | 143 | 21054 | 117.96 | 864 | 847 | 171.3 |
| A | 0 | 226 | 7490 | 38.78 | 864 | 847 | 171.3 |
| B | 10 | 16 | 167427 | 1040.78 | 860 | 840 | 160.1 |
| B | 0 | 229 | 60418 | 372.22 | 860 | 840 | 160.1 |
| B | 12 | 111 | 19009 | 113.51 | 860 | 840 | 160.1 |
| C | 14 | 238 | 130530 | 676.22 | 838 | 846 | 191.8 |
| C | 3 | 233 | 24347 | 122.54 | 838 | 846 | 191.8 |
| C | 13 | 61 | 5738 | 25.51 | 838 | 846 | 191.8 |
| D | 1 | 52 | 1018244 | 5089.5 | 833 | 811 | 199.9 |
| D | 5 | 222 | 137305 | 682.78 | 833 | 811 | 199.9 |
| D | 15 | 145 | 22112 | 106.55 | 833 | 811 | 199.9 |
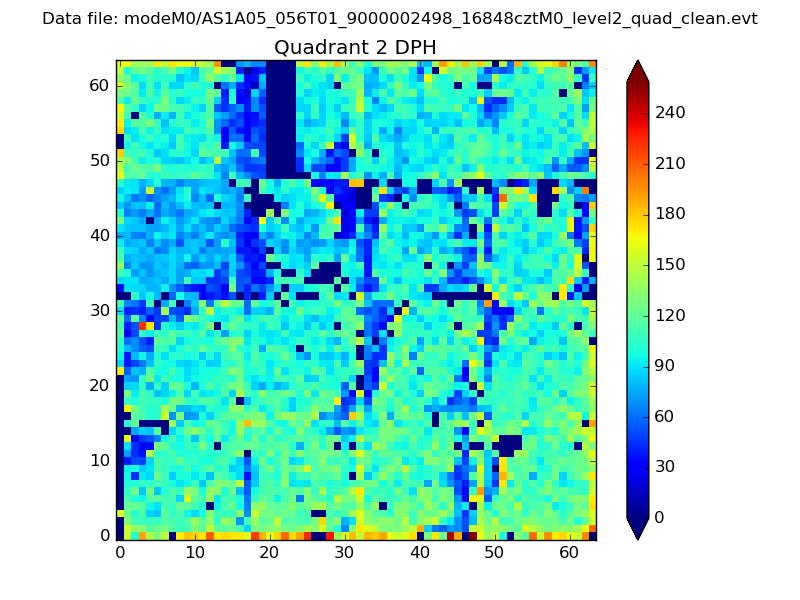
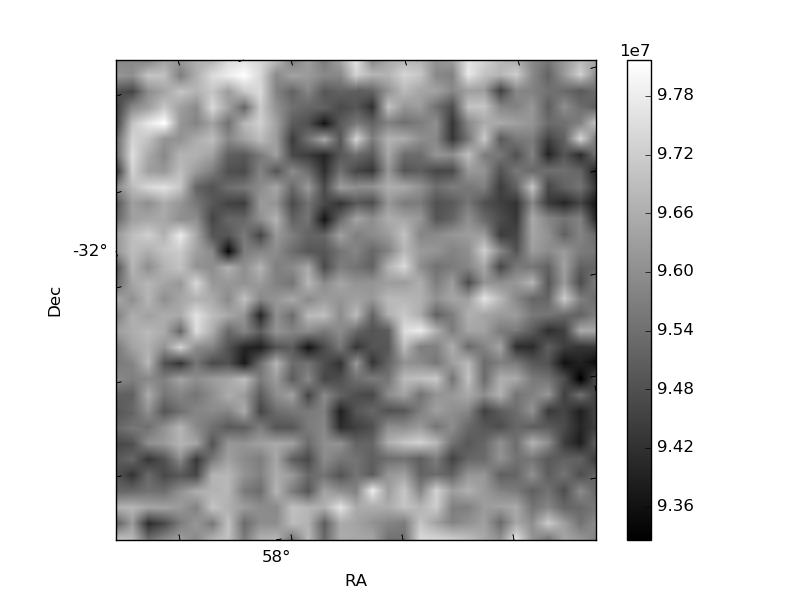
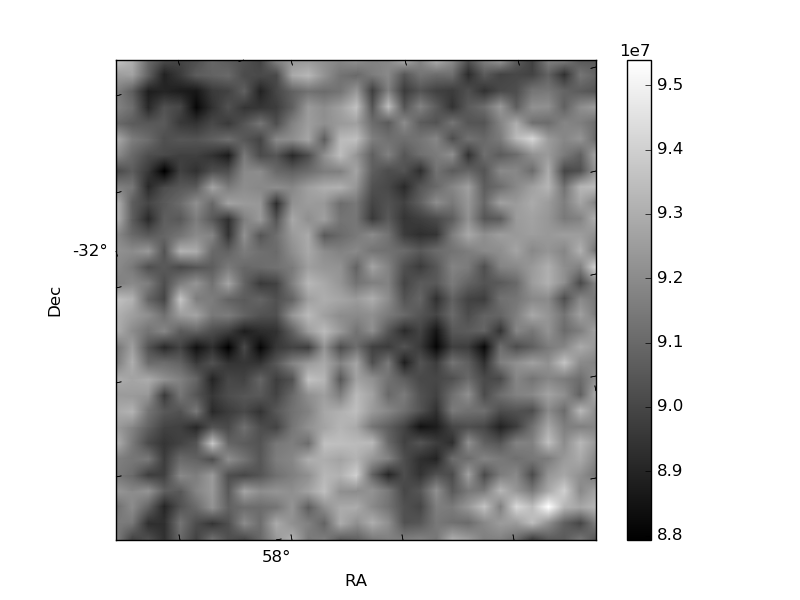
Histogram calculated using DETX and DETY for each event in the final _common_clean file
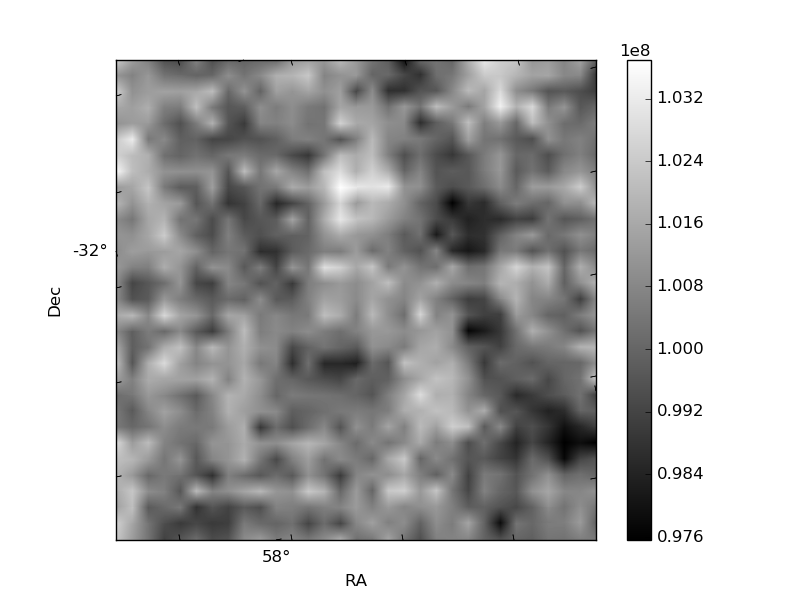
| Quadrant A | 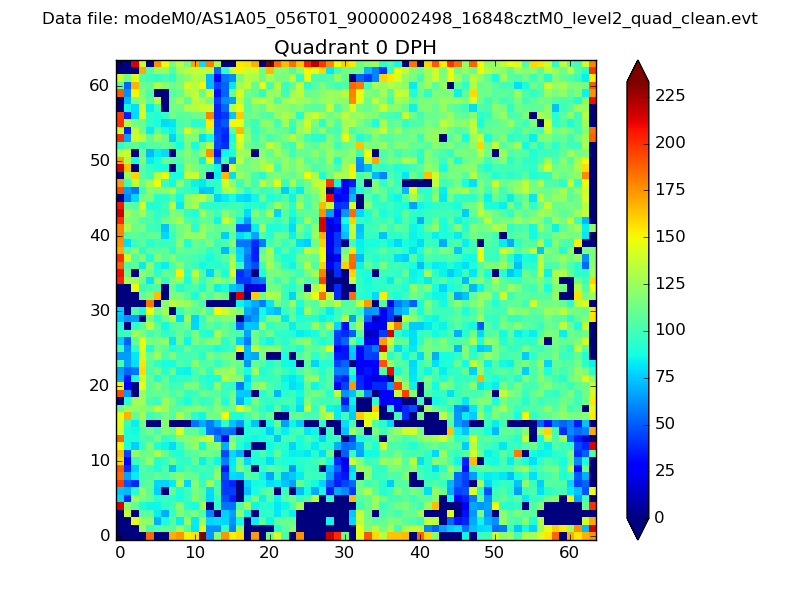 |
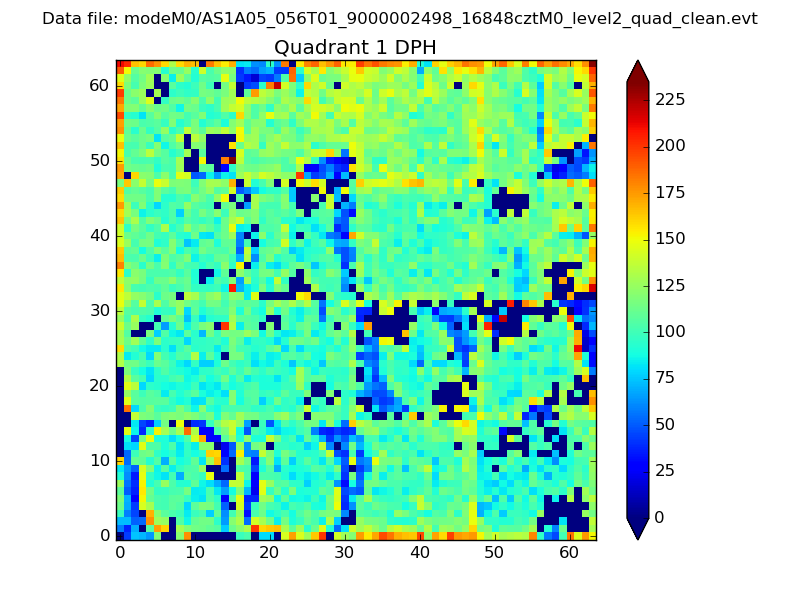 |
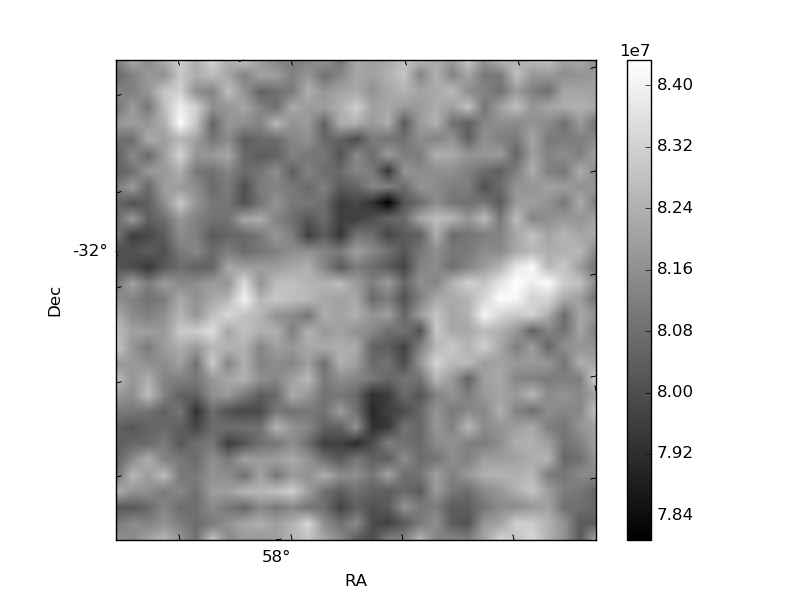
Quadrant B |
|---|---|---|---|
| Quadrant D | 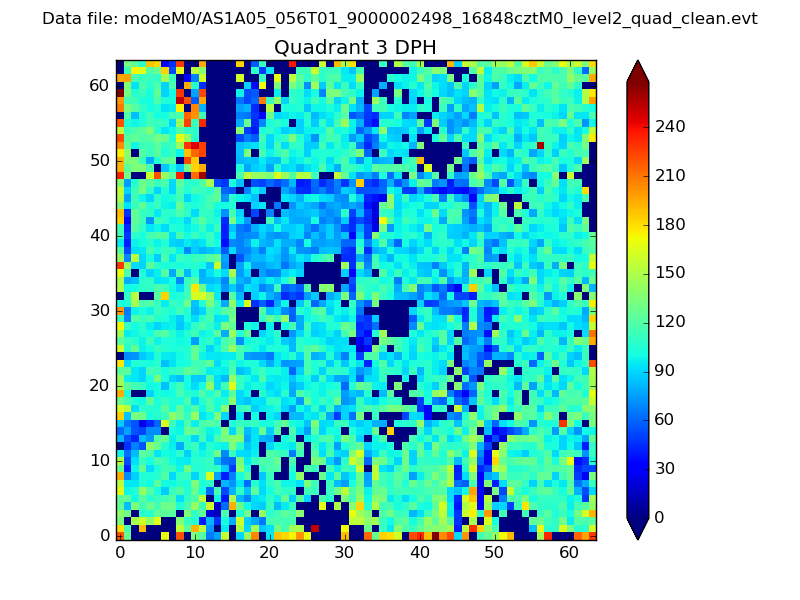 |
 |
Quadrant C |
| Plot type | Count rate plots | Images |
|---|---|---|
| Comparison with Poisson distribution Blue bars denote a histogram of data divided into 1 sec bins. Red curve is a Poisson curve with rate = median count rate of data. |
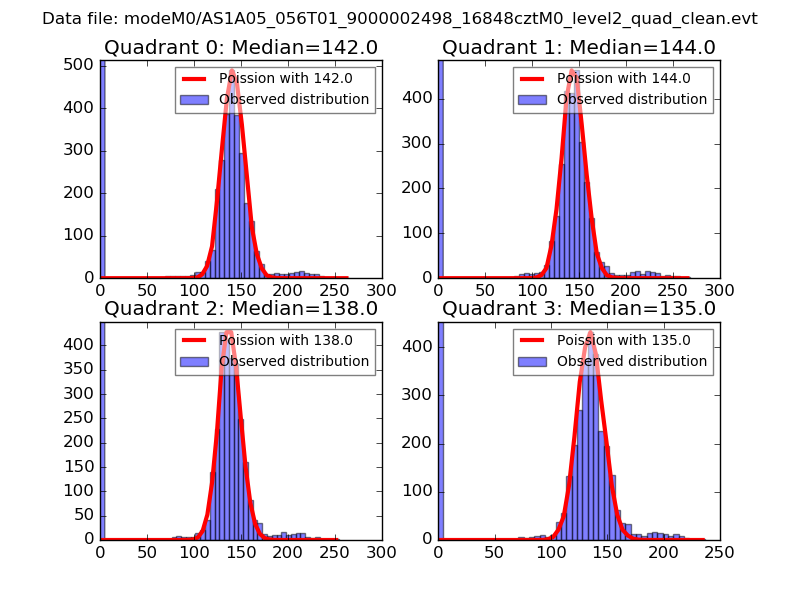 |
 |
| Quadrant-wise count rates Data is divided into 100 sec bins |
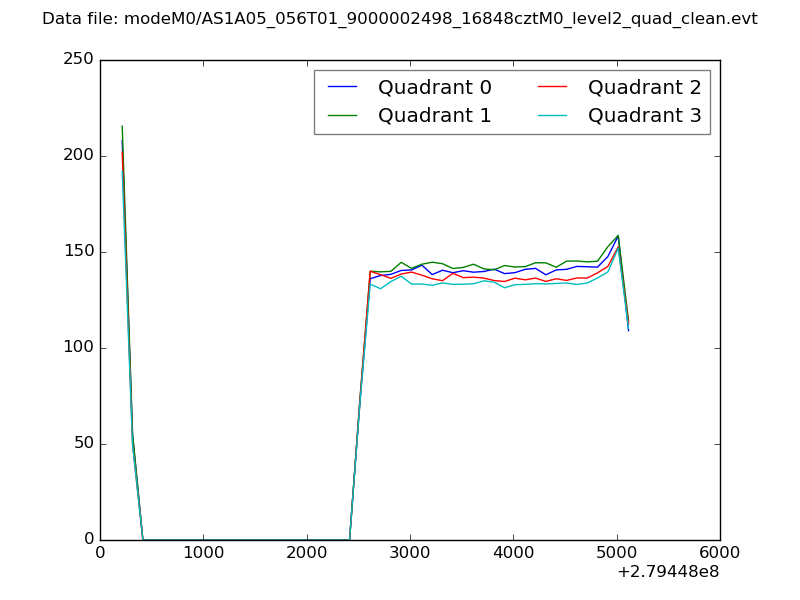 |
|
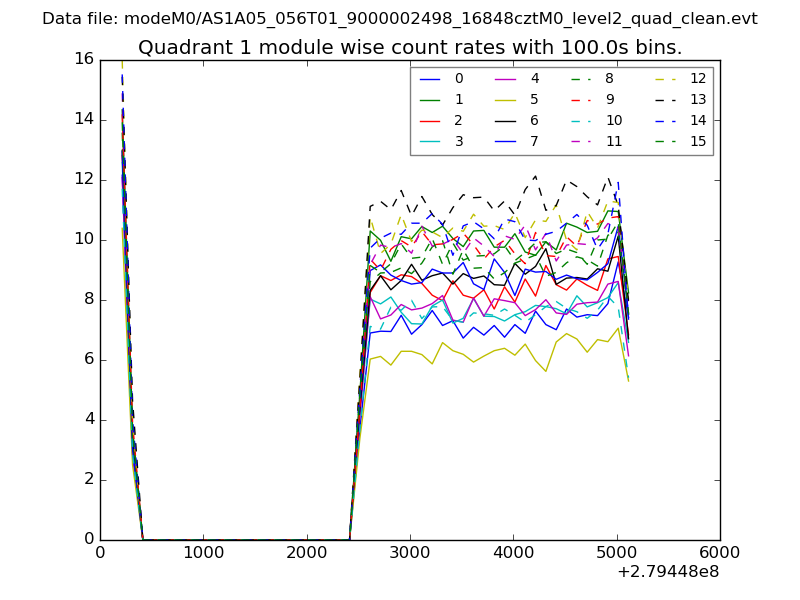
| Module-wise count rates for Quadrant A Data is divided into 100 sec bins |
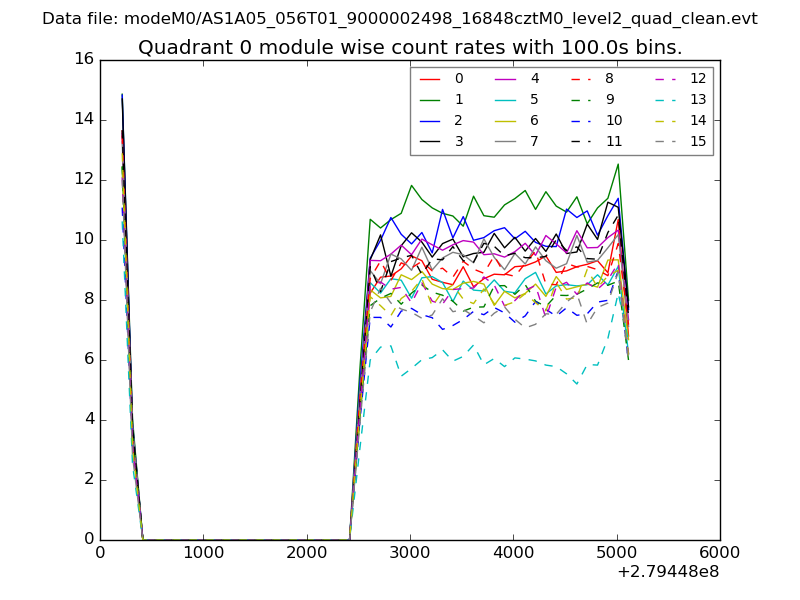 |
 |
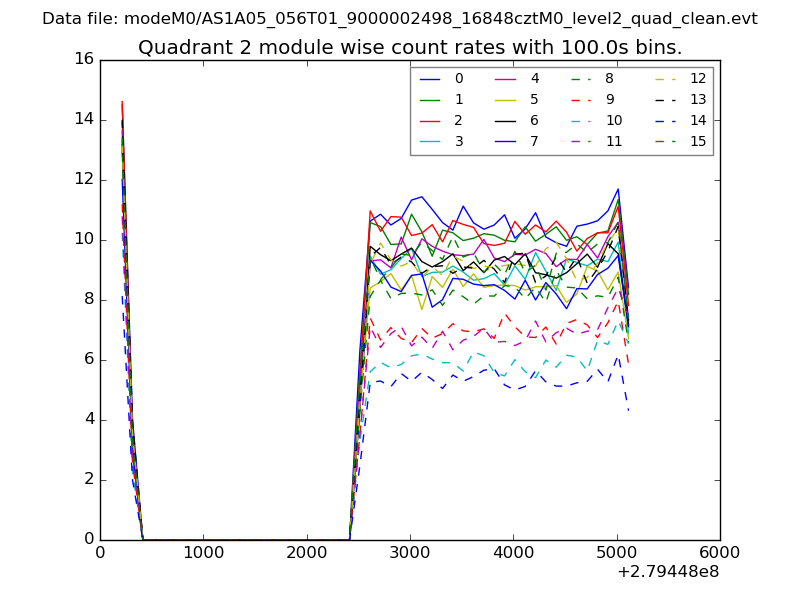
| Module-wise count rates for Quadrant B Data is divided into 100 sec bins |
 |
 |
| Module-wise count rates for Quadrant C Data is divided into 100 sec bins |
 |
 |
| Module-wise count rates for Quadrant D Data is divided into 100 sec bins |
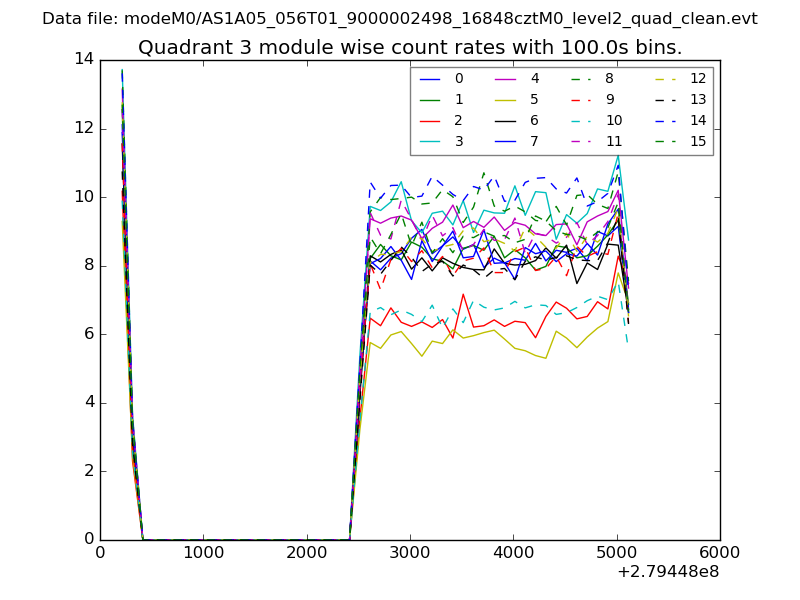 |
 |
| Parameter | Plot |
|---|---|
| CZT HV Monitor | 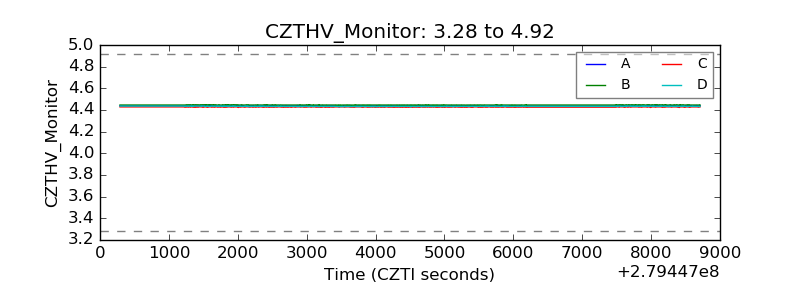 |
| D_VDD | 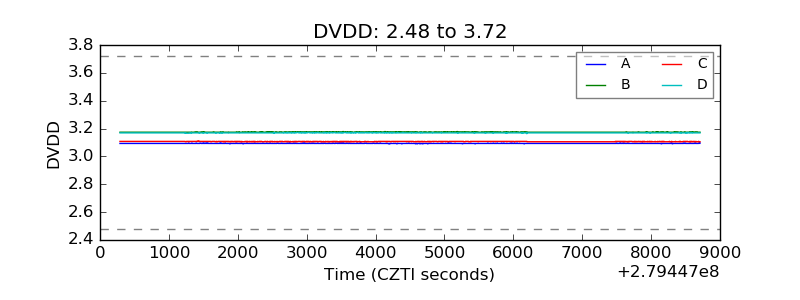 |
| Temperature 1 | 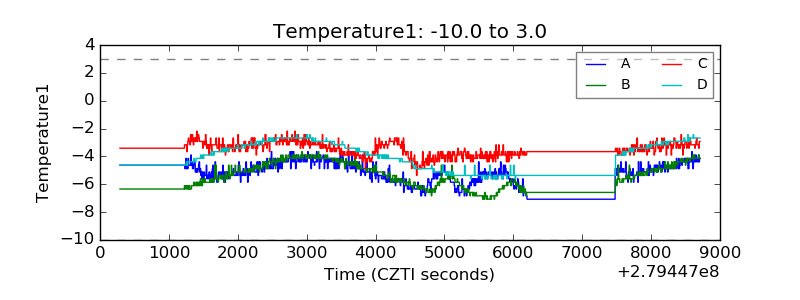 |
| Veto HV Monitor | 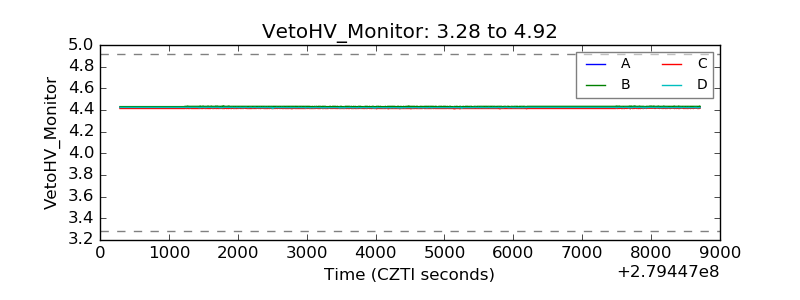 |
| Veto LLD | 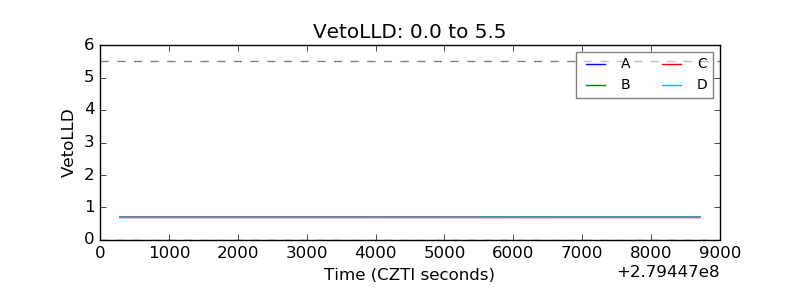 |
| Alpha Counter | 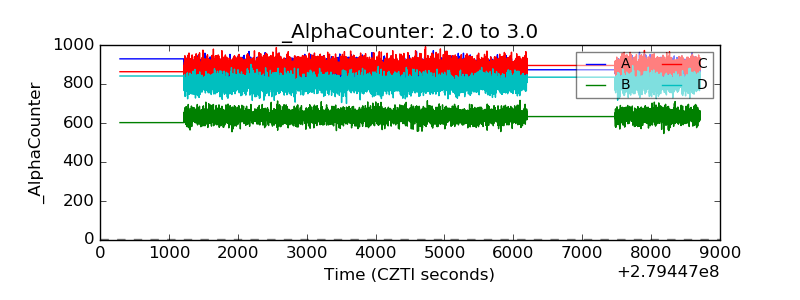 |
| _CPM_Rate | 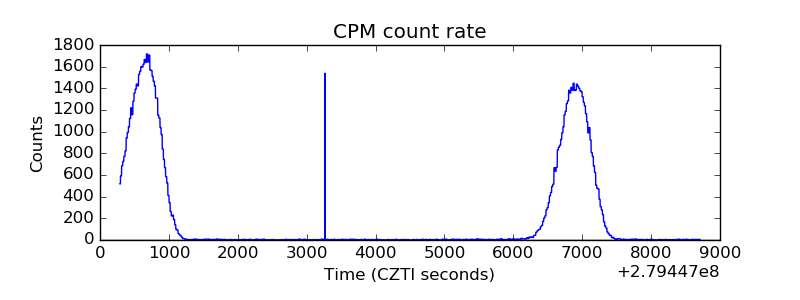 |
| CZT Counter |  |
| +2.5 Volts monitor |  |
| +5 Volts monitor | 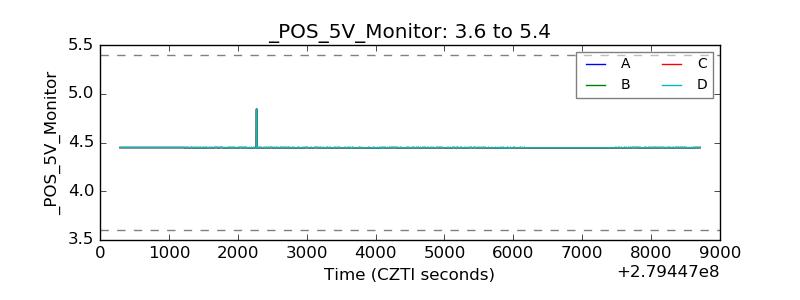 |
| _ROLL_ROT | 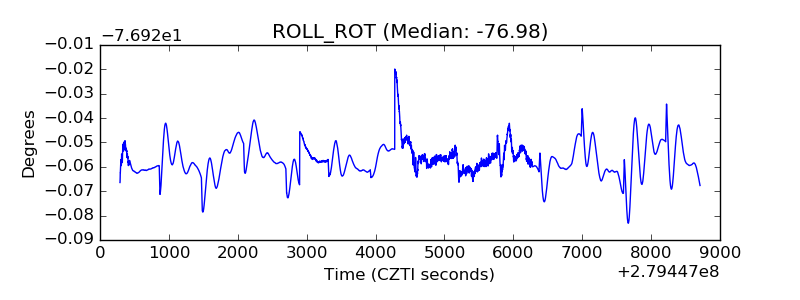 |
| _Roll_DEC | 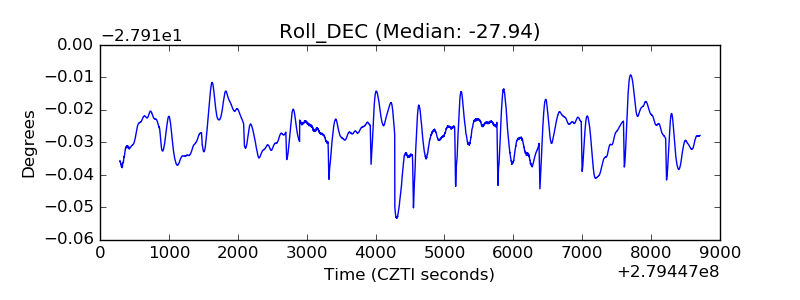 |
| _Roll_RA | 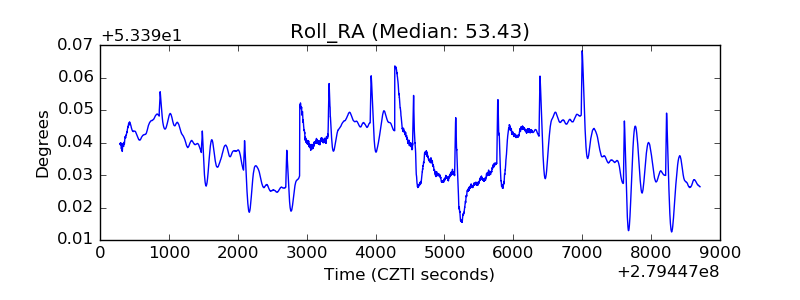 |
| Veto Counter | 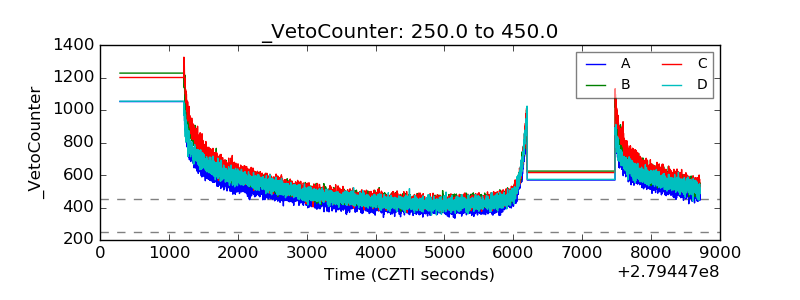 |