| Param | Original file | Final file |
|---|---|---|
| Filename | modeM0/AS1A05_056T01_9000002498_16849cztM0_level2.evt | modeM0/AS1A05_056T01_9000002498_16849cztM0_level2_quad_clean.evt |
| Size (bytes) | 486,717,120 | 71,568,000 |
| Size | 464.2 MB | 68.3 MB |
| Events in quadrant A | 3,383,626 | 434,693 |
| Events in quadrant B | 3,601,363 | 444,714 |
| Events in quadrant C | 3,458,920 | 422,043 |
| Events in quadrant D | 3,858,468 | 415,820 |
| Mode M9 | |||
|---|---|---|---|
| Quadrant | BADHDUFLAG | Total packets | Discarded packets |
| A | 0 | 15 | 0 |
| B | 0 | 15 | 0 |
| C | 0 | 15 | 0 |
| D | 0 | 16 | 0 |
| Mode SS | |||
|---|---|---|---|
| Quadrant | BADHDUFLAG | Total packets | Discarded packets |
| A | 0 | 132 | 0 |
| B | 0 | 132 | 0 |
| C | 0 | 132 | 0 |
| D | 0 | 132 | 0 |
| Mode M0 | |||
|---|---|---|---|
| Quadrant | BADHDUFLAG | Total packets | Discarded packets |
| A | 0 | 13917 | 3 |
| B | 0 | 14475 | 2 |
| C | 0 | 14203 | 2 |
| D | 0 | 15761 | 2 |
| Quadrant | Total seconds | Saturated seconds | Saturation percentage |
|---|---|---|---|
| A | 6444 | 150 | 2.327747% |
| B | 6444 | 174 | 2.700186% |
| C | 6444 | 220 | 3.414029% |
| D | 6444 | 191 | 2.963998% |
Noise dominated data is calculated using 1-second bins in cleaned event files. If a bin has >2000 counts, and if more than 50% of those come from <1% of pixels, then it is considered to be noise-dominated and hence unusable.
| Quadrant | # 1 sec bins | Bins with >0 counts | Bins with >2000 counts | High rate bins dominated by noise | Noise dominated (total time) | Noise dominated (detector-on time) | Marked lightcurve |
|---|---|---|---|---|---|---|---|
| A | 7640 | 6445 | 0 | 0 | 0.00% | 0.00% | 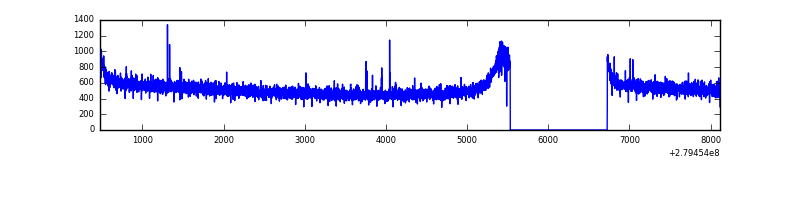 |
| B | 7640 | 6445 | 4 | 4 | 0.05% | 0.06% | 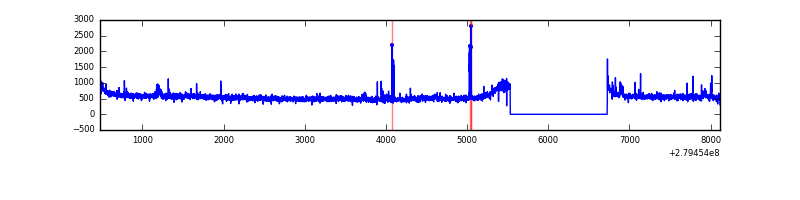 |
| C | 7640 | 6445 | 0 | 0 | 0.00% | 0.00% | 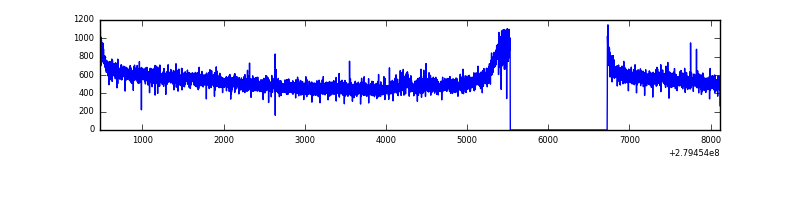 |
| D | 7640 | 6445 | 43 | 43 | 0.56% | 0.67% | 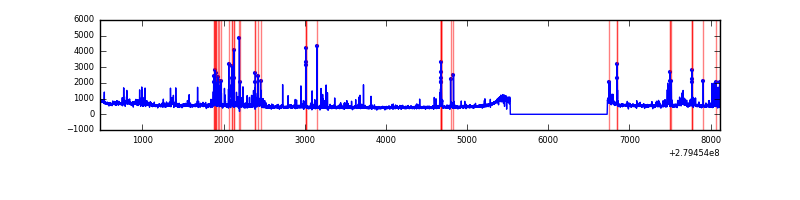 |
Top three noisy pixels from each quadrant. If the there are fewer than three noisy pixels in the level2.evt file, extra rows are filled as -1
| Pixel properties | Quadrant properties | ||||||
|---|---|---|---|---|---|---|---|
| Quadrant | DetID | PixID | Counts | Sigma | Mean | Median | Sigma |
| A | 9 | 143 | 14416 | 77.59 | 877 | 860 | 174.7 |
| A | 0 | 226 | 7579 | 38.46 | 877 | 860 | 174.7 |
| A | 12 | 194 | 6259 | 30.9 | 877 | 860 | 174.7 |
| B | 0 | 229 | 71190 | 429.03 | 873 | 855 | 163.9 |
| B | 10 | 16 | 46624 | 279.18 | 873 | 855 | 163.9 |
| B | 4 | 173 | 38899 | 232.06 | 873 | 855 | 163.9 |
| C | 14 | 238 | 131559 | 667.53 | 845 | 853 | 195.8 |
| C | 3 | 233 | 28606 | 141.74 | 845 | 853 | 195.8 |
| C | 0 | 207 | 6436 | 28.51 | 845 | 853 | 195.8 |
| D | 5 | 222 | 328049 | 1596.72 | 853 | 830 | 204.9 |
| D | 1 | 52 | 278551 | 1355.18 | 853 | 830 | 204.9 |
| D | 2 | 234 | 22617 | 106.31 | 853 | 830 | 204.9 |
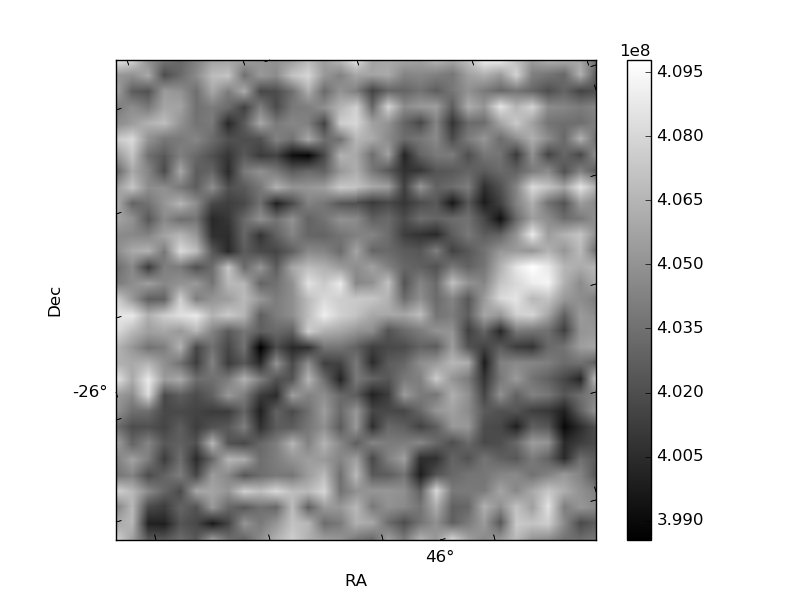
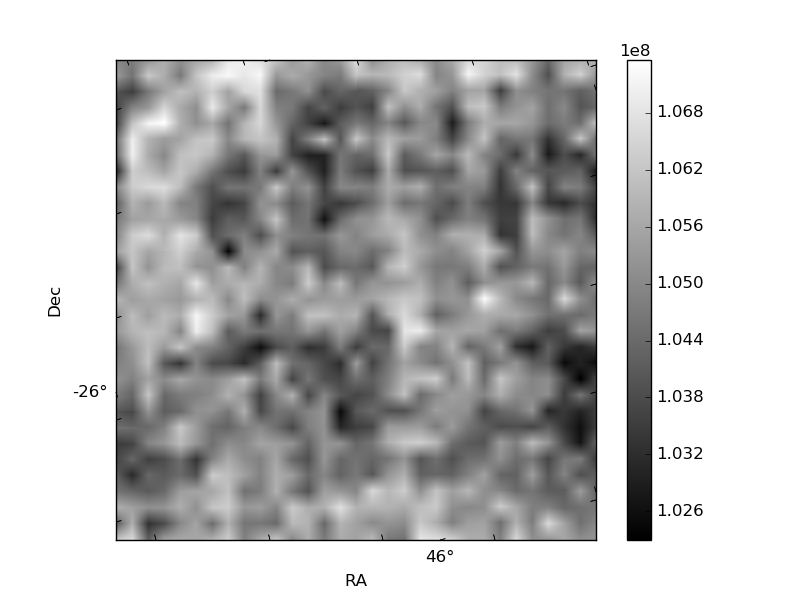
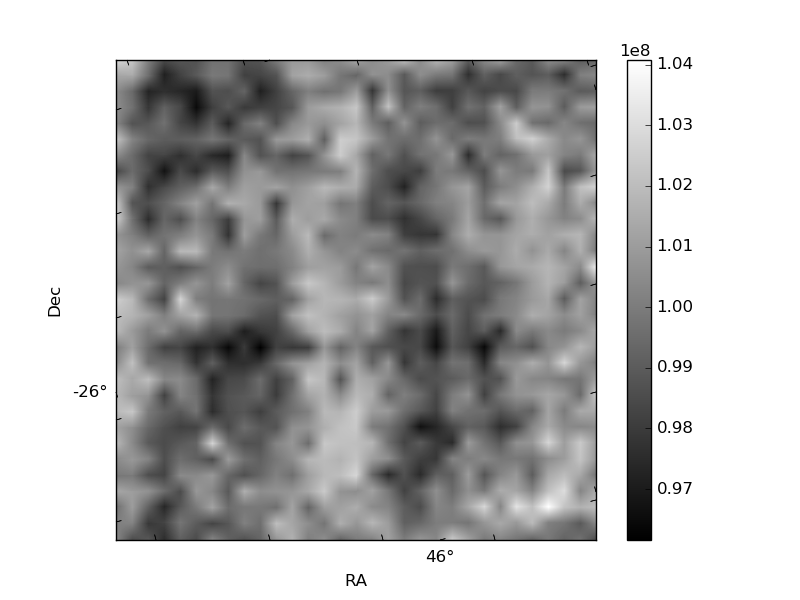
Histogram calculated using DETX and DETY for each event in the final _common_clean file
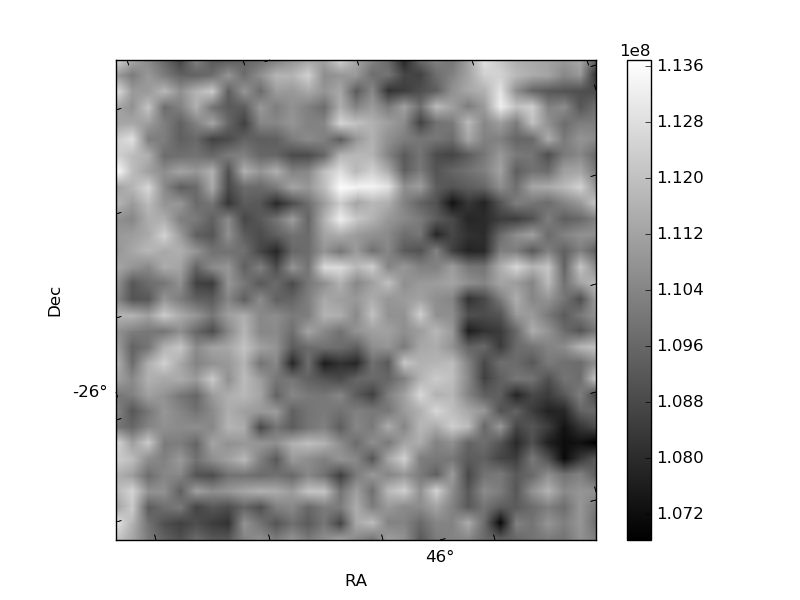
| Quadrant A | 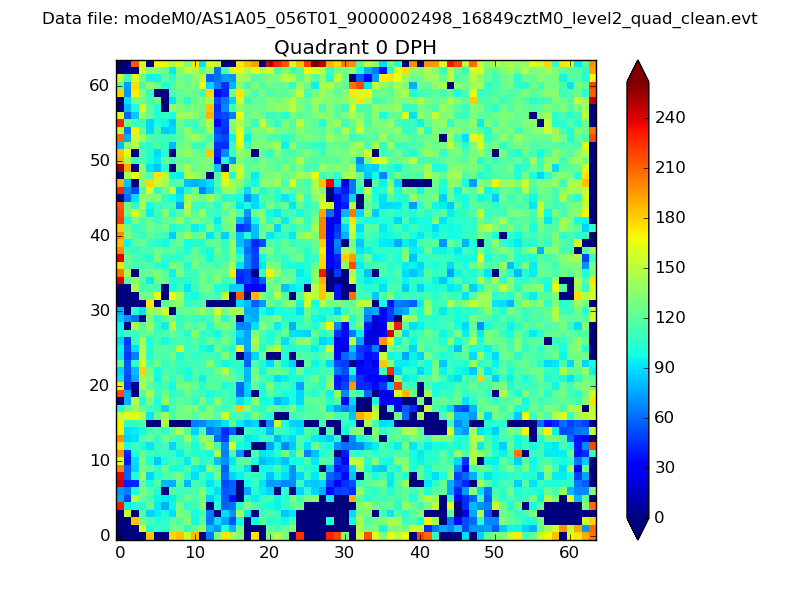 |
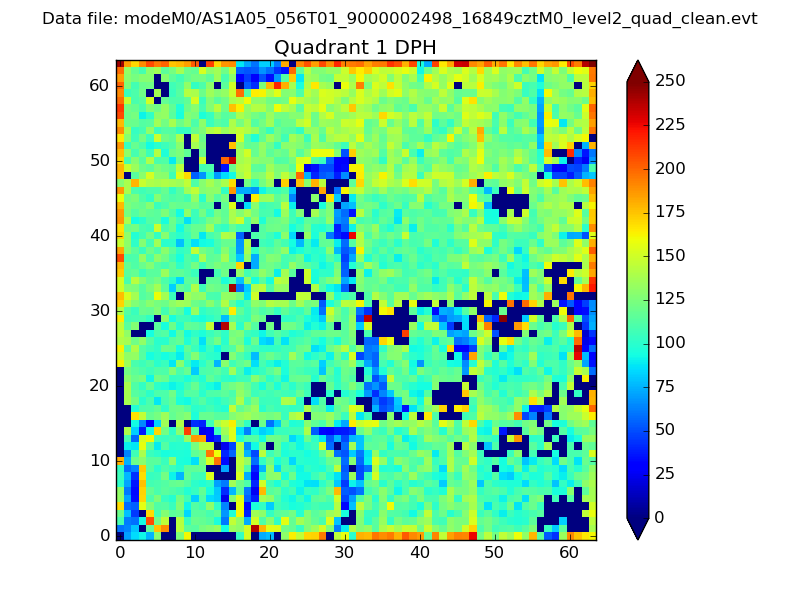 |
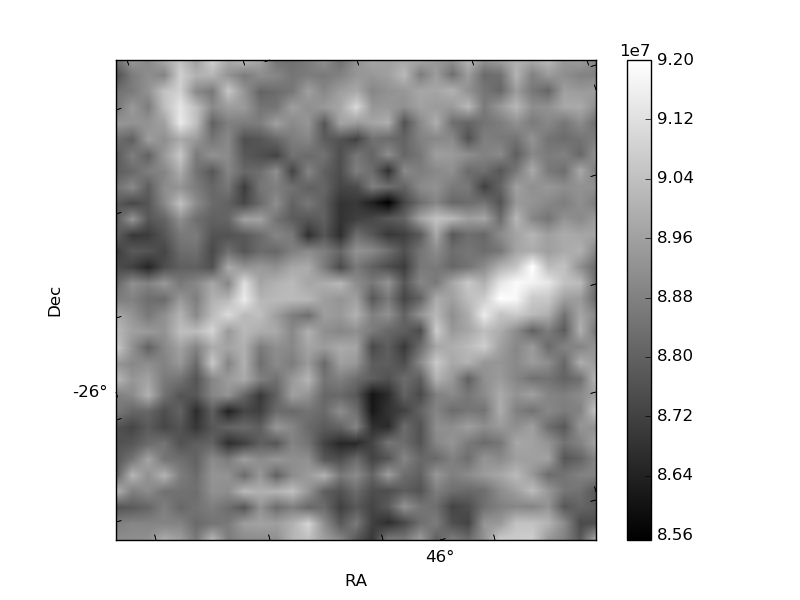
Quadrant B |
|---|---|---|---|
| Quadrant D | 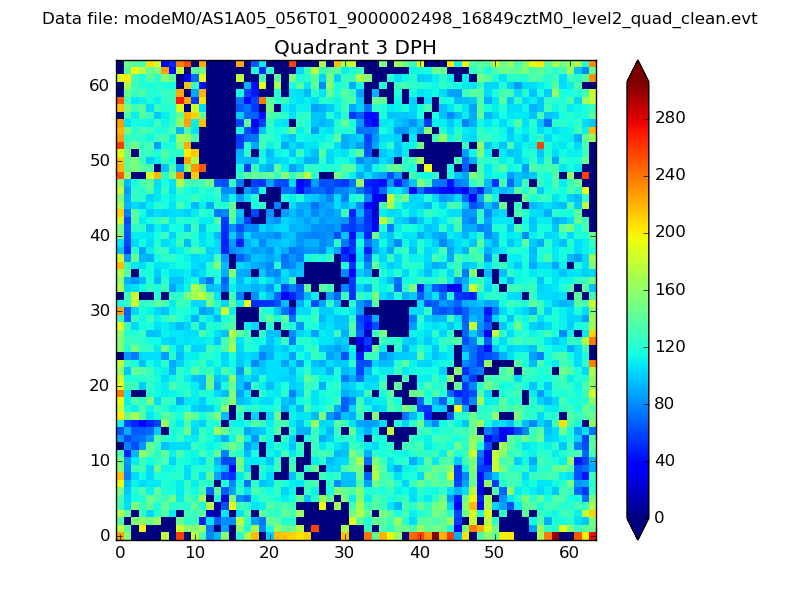 |
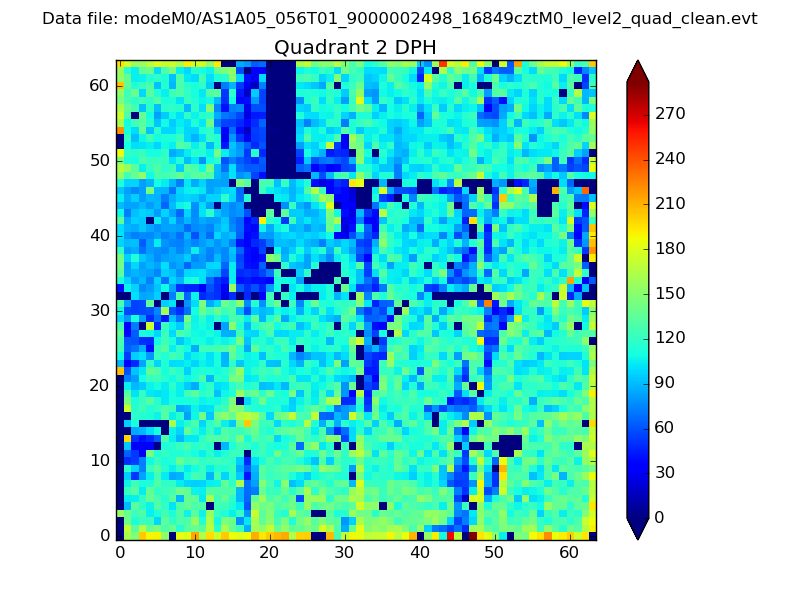 |
Quadrant C |
| Plot type | Count rate plots | Images |
|---|---|---|
| Comparison with Poisson distribution Blue bars denote a histogram of data divided into 1 sec bins. Red curve is a Poisson curve with rate = median count rate of data. |
 |
 |
| Quadrant-wise count rates Data is divided into 100 sec bins |
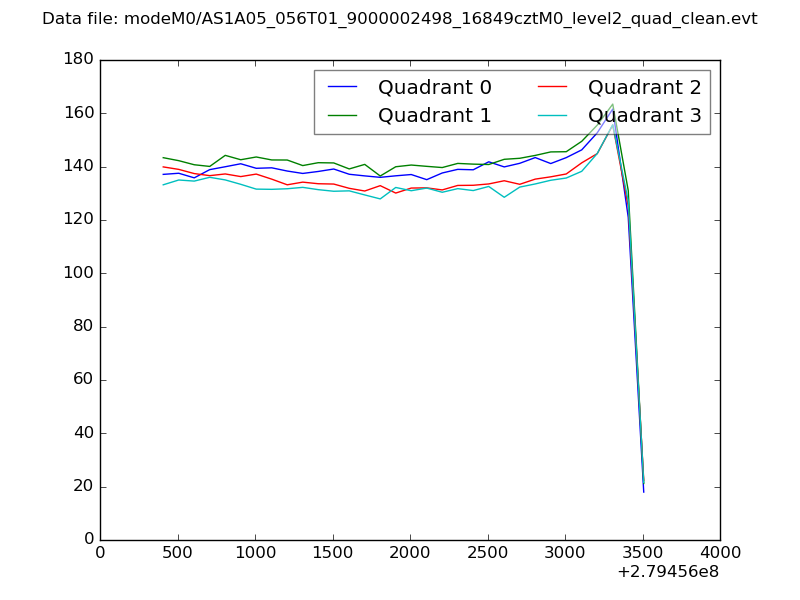 |
|
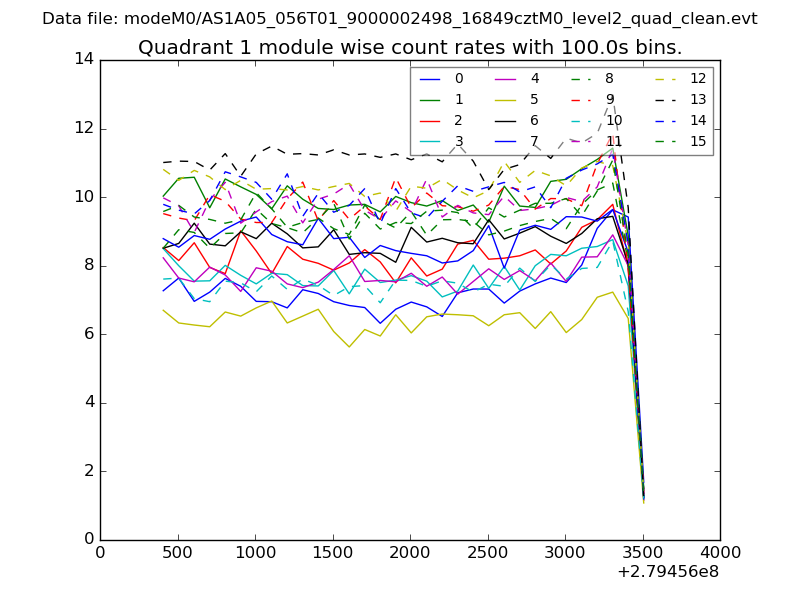
| Module-wise count rates for Quadrant A Data is divided into 100 sec bins |
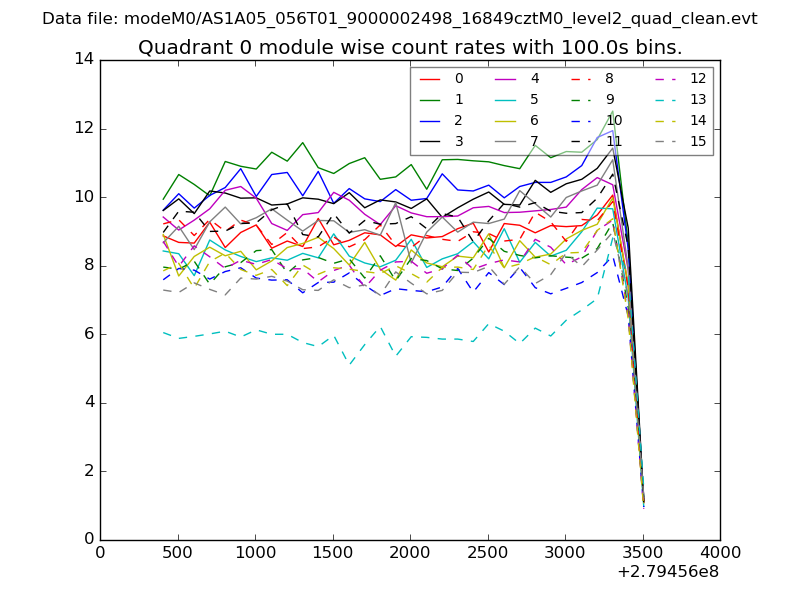 |
 |
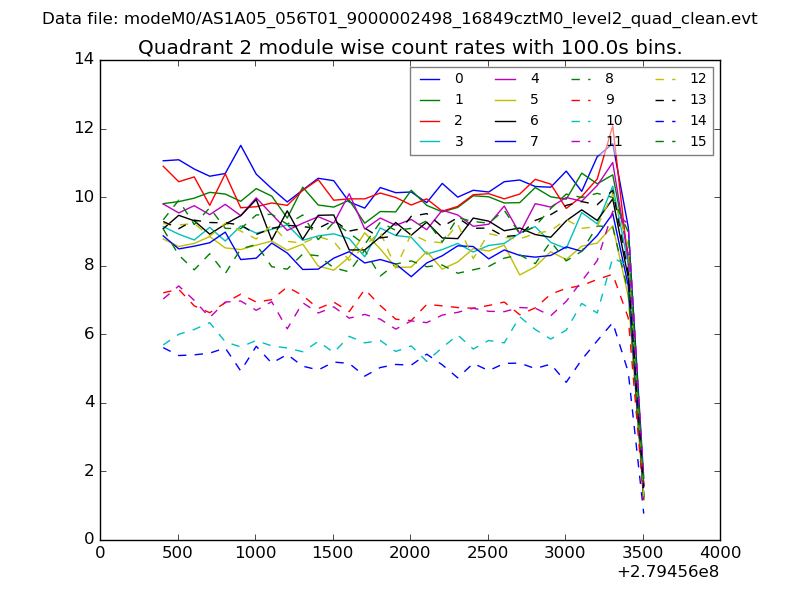
| Module-wise count rates for Quadrant B Data is divided into 100 sec bins |
 |
 |
| Module-wise count rates for Quadrant C Data is divided into 100 sec bins |
 |
 |
| Module-wise count rates for Quadrant D Data is divided into 100 sec bins |
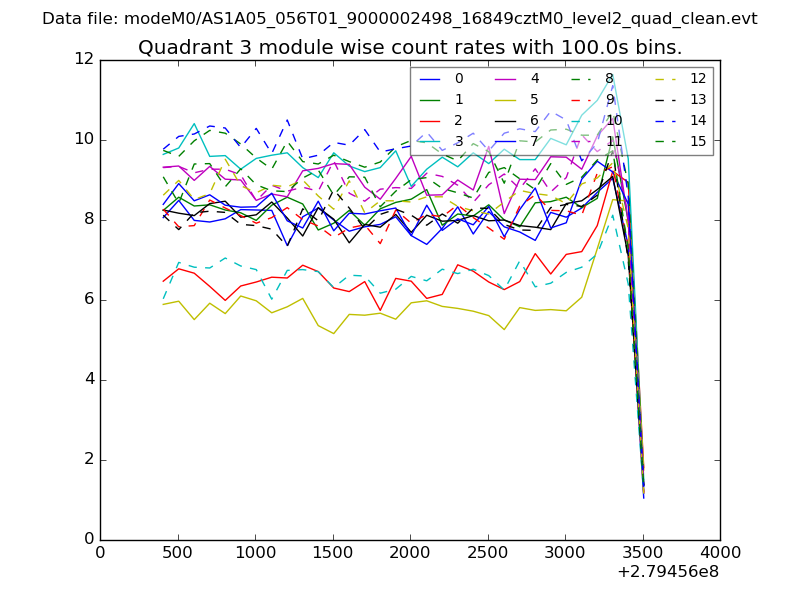 |
 |
| Parameter | Plot |
|---|---|
| CZT HV Monitor | 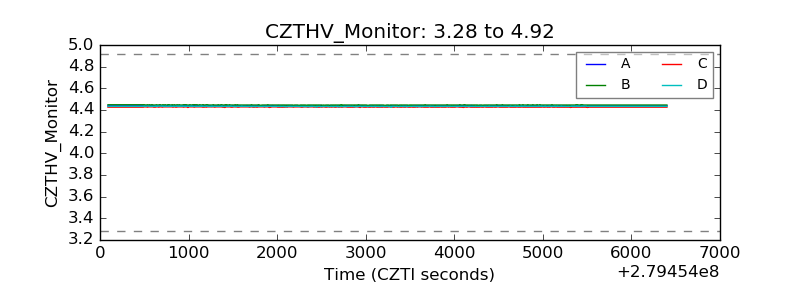 |
| D_VDD | 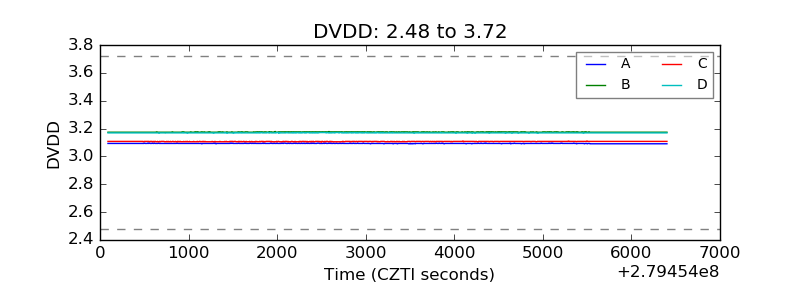 |
| Temperature 1 | 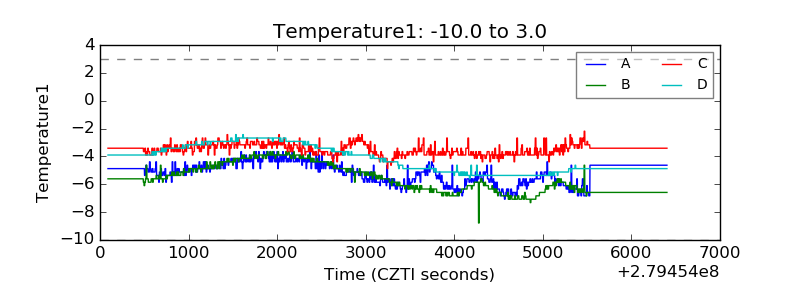 |
| Veto HV Monitor | 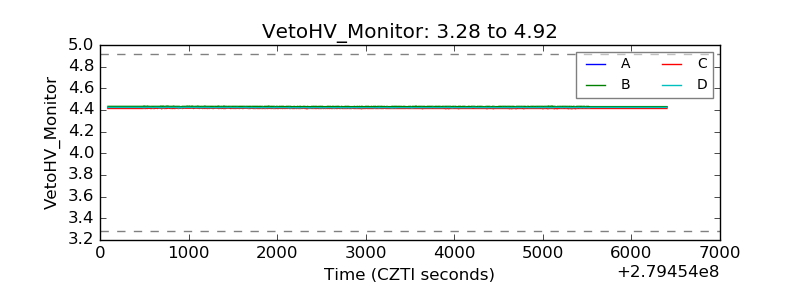 |
| Veto LLD | 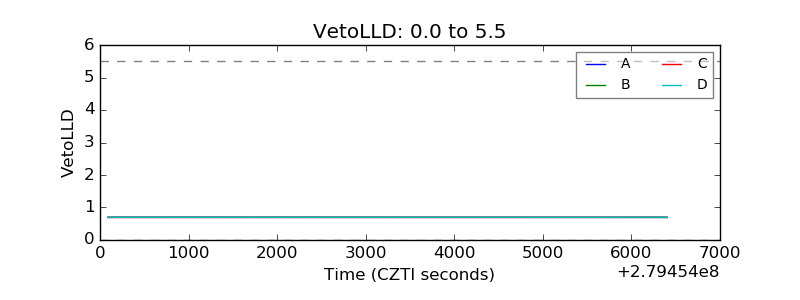 |
| Alpha Counter |  |
| _CPM_Rate |  |
| CZT Counter | 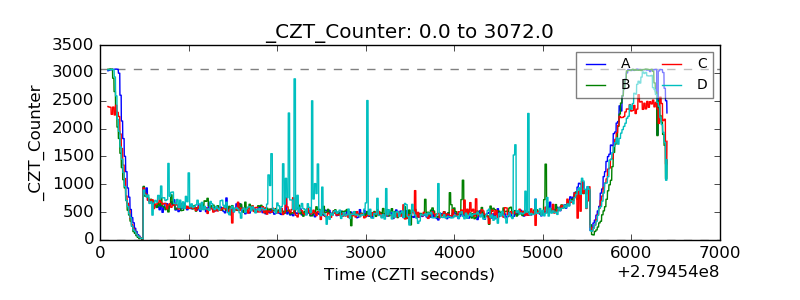 |
| +2.5 Volts monitor |  |
| +5 Volts monitor |  |
| _ROLL_ROT | 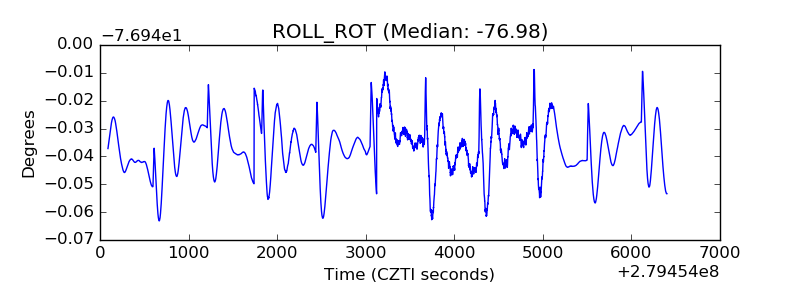 |
| _Roll_DEC | 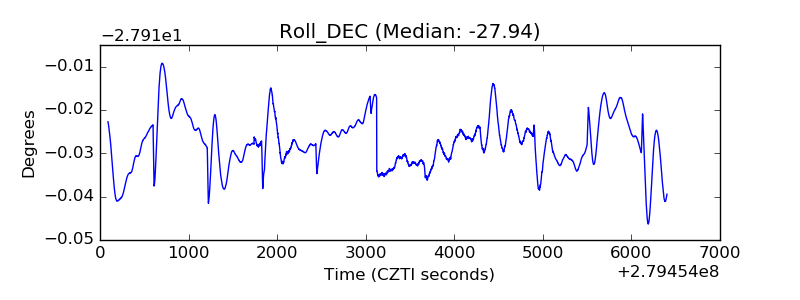 |
| _Roll_RA |  |
| Veto Counter | 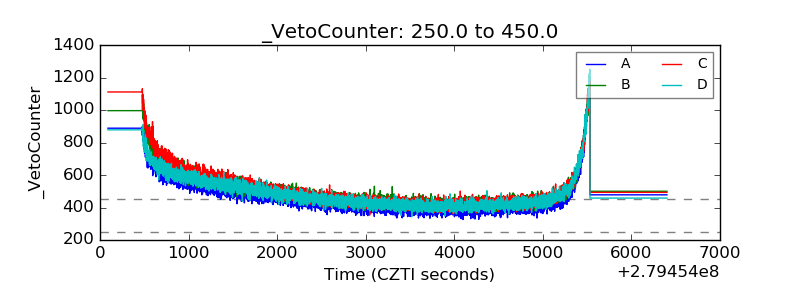 |