| Param | Original file | Final file |
|---|---|---|
| Filename | modeM0/AS1A05_056T01_9000002498_16851cztM0_level2.evt | modeM0/AS1A05_056T01_9000002498_16851cztM0_level2_quad_clean.evt |
| Size (bytes) | 534,107,520 | 99,060,480 |
| Size | 509.4 MB | 94.5 MB |
| Events in quadrant A | 3,901,901 | 630,077 |
| Events in quadrant B | 4,043,267 | 639,277 |
| Events in quadrant C | 3,716,655 | 606,463 |
| Events in quadrant D | 4,002,374 | 600,190 |
| Mode M9 | |||
|---|---|---|---|
| Quadrant | BADHDUFLAG | Total packets | Discarded packets |
| A | 0 | 19 | 0 |
| B | 0 | 19 | 0 |
| C | 0 | 19 | 0 |
| D | 0 | 19 | 0 |
| Mode SS | |||
|---|---|---|---|
| Quadrant | BADHDUFLAG | Total packets | Discarded packets |
| A | 0 | 154 | 0 |
| B | 0 | 154 | 0 |
| C | 0 | 154 | 0 |
| D | 0 | 154 | 0 |
| Mode M0 | |||
|---|---|---|---|
| Quadrant | BADHDUFLAG | Total packets | Discarded packets |
| A | 0 | 16522 | 3 |
| B | 0 | 16785 | 2 |
| C | 0 | 15866 | 2 |
| D | 0 | 16980 | 2 |
| Quadrant | Total seconds | Saturated seconds | Saturation percentage |
|---|---|---|---|
| A | 7531 | 267 | 3.545346% |
| B | 7531 | 184 | 2.443235% |
| C | 7531 | 170 | 2.257336% |
| D | 7531 | 136 | 1.805869% |
Noise dominated data is calculated using 1-second bins in cleaned event files. If a bin has >2000 counts, and if more than 50% of those come from <1% of pixels, then it is considered to be noise-dominated and hence unusable.
| Quadrant | # 1 sec bins | Bins with >0 counts | Bins with >2000 counts | High rate bins dominated by noise | Noise dominated (total time) | Noise dominated (detector-on time) | Marked lightcurve |
|---|---|---|---|---|---|---|---|
| A | 9357 | 7534 | 126 | 126 | 1.35% | 1.67% | 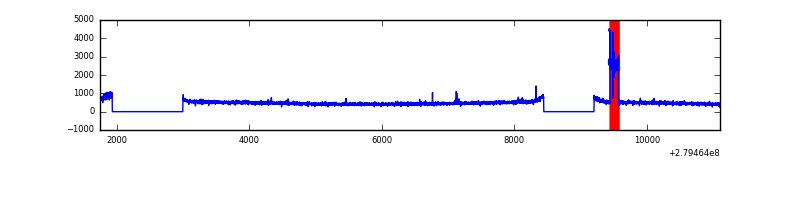 |
| B | 9357 | 7534 | 6 | 6 | 0.06% | 0.08% | 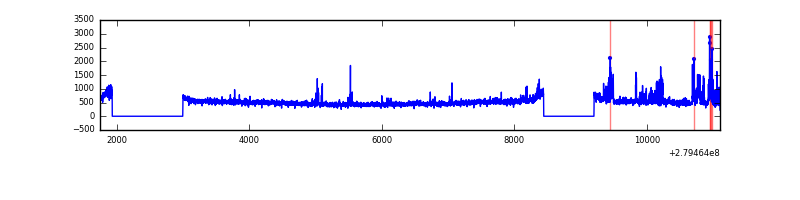 |
| C | 9357 | 7534 | 1 | 1 | 0.01% | 0.01% | 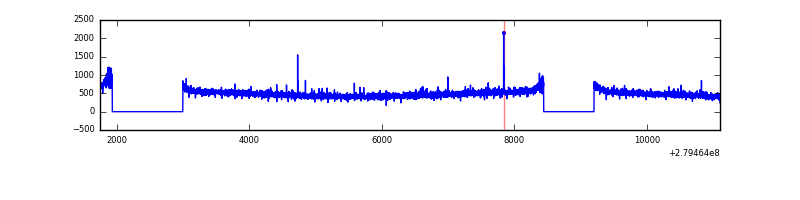 |
| D | 9357 | 7534 | 35 | 35 | 0.37% | 0.46% | 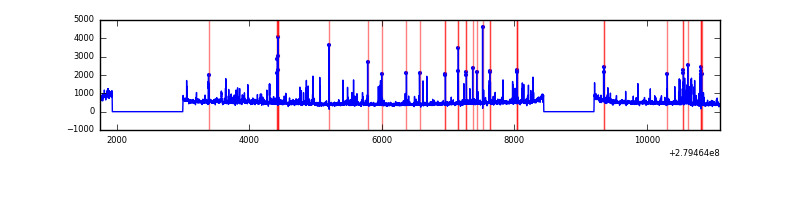 |
Top three noisy pixels from each quadrant. If the there are fewer than three noisy pixels in the level2.evt file, extra rows are filled as -1
| Pixel properties | Quadrant properties | ||||||
|---|---|---|---|---|---|---|---|
| Quadrant | DetID | PixID | Counts | Sigma | Mean | Median | Sigma |
| A | 0 | 23 | 310636 | 1649.79 | 928 | 908 | 187.7 |
| A | 0 | 226 | 25485 | 130.91 | 928 | 908 | 187.7 |
| A | 9 | 143 | 8880 | 42.46 | 928 | 908 | 187.7 |
| B | 10 | 16 | 229941 | 1263.64 | 940 | 917 | 181.2 |
| B | 15 | 35 | 72448 | 394.67 | 940 | 917 | 181.2 |
| B | 0 | 229 | 66675 | 362.82 | 940 | 917 | 181.2 |
| C | 14 | 238 | 139943 | 662.86 | 900 | 909 | 209.7 |
| C | 0 | 207 | 43875 | 204.84 | 900 | 909 | 209.7 |
| C | 3 | 233 | 15776 | 70.88 | 900 | 909 | 209.7 |
| D | 1 | 52 | 443949 | 1984.08 | 914 | 887 | 223.3 |
| D | 5 | 222 | 52226 | 229.9 | 914 | 887 | 223.3 |
| D | 15 | 145 | 43199 | 189.48 | 914 | 887 | 223.3 |
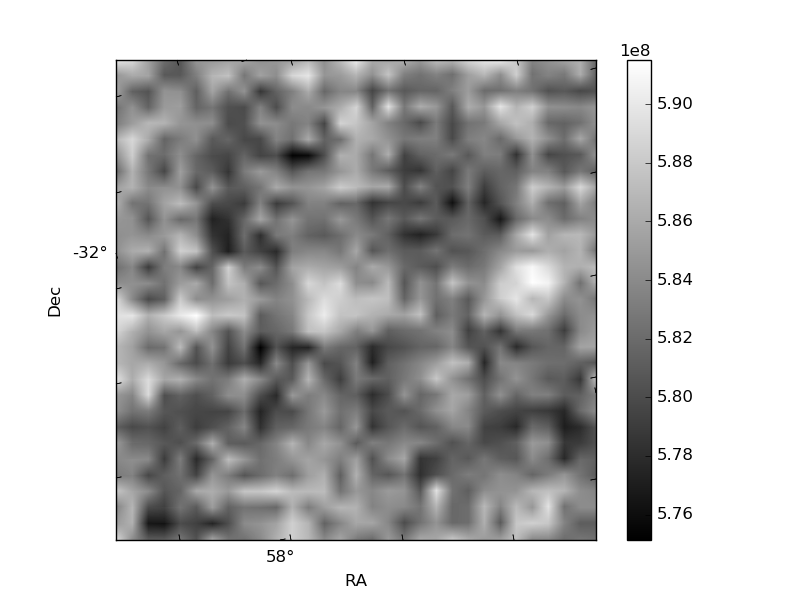
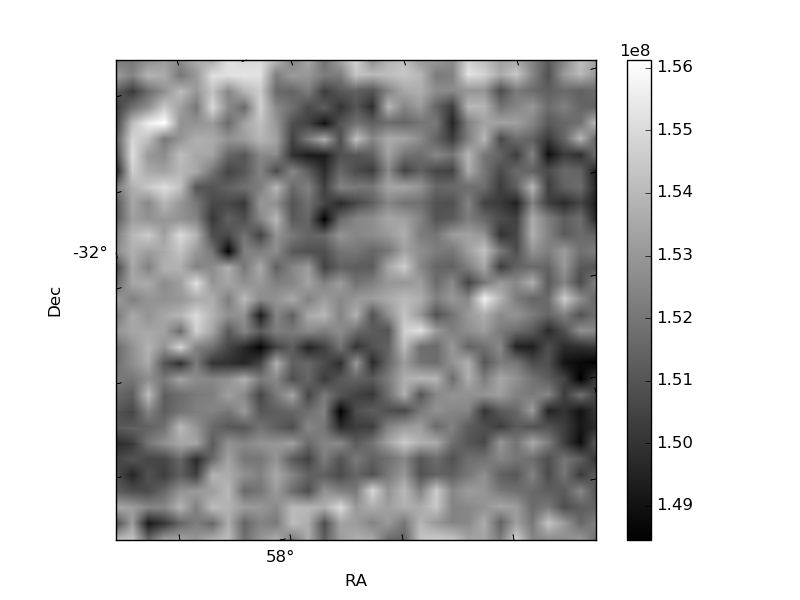
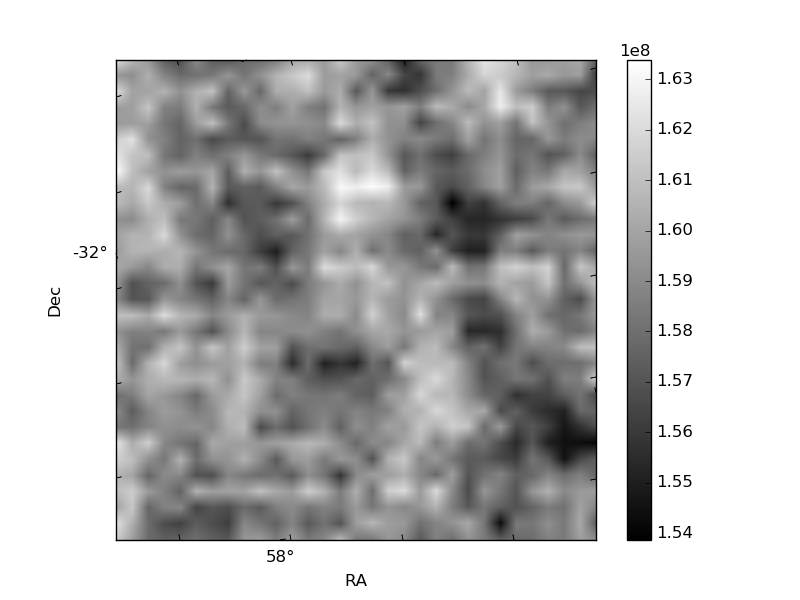
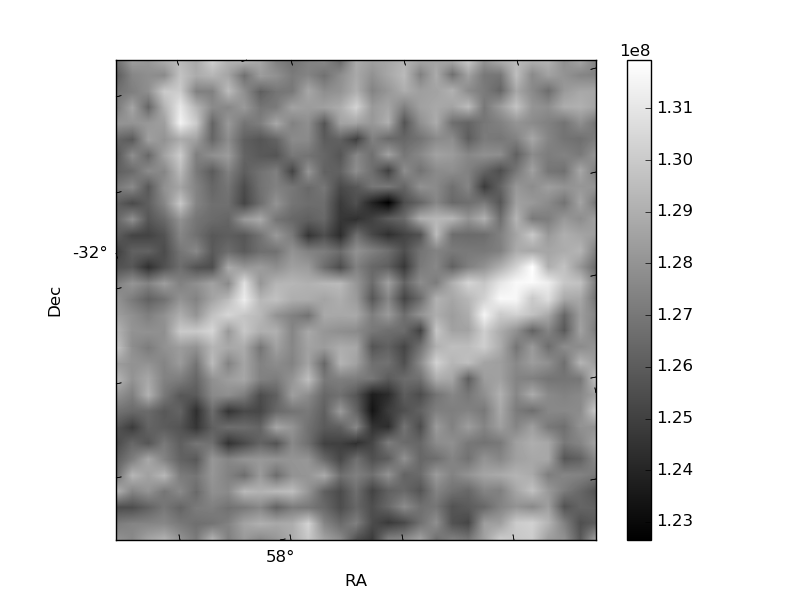
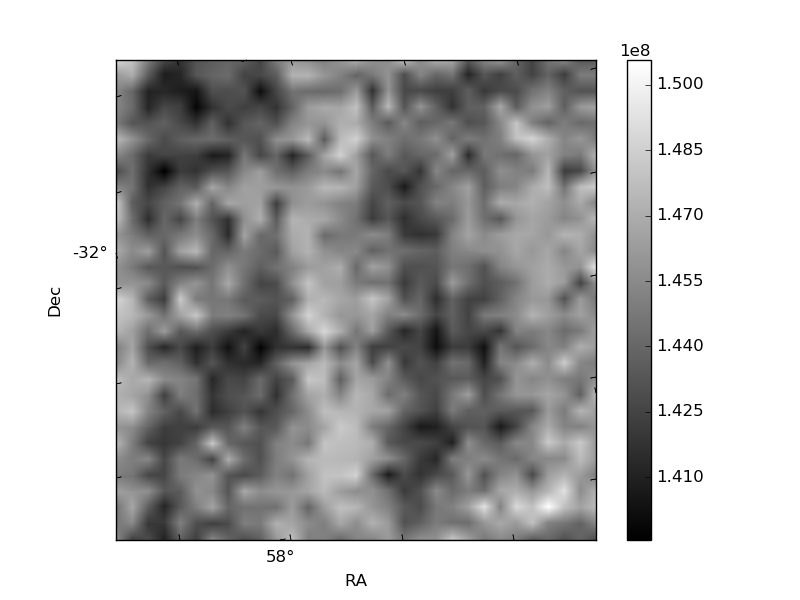
Histogram calculated using DETX and DETY for each event in the final _common_clean file
| Quadrant A | 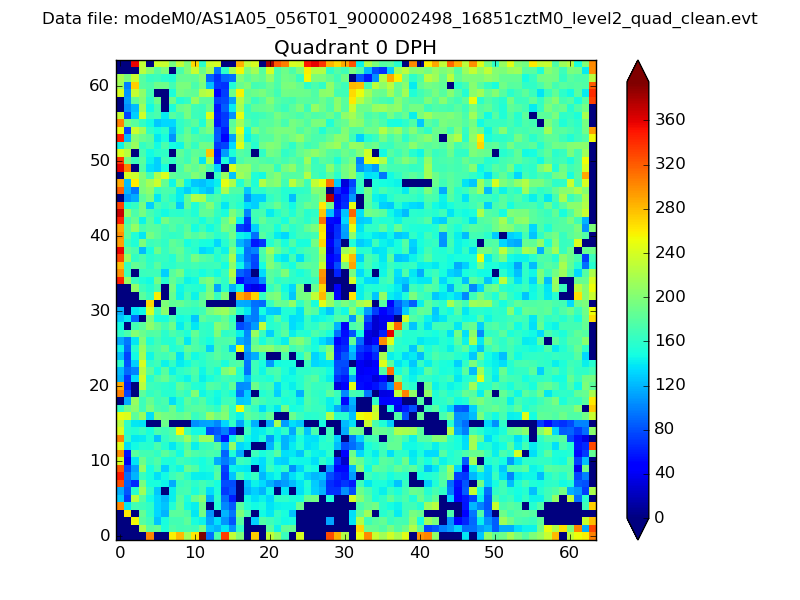 |
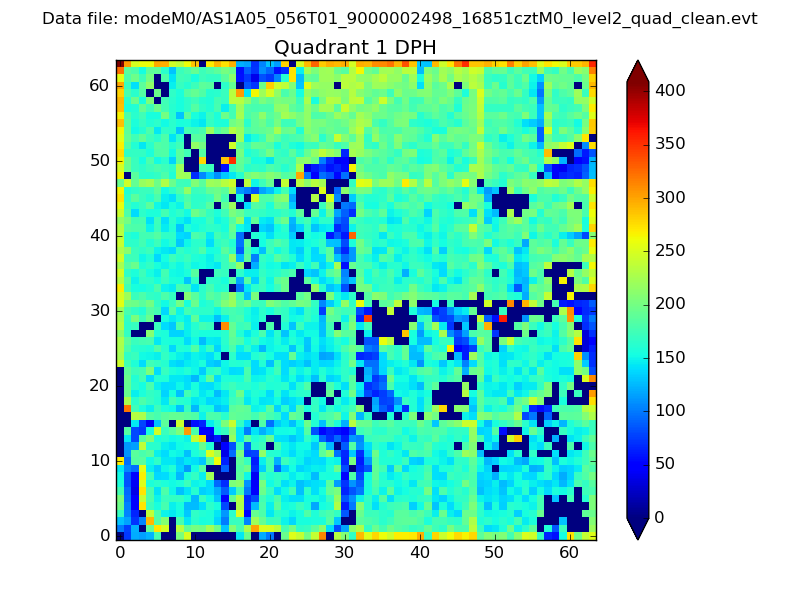 |
Quadrant B |
|---|---|---|---|
| Quadrant D | 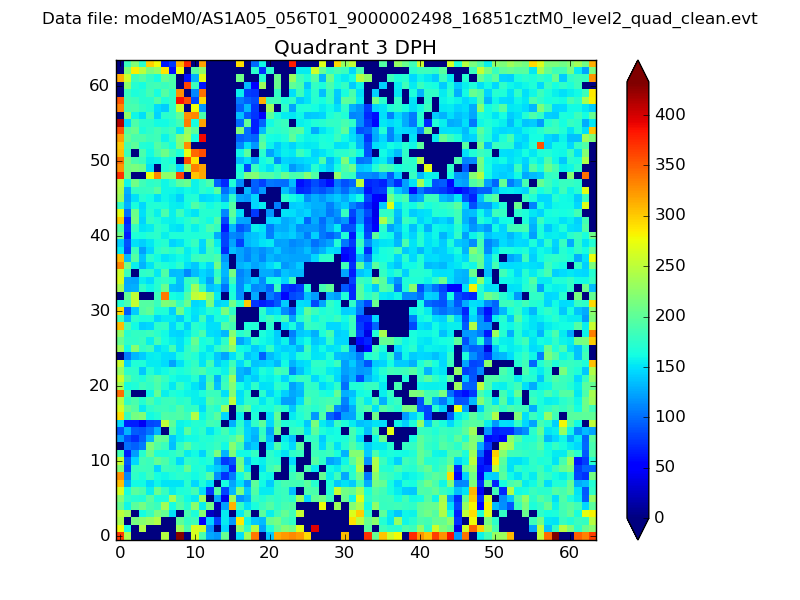 |
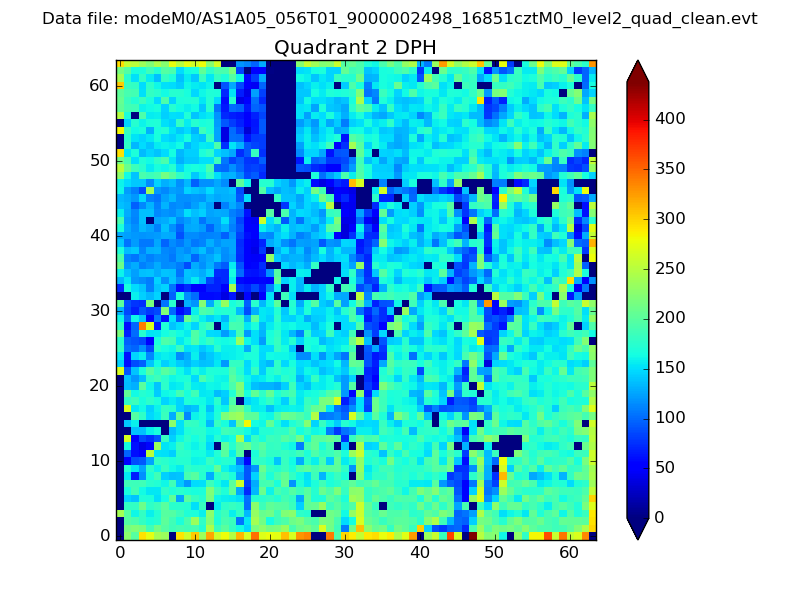 |
Quadrant C |
| Plot type | Count rate plots | Images |
|---|---|---|
| Comparison with Poisson distribution Blue bars denote a histogram of data divided into 1 sec bins. Red curve is a Poisson curve with rate = median count rate of data. |
 |
 |
| Quadrant-wise count rates Data is divided into 100 sec bins |
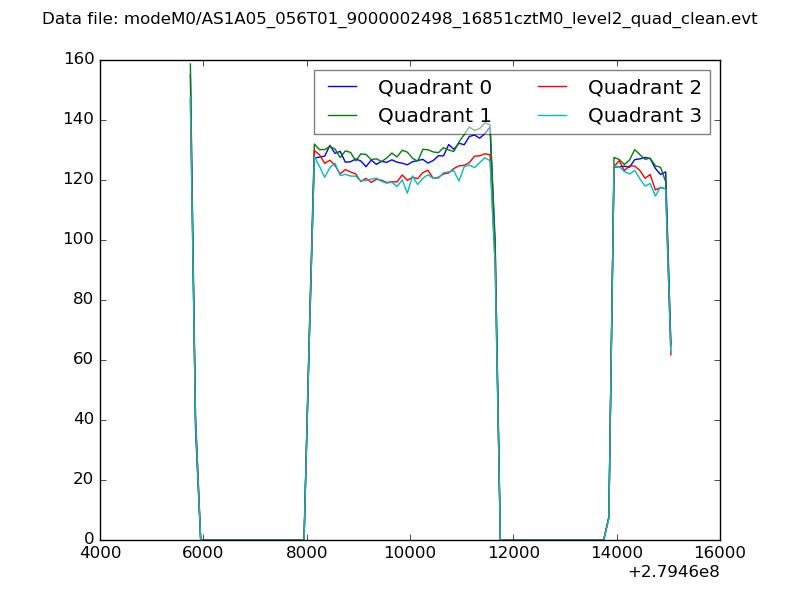 |
|
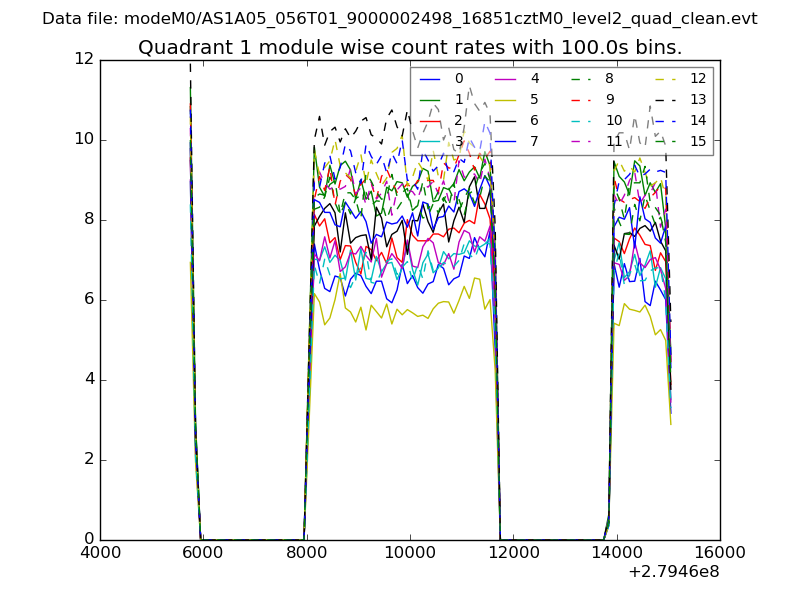
| Module-wise count rates for Quadrant A Data is divided into 100 sec bins |
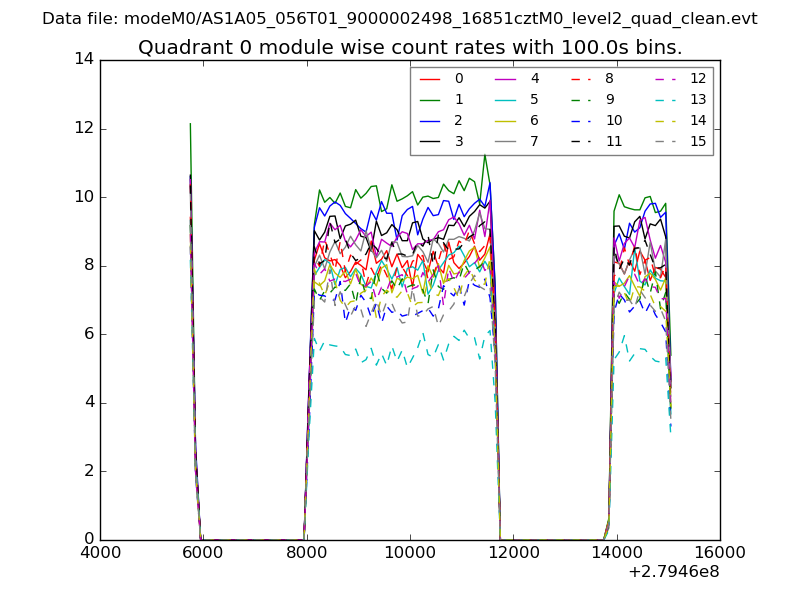 |
 |
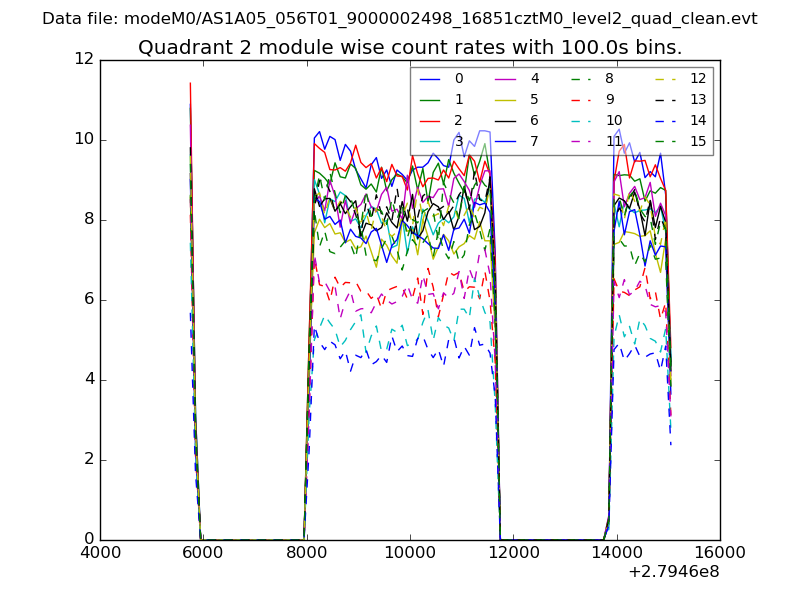
| Module-wise count rates for Quadrant B Data is divided into 100 sec bins |
 |
 |
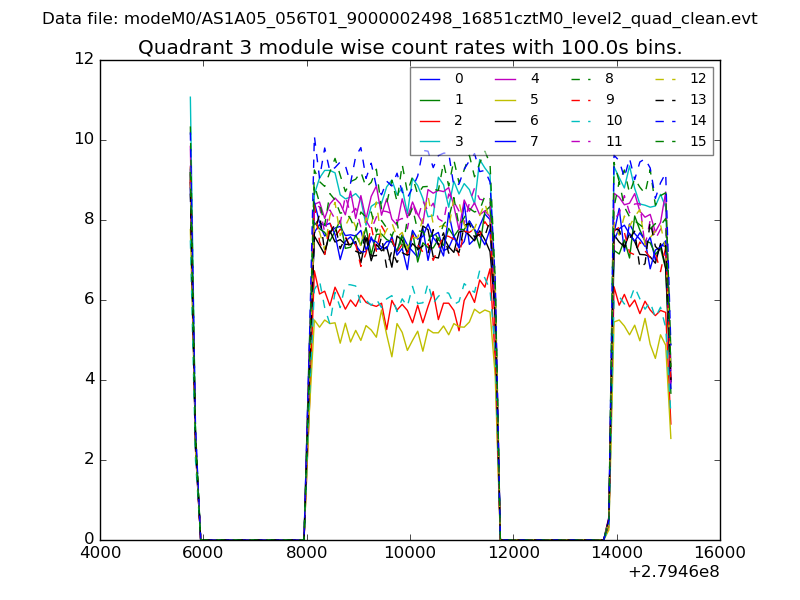
| Module-wise count rates for Quadrant C Data is divided into 100 sec bins |
 |
 |
| Module-wise count rates for Quadrant D Data is divided into 100 sec bins |
 |
 |
| Parameter | Plot |
|---|---|
| CZT HV Monitor | 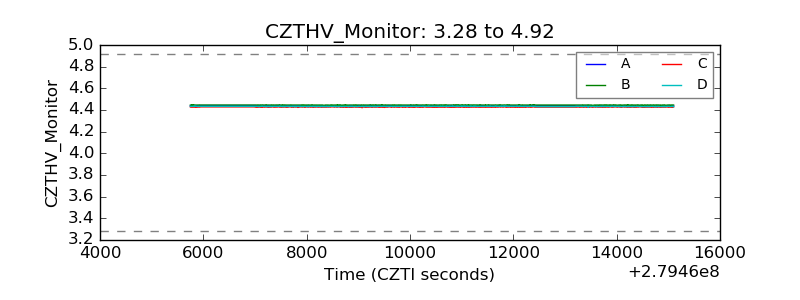 |
| D_VDD | 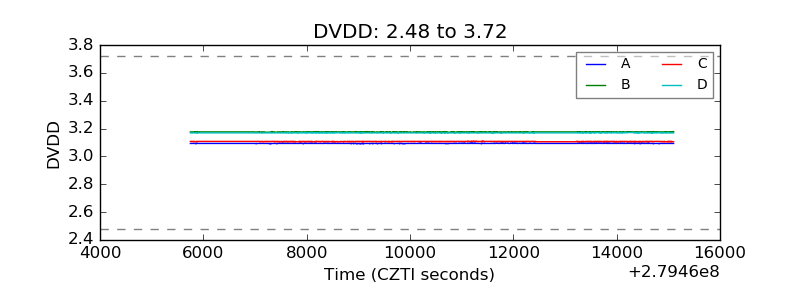 |
| Temperature 1 | 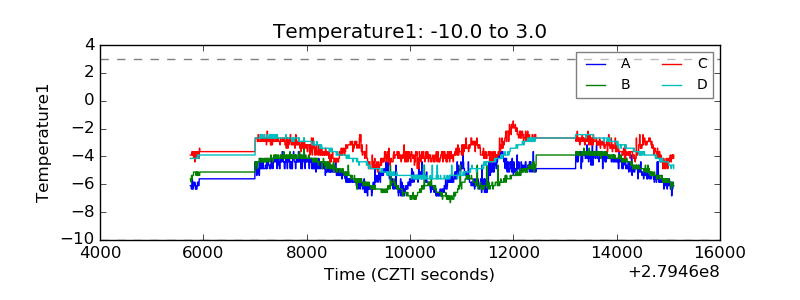 |
| Veto HV Monitor |  |
| Veto LLD | 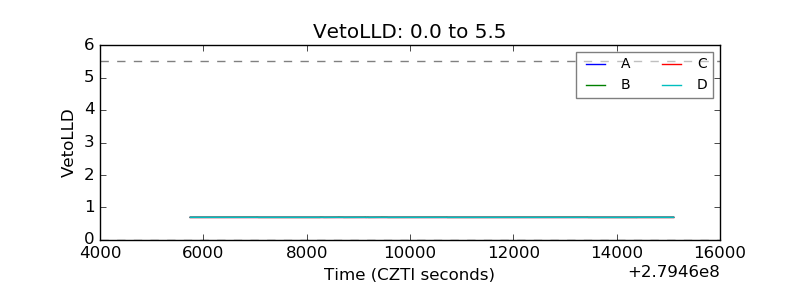 |
| Alpha Counter | 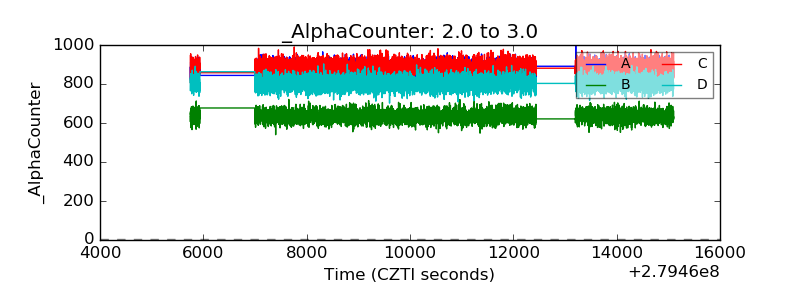 |
| _CPM_Rate | 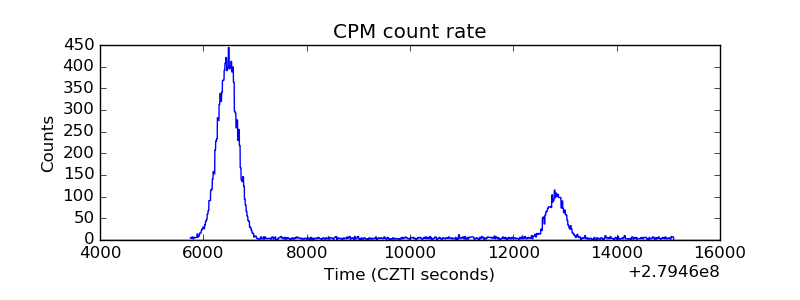 |
| CZT Counter | 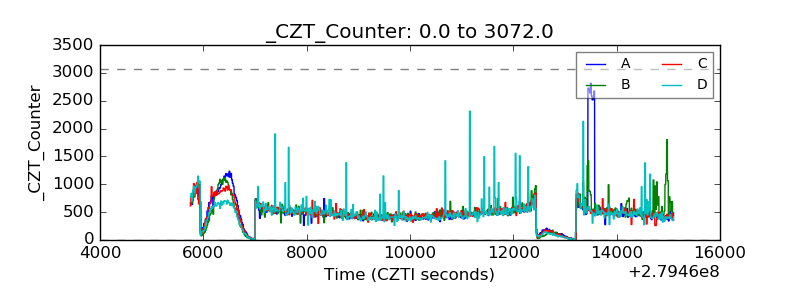 |
| +2.5 Volts monitor |  |
| +5 Volts monitor |  |
| _ROLL_ROT | 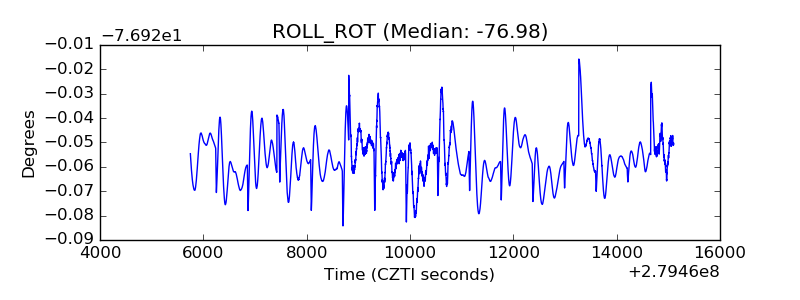 |
| _Roll_DEC | 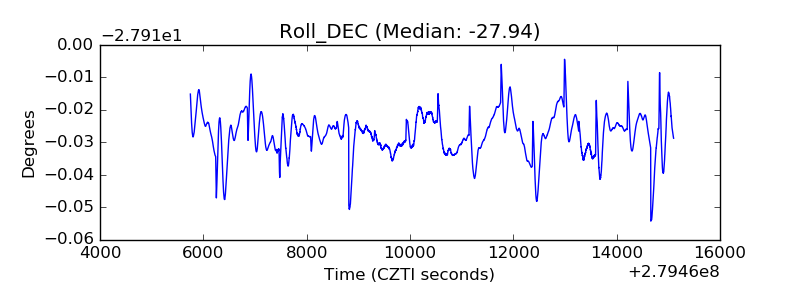 |
| _Roll_RA | 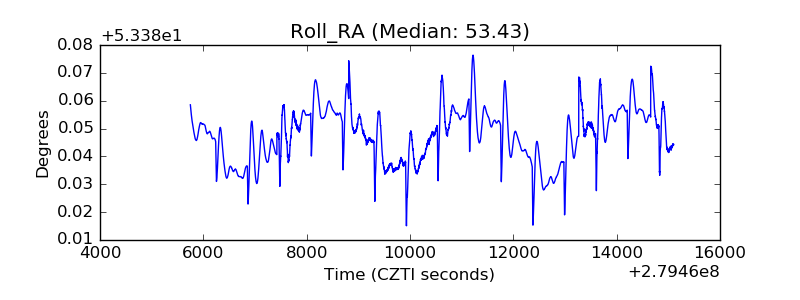 |
| Veto Counter | 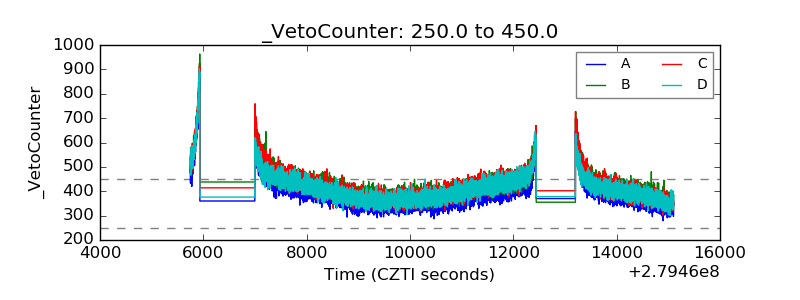 |