| Param | Original file | Final file |
|---|---|---|
| Filename | modeM0/AS1A05_056T01_9000002498_16852cztM0_level2.evt | modeM0/AS1A05_056T01_9000002498_16852cztM0_level2_quad_clean.evt |
| Size (bytes) | 489,568,320 | 97,643,520 |
| Size | 466.9 MB | 93.1 MB |
| Events in quadrant A | 3,593,535 | 628,629 |
| Events in quadrant B | 3,919,686 | 636,730 |
| Events in quadrant C | 3,347,313 | 604,646 |
| Events in quadrant D | 3,491,822 | 600,486 |
| Mode M9 | |||
|---|---|---|---|
| Quadrant | BADHDUFLAG | Total packets | Discarded packets |
| A | 0 | 4 | 0 |
| B | 0 | 4 | 0 |
| C | 0 | 4 | 0 |
| D | 0 | 4 | 0 |
| Mode SS | |||
|---|---|---|---|
| Quadrant | BADHDUFLAG | Total packets | Discarded packets |
| A | 0 | 142 | 0 |
| B | 0 | 142 | 0 |
| C | 0 | 142 | 0 |
| D | 0 | 142 | 0 |
| Mode M0 | |||
|---|---|---|---|
| Quadrant | BADHDUFLAG | Total packets | Discarded packets |
| A | 0 | 15359 | 2 |
| B | 0 | 16119 | 1 |
| C | 0 | 14470 | 1 |
| D | 0 | 15342 | 1 |
| Quadrant | Total seconds | Saturated seconds | Saturation percentage |
|---|---|---|---|
| A | 6984 | 42 | 0.601375% |
| B | 6984 | 100 | 1.431844% |
| C | 6984 | 63 | 0.902062% |
| D | 6984 | 68 | 0.973654% |
Noise dominated data is calculated using 1-second bins in cleaned event files. If a bin has >2000 counts, and if more than 50% of those come from <1% of pixels, then it is considered to be noise-dominated and hence unusable.
| Quadrant | # 1 sec bins | Bins with >0 counts | Bins with >2000 counts | High rate bins dominated by noise | Noise dominated (total time) | Noise dominated (detector-on time) | Marked lightcurve |
|---|---|---|---|---|---|---|---|
| A | 7385 | 6986 | 2 | 2 | 0.03% | 0.03% | 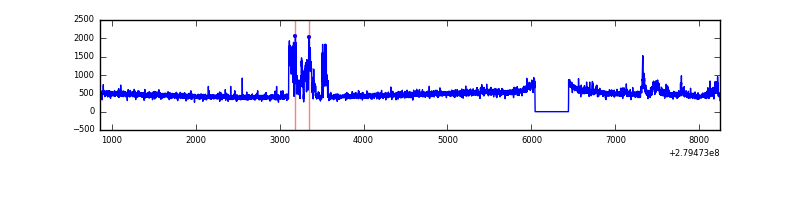 |
| B | 7385 | 6986 | 31 | 31 | 0.42% | 0.44% | 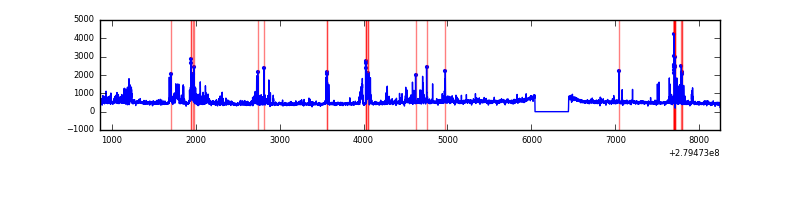 |
| C | 7385 | 6986 | 2 | 2 | 0.03% | 0.03% | 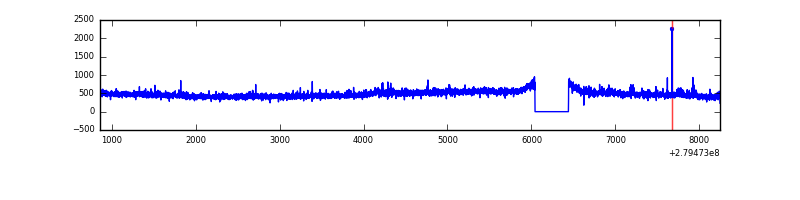 |
| D | 7385 | 6986 | 29 | 29 | 0.39% | 0.42% | 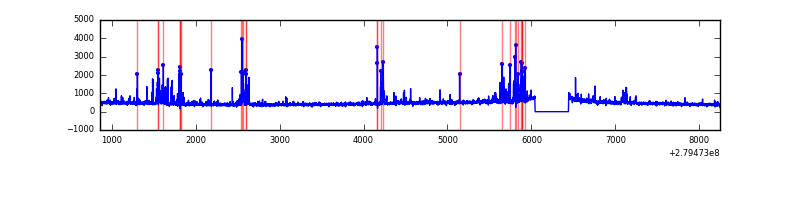 |
Top three noisy pixels from each quadrant. If the there are fewer than three noisy pixels in the level2.evt file, extra rows are filled as -1
| Pixel properties | Quadrant properties | ||||||
|---|---|---|---|---|---|---|---|
| Quadrant | DetID | PixID | Counts | Sigma | Mean | Median | Sigma |
| A | 0 | 23 | 358170 | 2115.52 | 836 | 819 | 168.9 |
| A | 0 | 226 | 28419 | 163.39 | 836 | 819 | 168.9 |
| A | 3 | 137 | 6310 | 32.51 | 836 | 819 | 168.9 |
| B | 10 | 16 | 498560 | 3084.14 | 834 | 813 | 161.4 |
| B | 0 | 229 | 73395 | 449.73 | 834 | 813 | 161.4 |
| B | 15 | 35 | 68159 | 417.29 | 834 | 813 | 161.4 |
| C | 14 | 238 | 123464 | 656.85 | 798 | 805 | 186.7 |
| C | 0 | 207 | 87523 | 464.38 | 798 | 805 | 186.7 |
| C | 3 | 233 | 23335 | 120.65 | 798 | 805 | 186.7 |
| D | 1 | 52 | 251590 | 1280.4 | 805 | 785 | 195.9 |
| D | 5 | 222 | 124007 | 629.07 | 805 | 785 | 195.9 |
| D | 10 | 70 | 52648 | 264.77 | 805 | 785 | 195.9 |
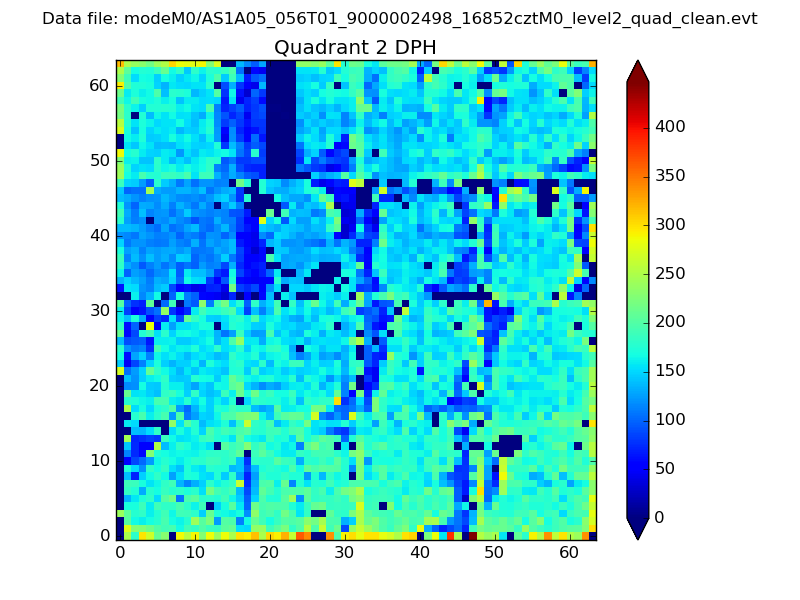
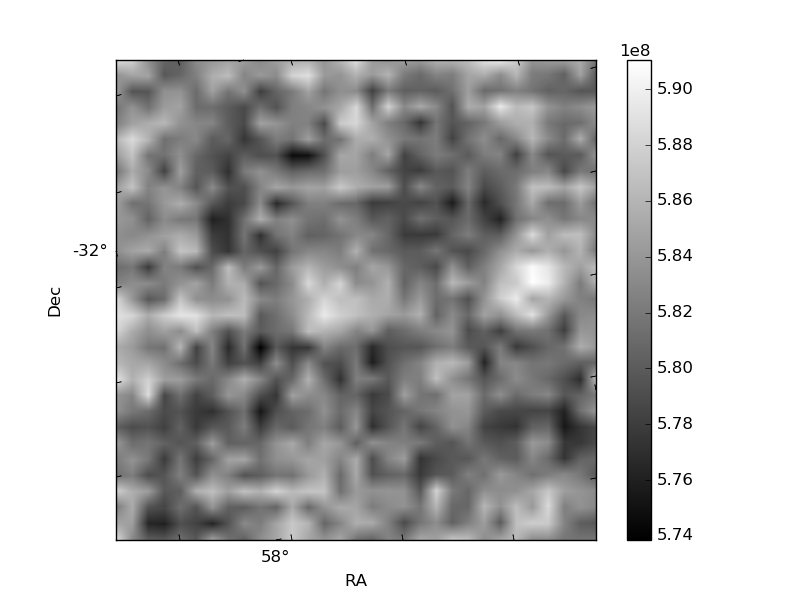
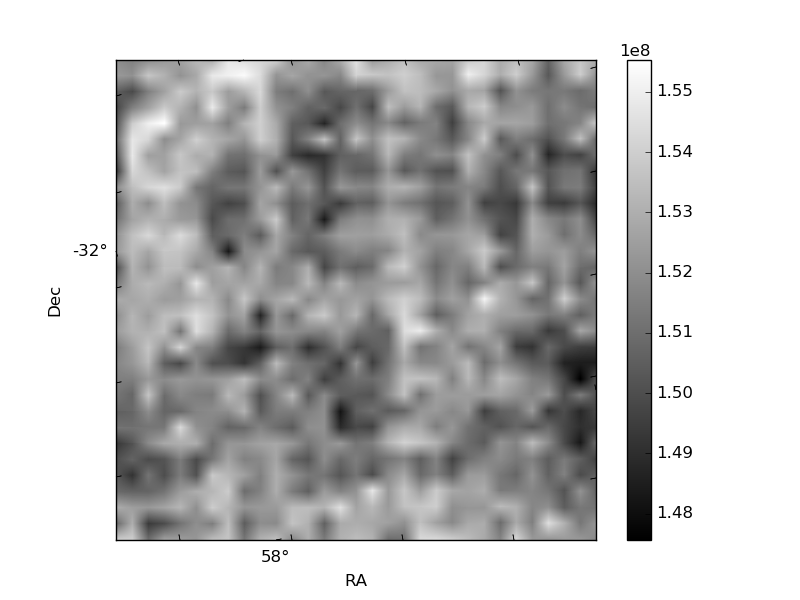
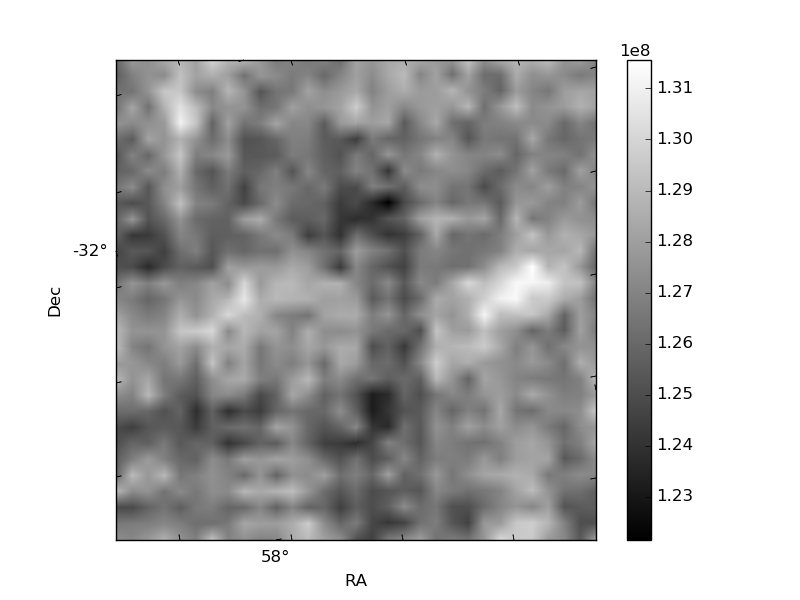
Histogram calculated using DETX and DETY for each event in the final _common_clean file
| Quadrant A | 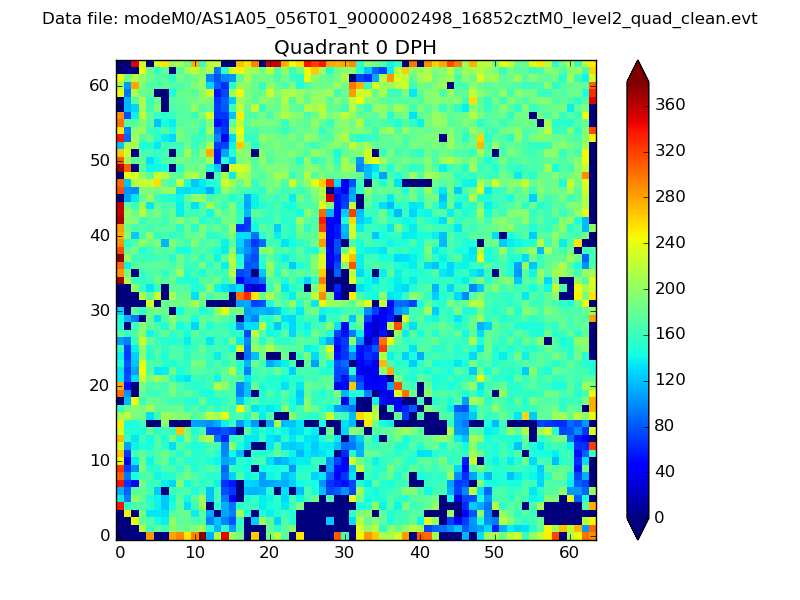 |
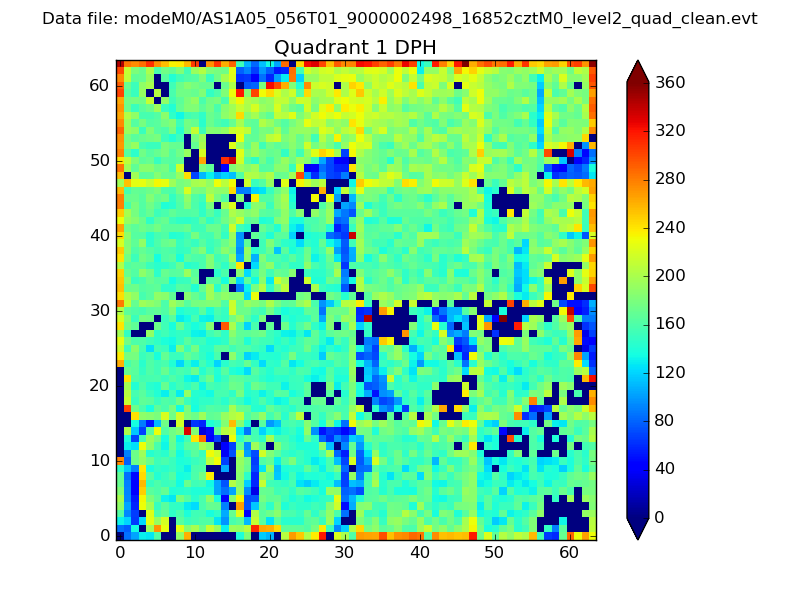 |
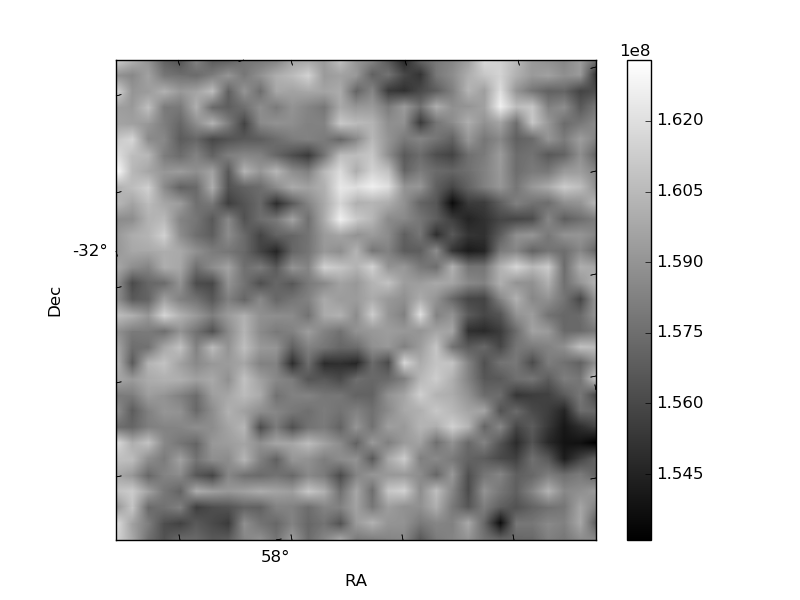
Quadrant B |
|---|---|---|---|
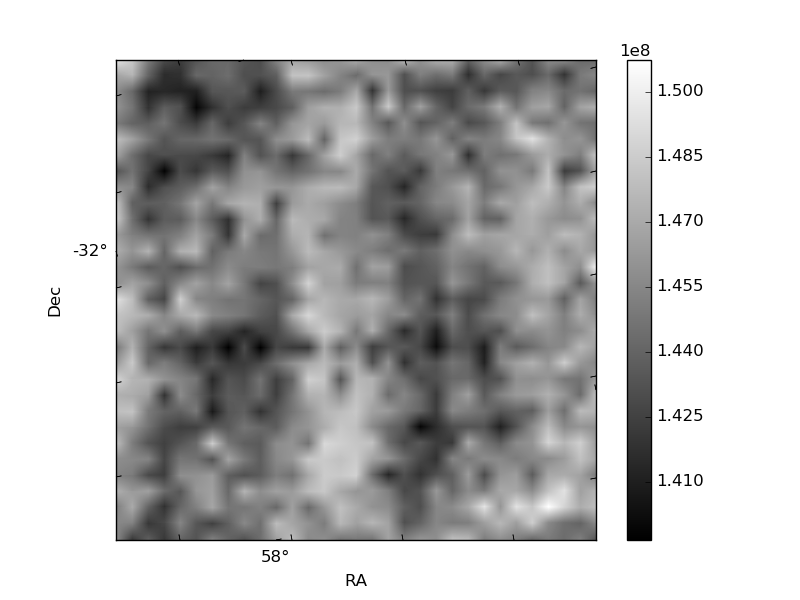
| Quadrant D | 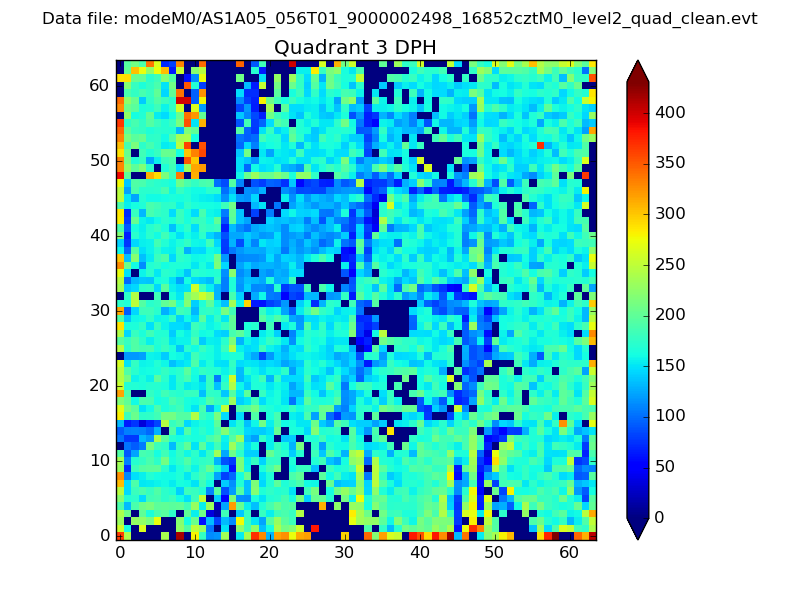 |
 |
Quadrant C |
| Plot type | Count rate plots | Images |
|---|---|---|
| Comparison with Poisson distribution Blue bars denote a histogram of data divided into 1 sec bins. Red curve is a Poisson curve with rate = median count rate of data. |
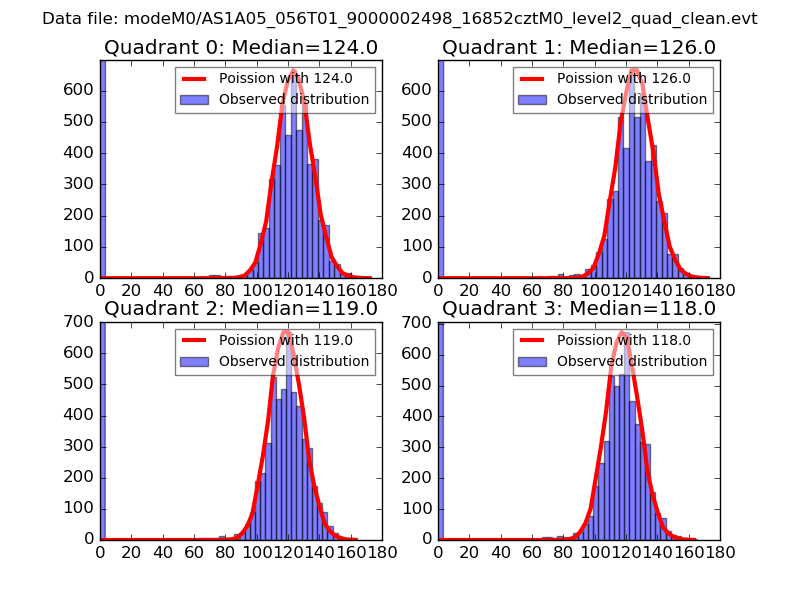 |
 |
| Quadrant-wise count rates Data is divided into 100 sec bins |
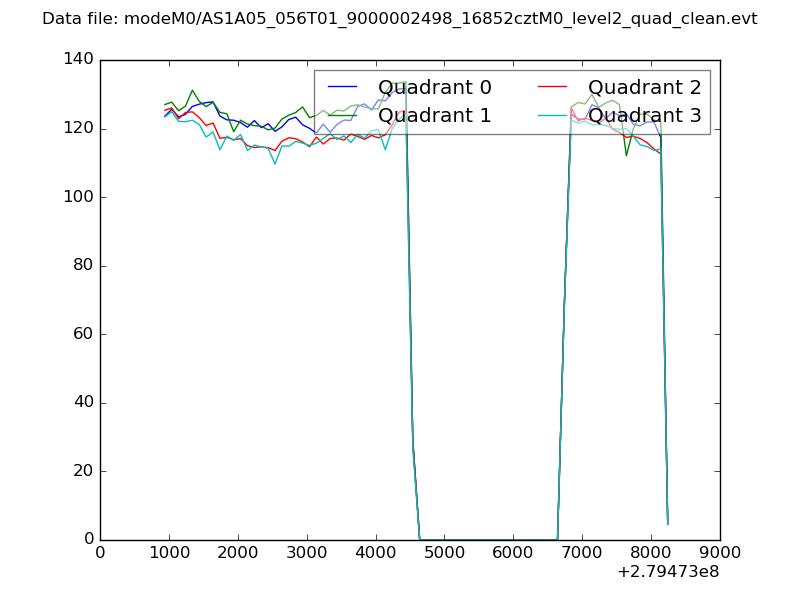 |
|
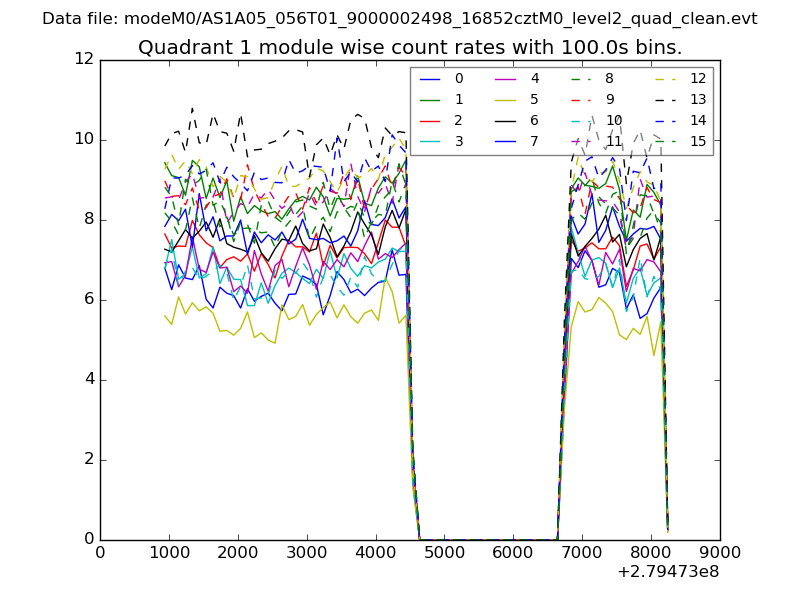
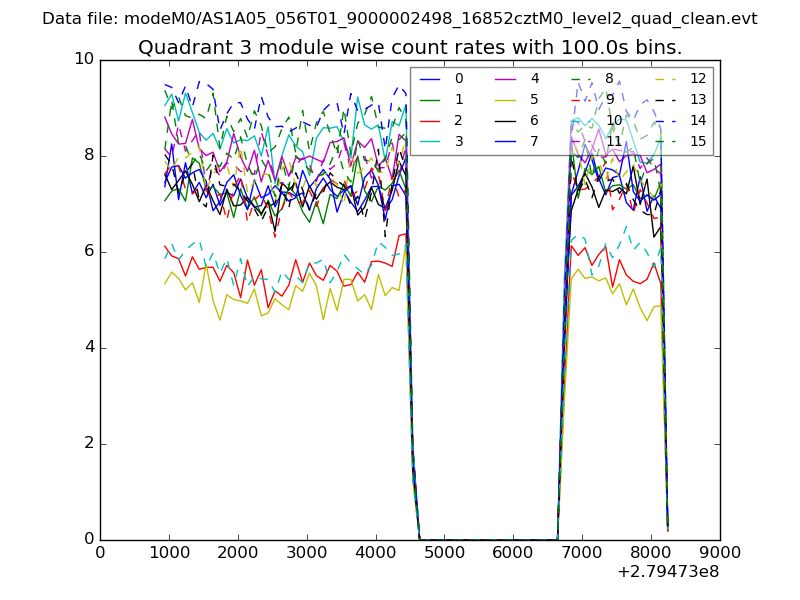
| Module-wise count rates for Quadrant A Data is divided into 100 sec bins |
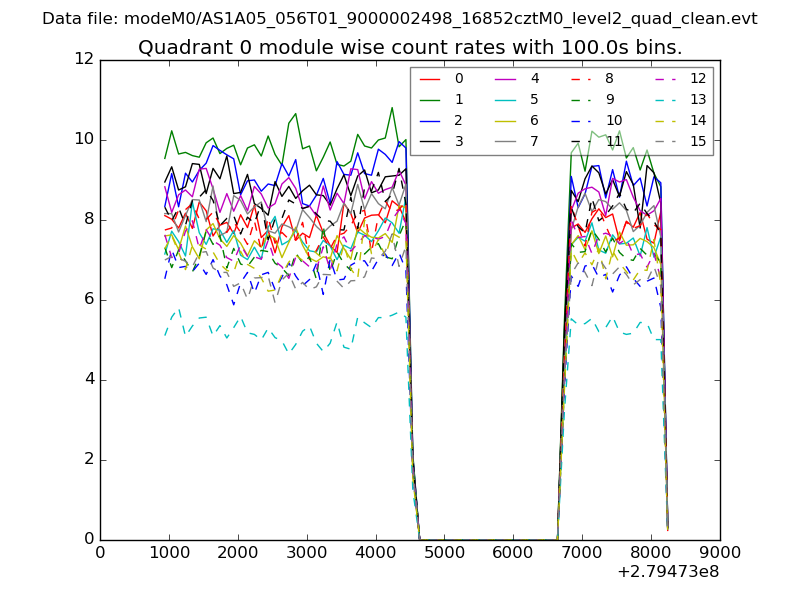 |
 |
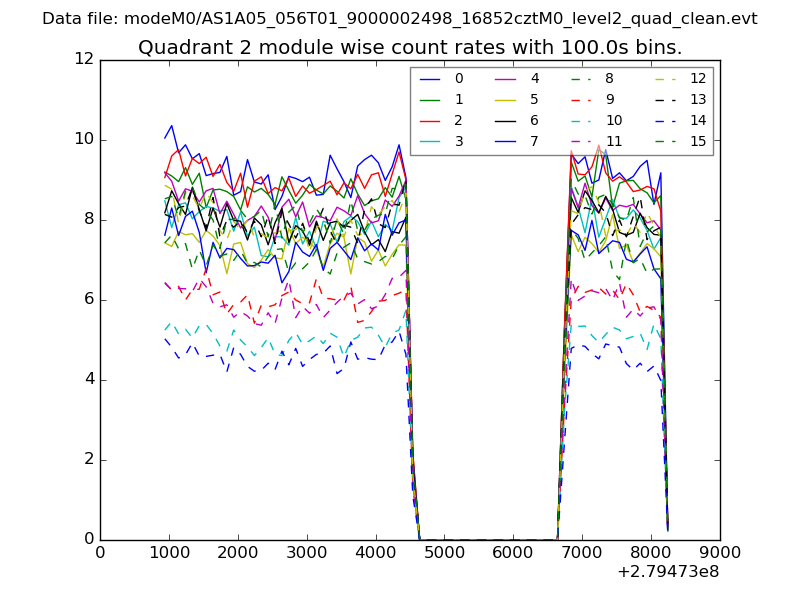
| Module-wise count rates for Quadrant B Data is divided into 100 sec bins |
 |
 |
| Module-wise count rates for Quadrant C Data is divided into 100 sec bins |
 |
 |
| Module-wise count rates for Quadrant D Data is divided into 100 sec bins |
 |
 |
| Parameter | Plot |
|---|---|
| CZT HV Monitor | 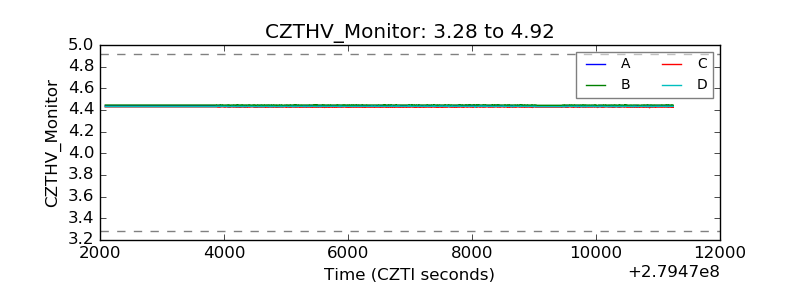 |
| D_VDD | 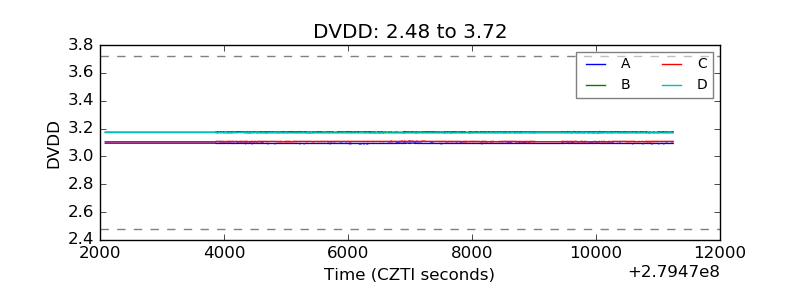 |
| Temperature 1 | 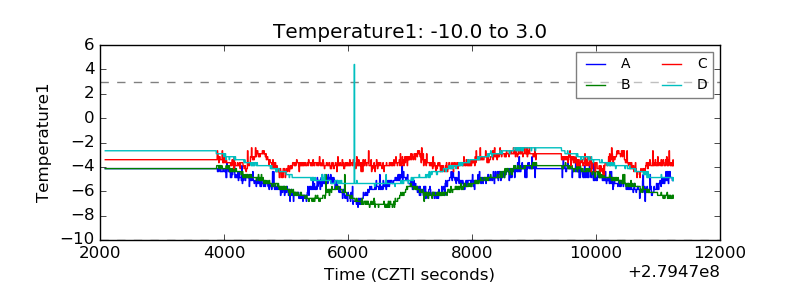 |
| Veto HV Monitor | 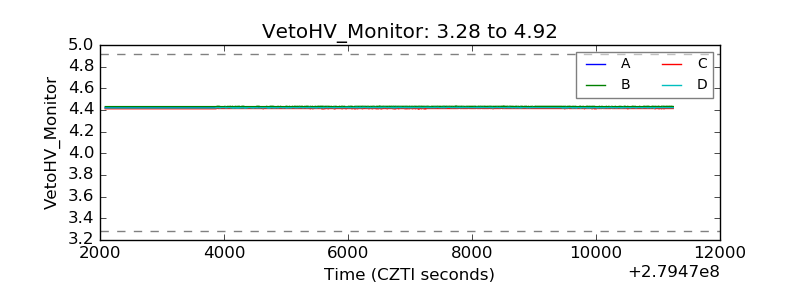 |
| Veto LLD | 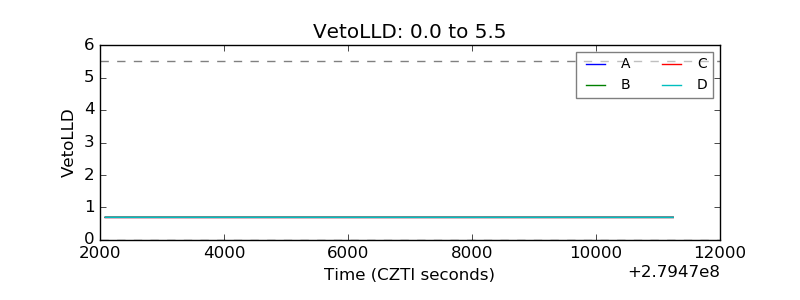 |
| Alpha Counter | 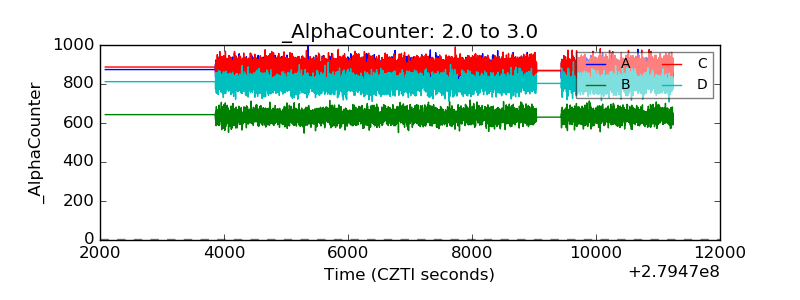 |
| _CPM_Rate | 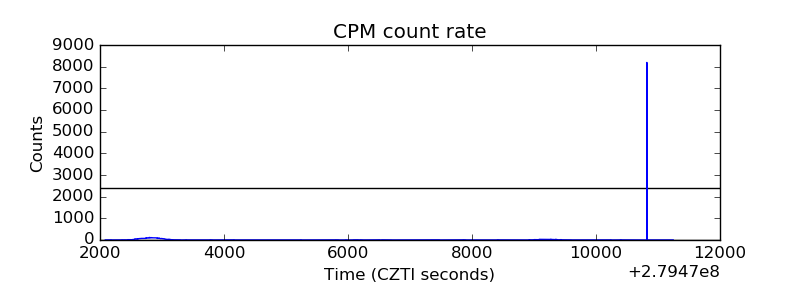 |
| CZT Counter | 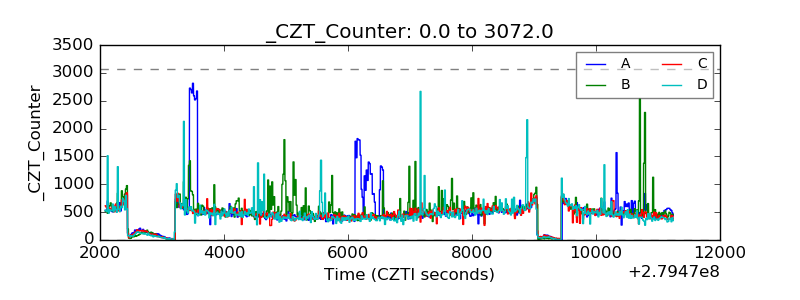 |
| +2.5 Volts monitor |  |
| +5 Volts monitor |  |
| _ROLL_ROT | 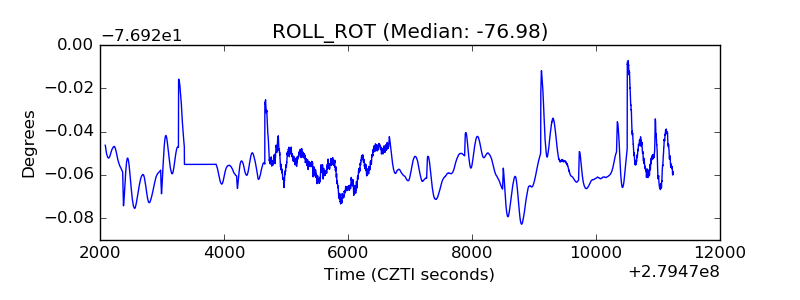 |
| _Roll_DEC | 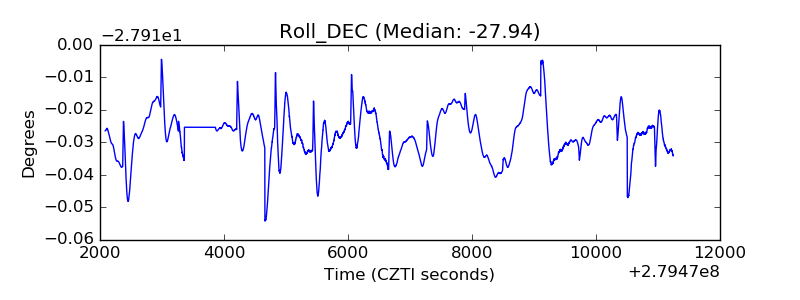 |
| _Roll_RA | 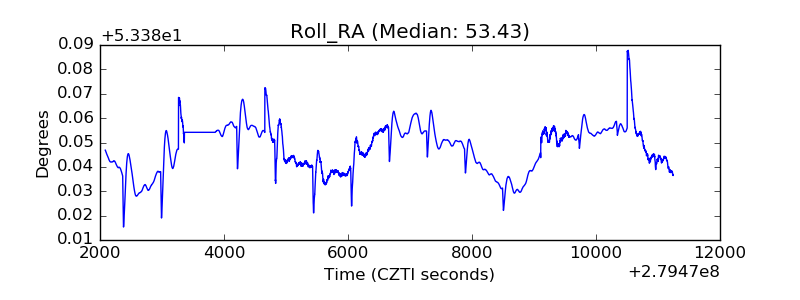 |
| Veto Counter | 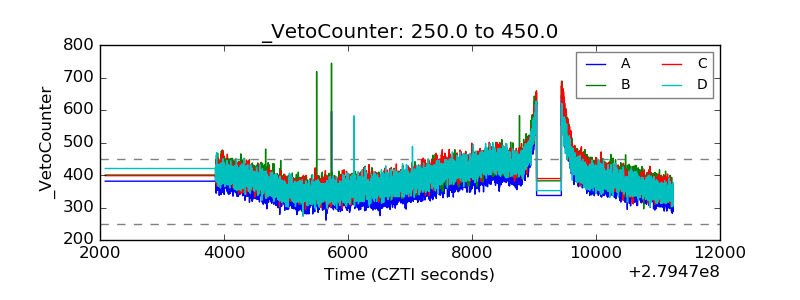 |