| Param | Original file | Final file |
|---|---|---|
| Filename | modeM0/AS1A05_056T01_9000002498_16856cztM0_level2.evt | modeM0/AS1A05_056T01_9000002498_16856cztM0_level2_quad_clean.evt |
| Size (bytes) | 1,368,506,880 | 233,801,280 |
| Size | 1.3 GB | 223.0 MB |
| Events in quadrant A | 12,758,355 | 1,455,444 |
| Events in quadrant B | 9,365,280 | 1,499,089 |
| Events in quadrant C | 8,918,710 | 1,414,562 |
| Events in quadrant D | 9,119,828 | 1,403,688 |
| Mode M9 | |||
|---|---|---|---|
| Quadrant | BADHDUFLAG | Total packets | Discarded packets |
| A | 0 | 23 | 0 |
| B | 0 | 23 | 0 |
| C | 0 | 23 | 0 |
| D | 0 | 23 | 0 |
| Mode SS | |||
|---|---|---|---|
| Quadrant | BADHDUFLAG | Total packets | Discarded packets |
| A | 0 | 386 | 0 |
| B | 0 | 386 | 0 |
| C | 0 | 386 | 0 |
| D | 0 | 386 | 0 |
| Mode M0 | |||
|---|---|---|---|
| Quadrant | BADHDUFLAG | Total packets | Discarded packets |
| A | 0 | 50442 | 5 |
| B | 0 | 40013 | 4 |
| C | 0 | 38942 | 4 |
| D | 0 | 40696 | 4 |
| Quadrant | Total seconds | Saturated seconds | Saturation percentage |
|---|---|---|---|
| A | 18997 | 760 | 4.000632% |
| B | 18997 | 177 | 0.931726% |
| C | 18997 | 147 | 0.773806% |
| D | 18997 | 71 | 0.373743% |
Noise dominated data is calculated using 1-second bins in cleaned event files. If a bin has >2000 counts, and if more than 50% of those come from <1% of pixels, then it is considered to be noise-dominated and hence unusable.
| Quadrant | # 1 sec bins | Bins with >0 counts | Bins with >2000 counts | High rate bins dominated by noise | Noise dominated (total time) | Noise dominated (detector-on time) | Marked lightcurve |
|---|---|---|---|---|---|---|---|
| A | 21223 | 19002 | 563 | 563 | 2.65% | 2.96% | 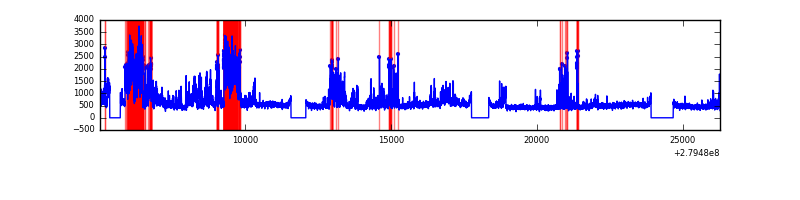 |
| B | 21223 | 19002 | 33 | 33 | 0.16% | 0.17% | 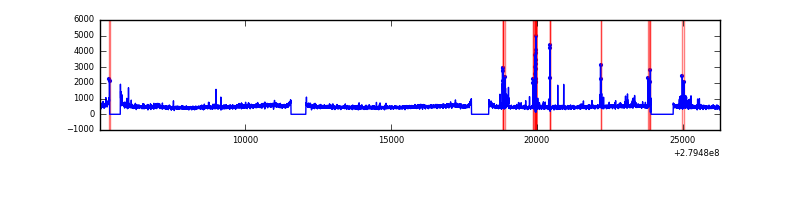 |
| C | 21223 | 19002 | 0 | 0 | 0.00% | 0.00% | 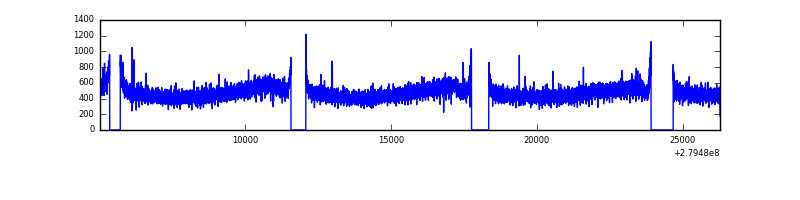 |
| D | 21223 | 19002 | 34 | 34 | 0.16% | 0.18% | 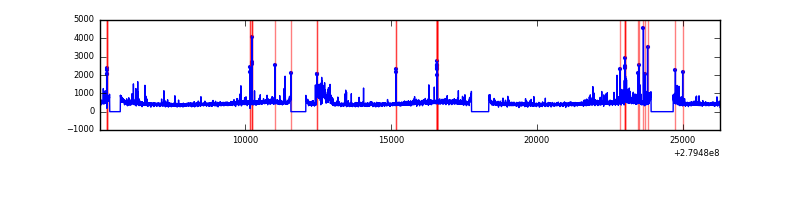 |
Top three noisy pixels from each quadrant. If the there are fewer than three noisy pixels in the level2.evt file, extra rows are filled as -1
| Pixel properties | Quadrant properties | ||||||
|---|---|---|---|---|---|---|---|
| Quadrant | DetID | PixID | Counts | Sigma | Mean | Median | Sigma |
| A | 0 | 23 | 3866867 | 8565.61 | 2251 | 2204 | 451.2 |
| A | 0 | 226 | 245346 | 538.9 | 2251 | 2204 | 451.2 |
| A | 9 | 143 | 23366 | 46.9 | 2251 | 2204 | 451.2 |
| B | 10 | 16 | 255144 | 582.78 | 2271 | 2210 | 434.0 |
| B | 15 | 35 | 85361 | 191.58 | 2271 | 2210 | 434.0 |
| B | 0 | 229 | 79457 | 177.98 | 2271 | 2210 | 434.0 |
| C | 14 | 238 | 334289 | 650.09 | 2186 | 2202 | 510.8 |
| C | 3 | 233 | 36021 | 66.2 | 2186 | 2202 | 510.8 |
| C | 0 | 207 | 30014 | 54.44 | 2186 | 2202 | 510.8 |
| D | 1 | 52 | 341487 | 631.57 | 2204 | 2144 | 537.3 |
| D | 5 | 222 | 333132 | 616.02 | 2204 | 2144 | 537.3 |
| D | 15 | 145 | 103488 | 188.62 | 2204 | 2144 | 537.3 |
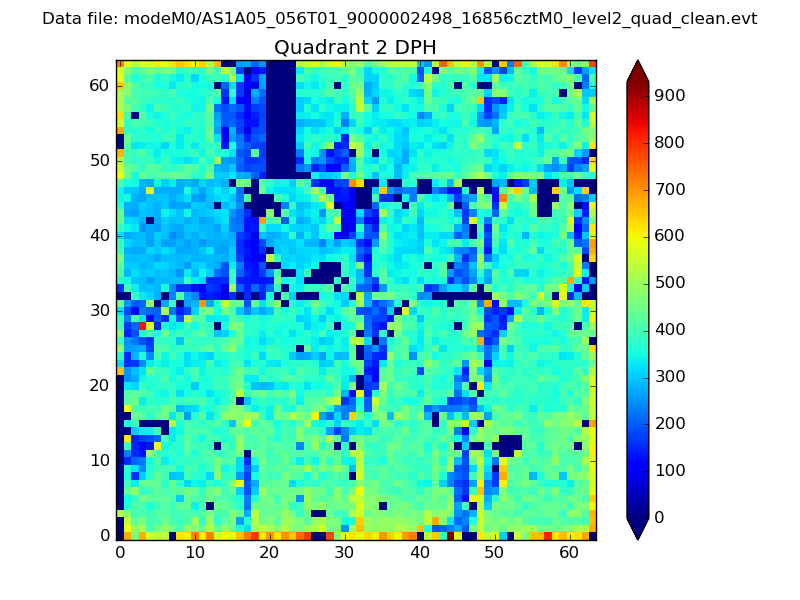
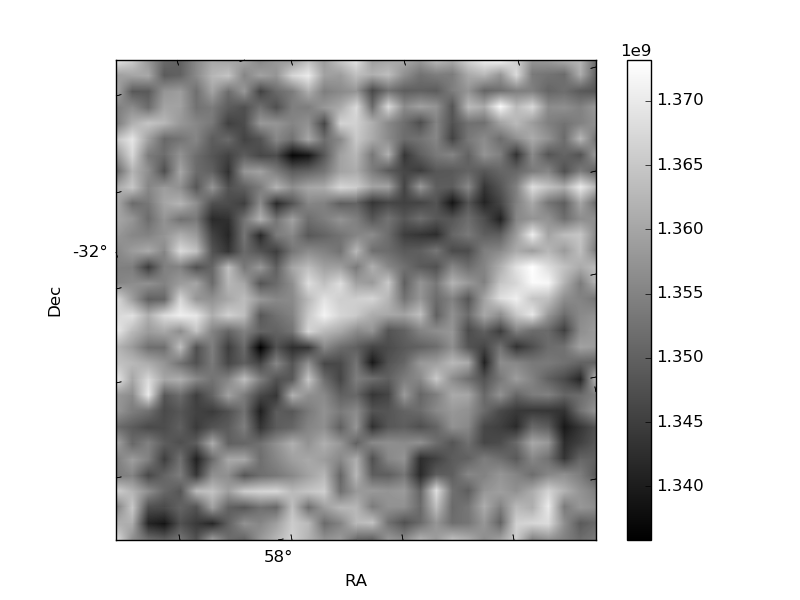
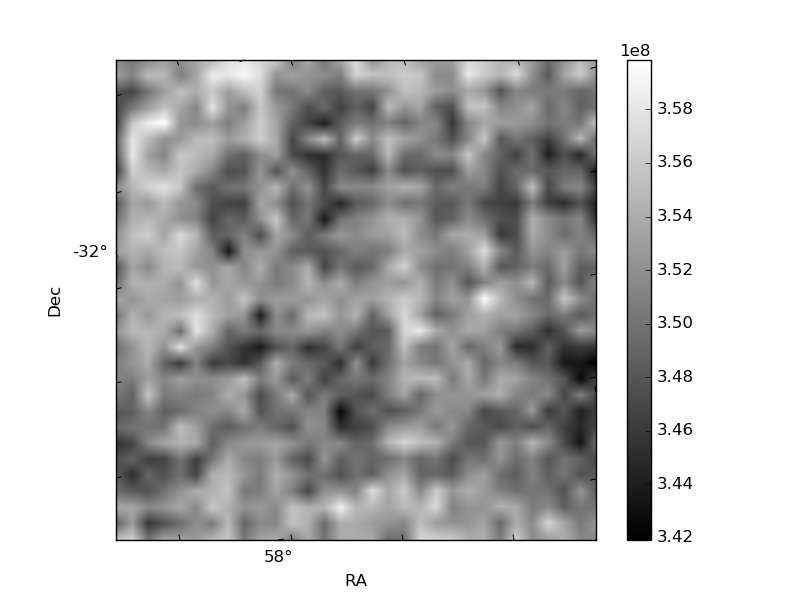
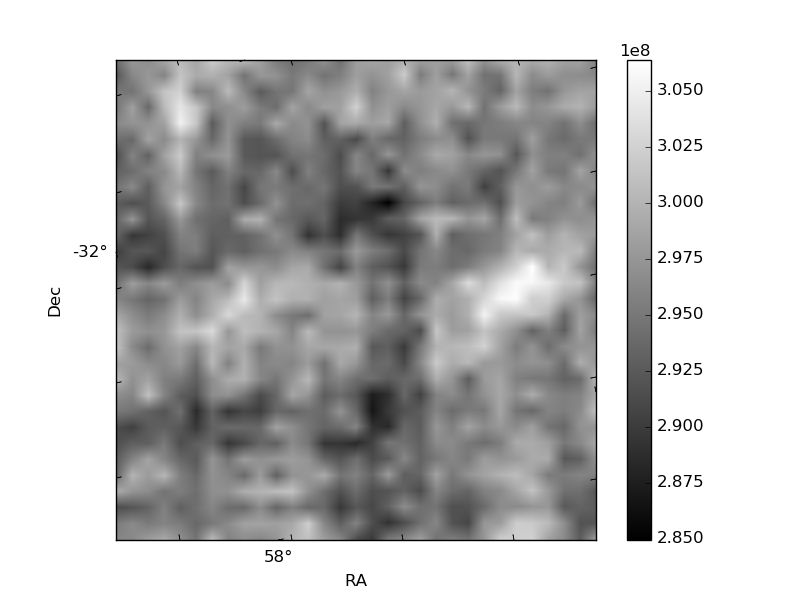
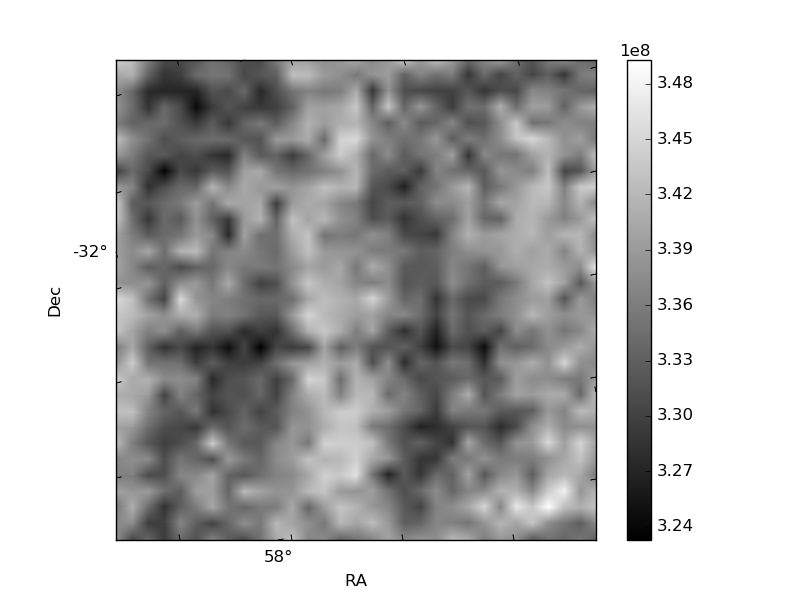
Histogram calculated using DETX and DETY for each event in the final _common_clean file
| Quadrant A | 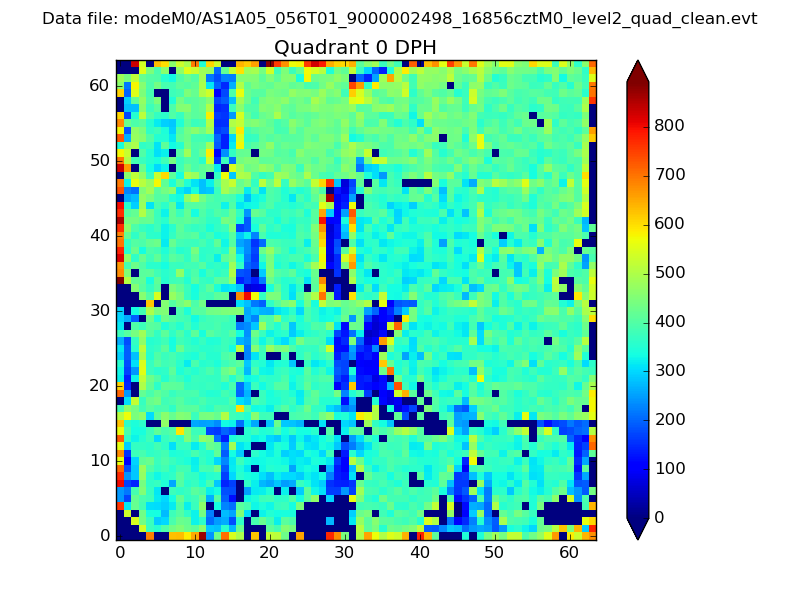 |
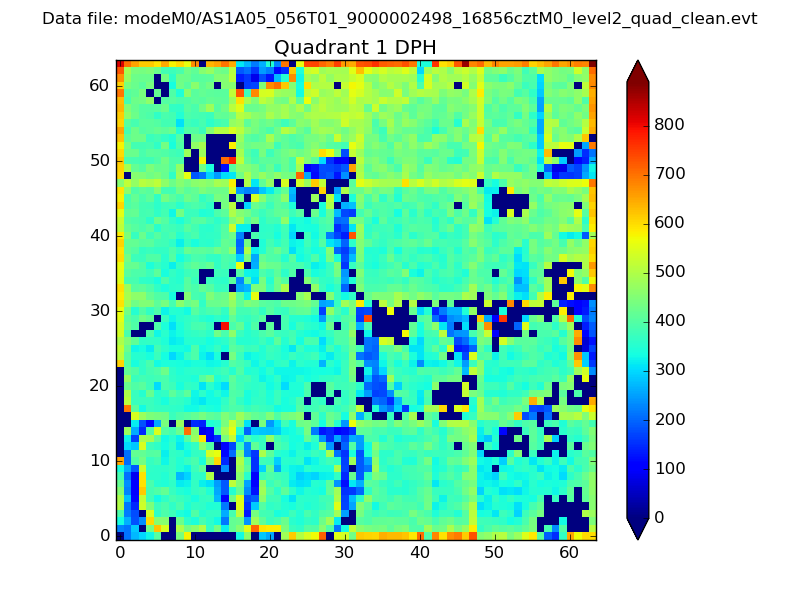 |
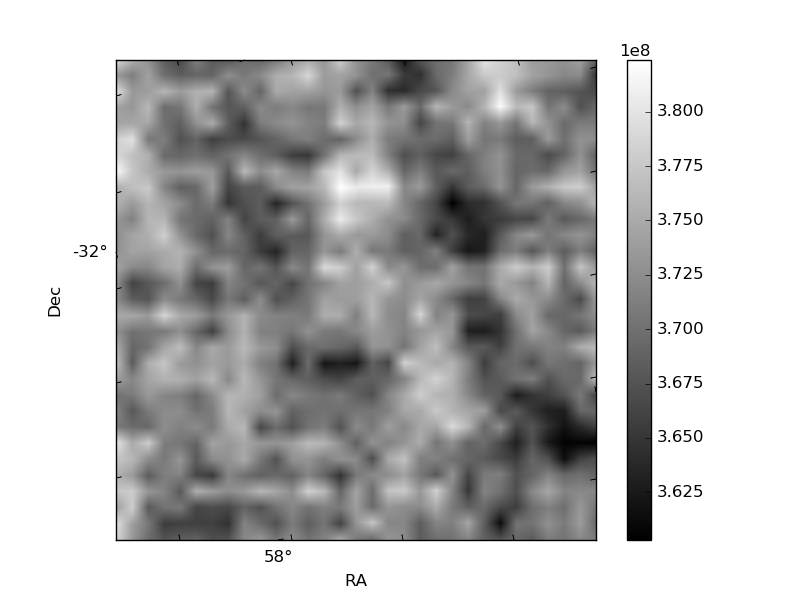
Quadrant B |
|---|---|---|---|
| Quadrant D | 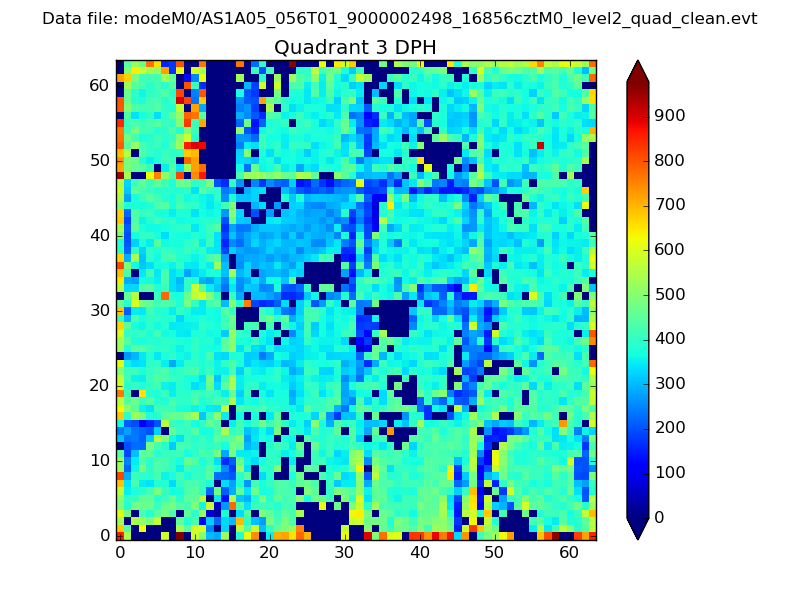 |
 |
Quadrant C |
| Plot type | Count rate plots | Images |
|---|---|---|
| Comparison with Poisson distribution Blue bars denote a histogram of data divided into 1 sec bins. Red curve is a Poisson curve with rate = median count rate of data. |
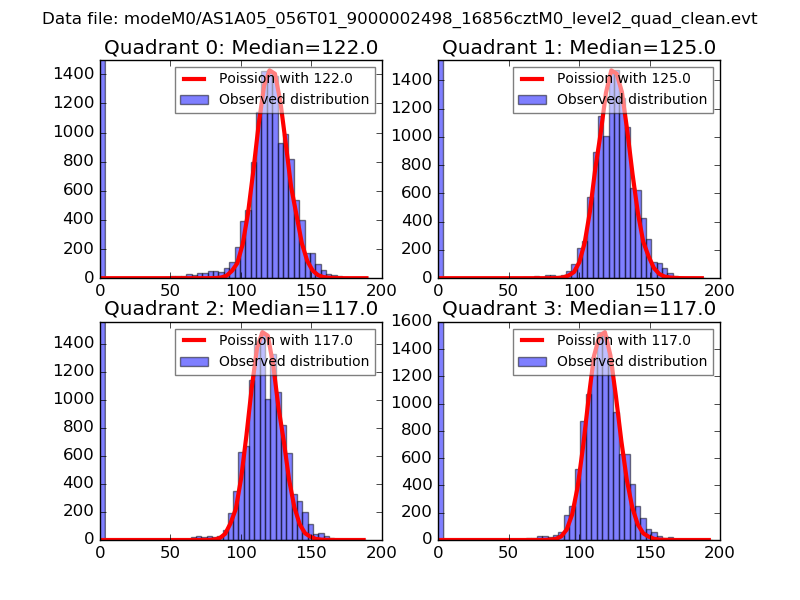 |
 |
| Quadrant-wise count rates Data is divided into 100 sec bins |
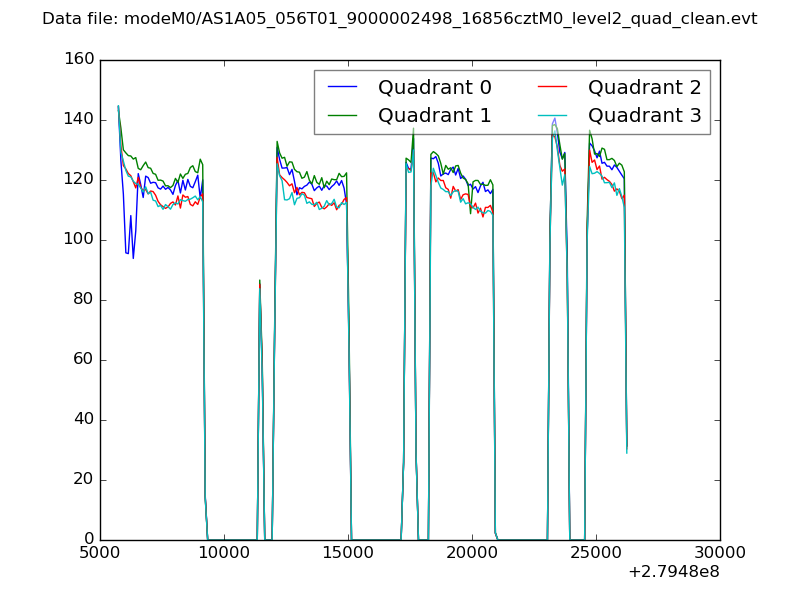 |
|
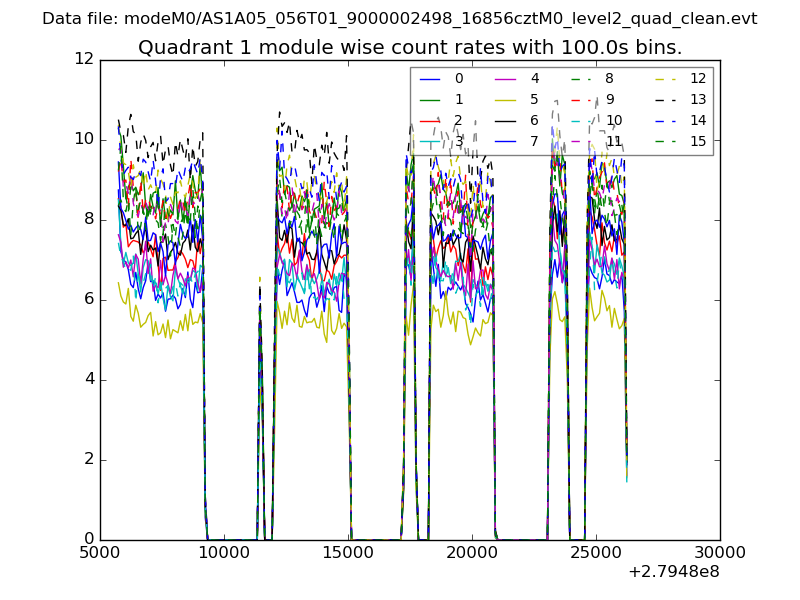
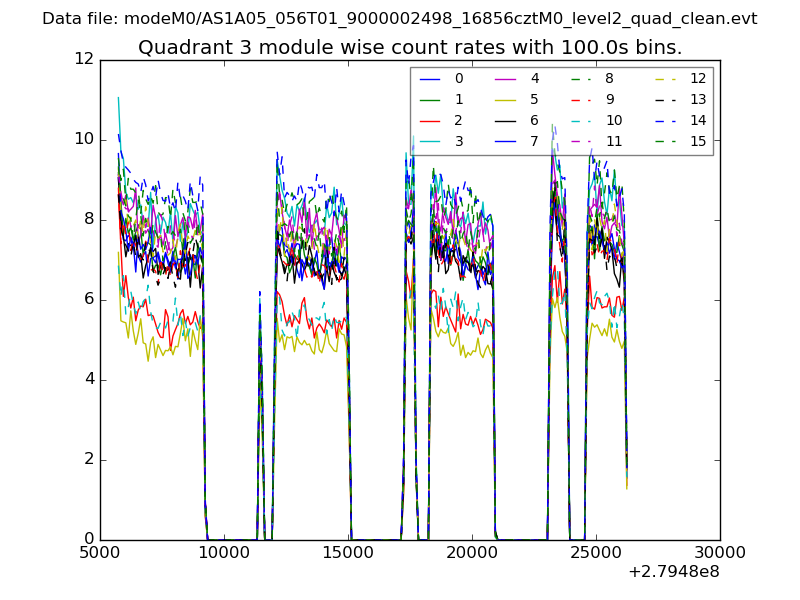
| Module-wise count rates for Quadrant A Data is divided into 100 sec bins |
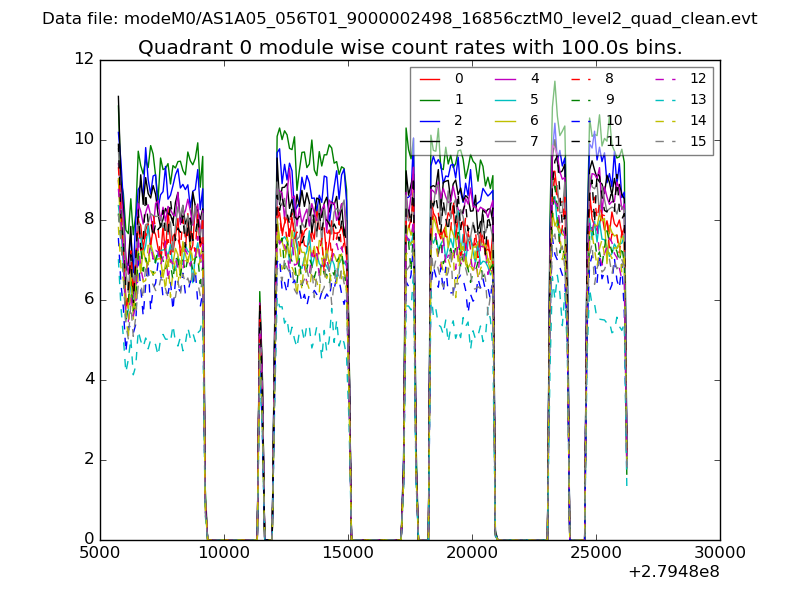 |
 |
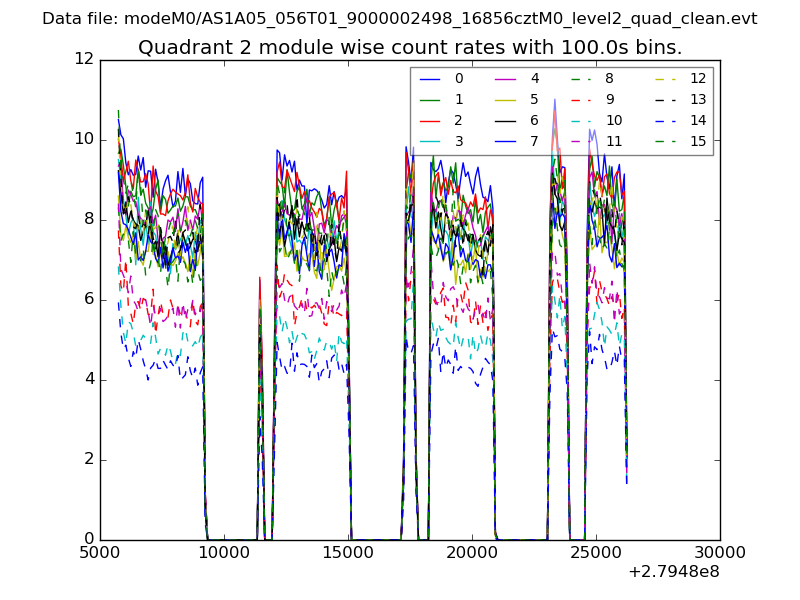
| Module-wise count rates for Quadrant B Data is divided into 100 sec bins |
 |
 |
| Module-wise count rates for Quadrant C Data is divided into 100 sec bins |
 |
 |
| Module-wise count rates for Quadrant D Data is divided into 100 sec bins |
 |
 |
| Parameter | Plot |
|---|---|
| CZT HV Monitor | 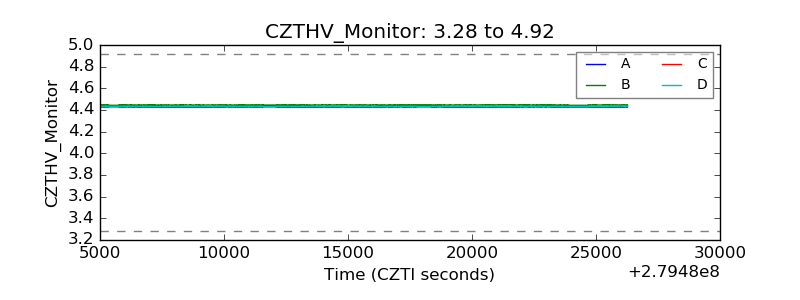 |
| D_VDD | 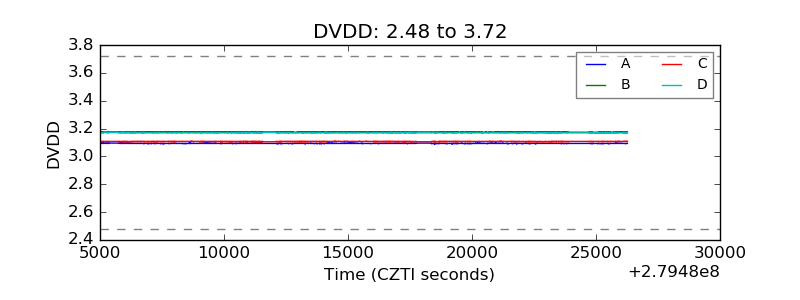 |
| Temperature 1 | 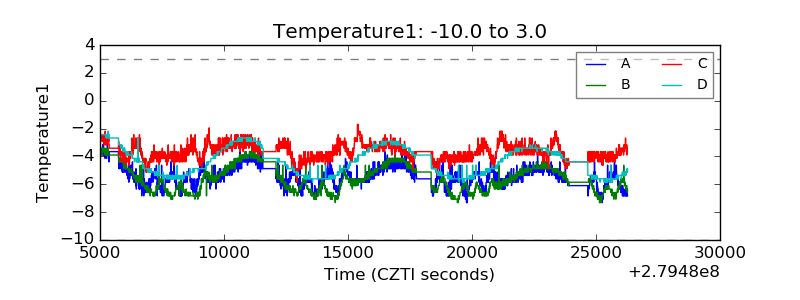 |
| Veto HV Monitor |  |
| Veto LLD | 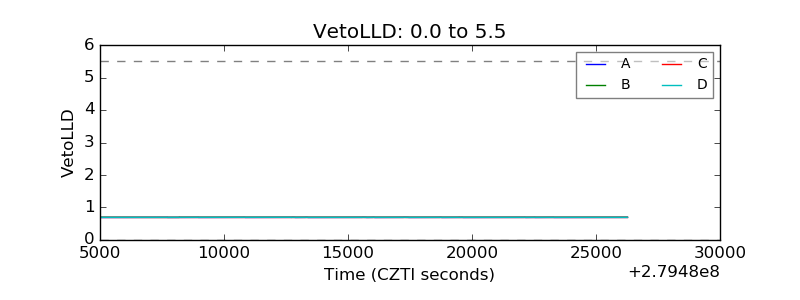 |
| Alpha Counter | 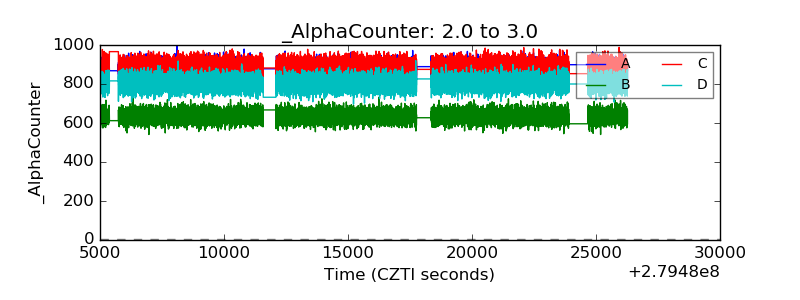 |
| _CPM_Rate | 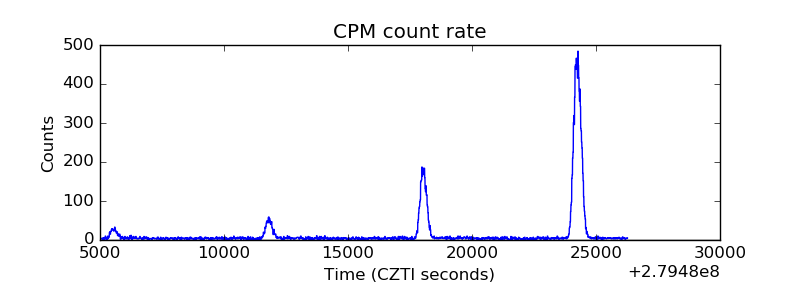 |
| CZT Counter | 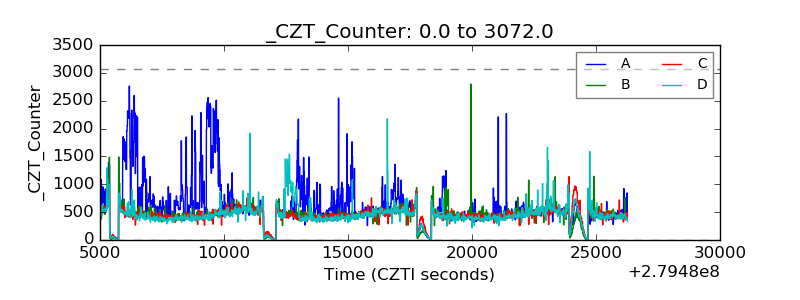 |
| +2.5 Volts monitor |  |
| +5 Volts monitor |  |
| _ROLL_ROT | 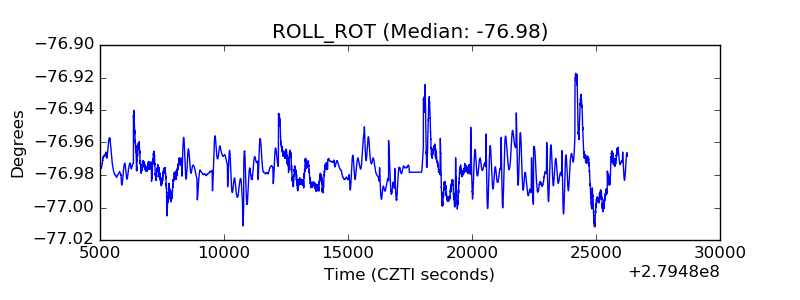 |
| _Roll_DEC | 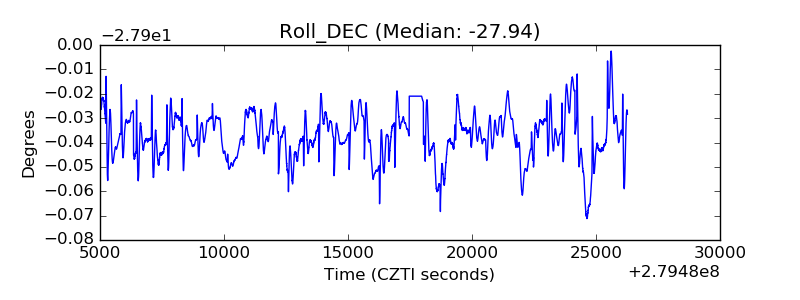 |
| _Roll_RA | 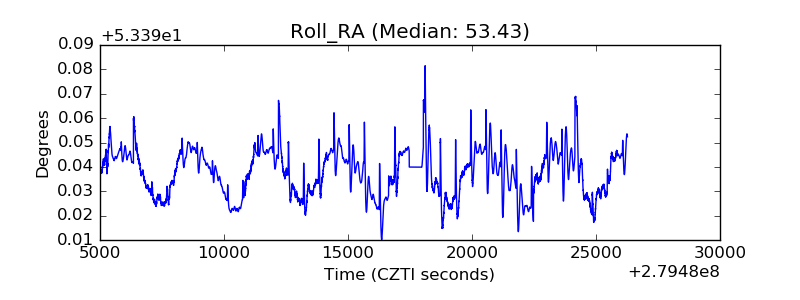 |
| Veto Counter | 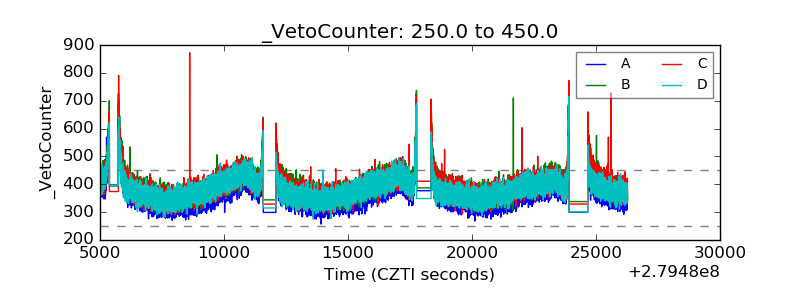 |