| Param | Original file | Final file |
|---|---|---|
| Filename | modeM0/AS1A05_056T01_9000002498_16861cztM0_level2.evt | modeM0/AS1A05_056T01_9000002498_16861cztM0_level2_quad_clean.evt |
| Size (bytes) | 380,810,880 | 60,024,960 |
| Size | 363.2 MB | 57.2 MB |
| Events in quadrant A | 3,357,104 | 363,256 |
| Events in quadrant B | 2,457,700 | 385,507 |
| Events in quadrant C | 2,418,034 | 365,611 |
| Events in quadrant D | 2,961,984 | 354,494 |
| Mode M9 | |||
|---|---|---|---|
| Quadrant | BADHDUFLAG | Total packets | Discarded packets |
| A | 0 | 10 | 0 |
| B | 0 | 10 | 0 |
| C | 0 | 10 | 0 |
| D | 0 | 10 | 0 |
| Mode SS | |||
|---|---|---|---|
| Quadrant | BADHDUFLAG | Total packets | Discarded packets |
| A | 0 | 102 | 0 |
| B | 0 | 102 | 0 |
| C | 0 | 102 | 0 |
| D | 0 | 102 | 0 |
| Mode M0 | |||
|---|---|---|---|
| Quadrant | BADHDUFLAG | Total packets | Discarded packets |
| A | 0 | 13198 | 1 |
| B | 0 | 10425 | 1 |
| C | 0 | 10244 | 1 |
| D | 0 | 12037 | 1 |
| Quadrant | Total seconds | Saturated seconds | Saturation percentage |
|---|---|---|---|
| A | 4965 | 302 | 6.082578% |
| B | 4965 | 55 | 1.107754% |
| C | 4965 | 77 | 1.550856% |
| D | 4965 | 151 | 3.041289% |
Noise dominated data is calculated using 1-second bins in cleaned event files. If a bin has >2000 counts, and if more than 50% of those come from <1% of pixels, then it is considered to be noise-dominated and hence unusable.
| Quadrant | # 1 sec bins | Bins with >0 counts | Bins with >2000 counts | High rate bins dominated by noise | Noise dominated (total time) | Noise dominated (detector-on time) | Marked lightcurve |
|---|---|---|---|---|---|---|---|
| A | 5976 | 4967 | 148 | 148 | 2.48% | 2.98% | 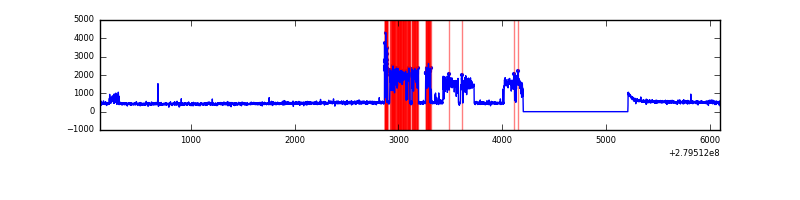 |
| B | 5976 | 4967 | 1 | 1 | 0.02% | 0.02% | 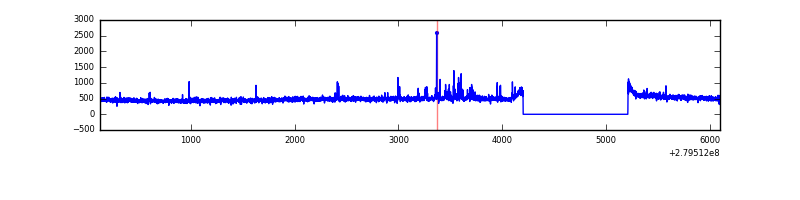 |
| C | 5976 | 4967 | 0 | 0 | 0.00% | 0.00% | 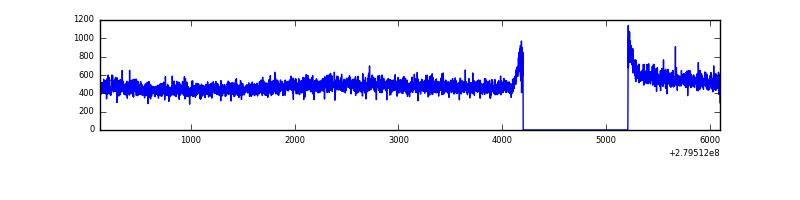 |
| D | 5976 | 4967 | 84 | 84 | 1.41% | 1.69% | 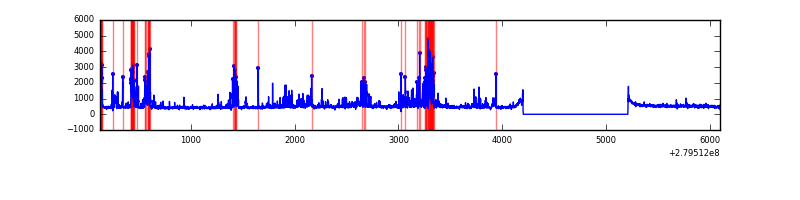 |
Top three noisy pixels from each quadrant. If the there are fewer than three noisy pixels in the level2.evt file, extra rows are filled as -1
| Pixel properties | Quadrant properties | ||||||
|---|---|---|---|---|---|---|---|
| Quadrant | DetID | PixID | Counts | Sigma | Mean | Median | Sigma |
| A | 0 | 23 | 984243 | 8055.92 | 601 | 587 | 122.1 |
| A | 0 | 226 | 64382 | 522.46 | 601 | 587 | 122.1 |
| A | 9 | 143 | 4538 | 32.35 | 601 | 587 | 122.1 |
| B | 10 | 16 | 45933 | 388.79 | 609 | 595 | 116.6 |
| B | 12 | 111 | 14625 | 120.31 | 609 | 595 | 116.6 |
| B | 15 | 35 | 13833 | 113.52 | 609 | 595 | 116.6 |
| C | 14 | 238 | 90408 | 643.05 | 592 | 595 | 139.7 |
| C | 3 | 233 | 16677 | 115.14 | 592 | 595 | 139.7 |
| C | 13 | 61 | 4181 | 25.68 | 592 | 595 | 139.7 |
| D | 1 | 52 | 415425 | 2859.59 | 593 | 577 | 145.1 |
| D | 13 | 104 | 225003 | 1546.99 | 593 | 577 | 145.1 |
| D | 10 | 70 | 45262 | 308.02 | 593 | 577 | 145.1 |
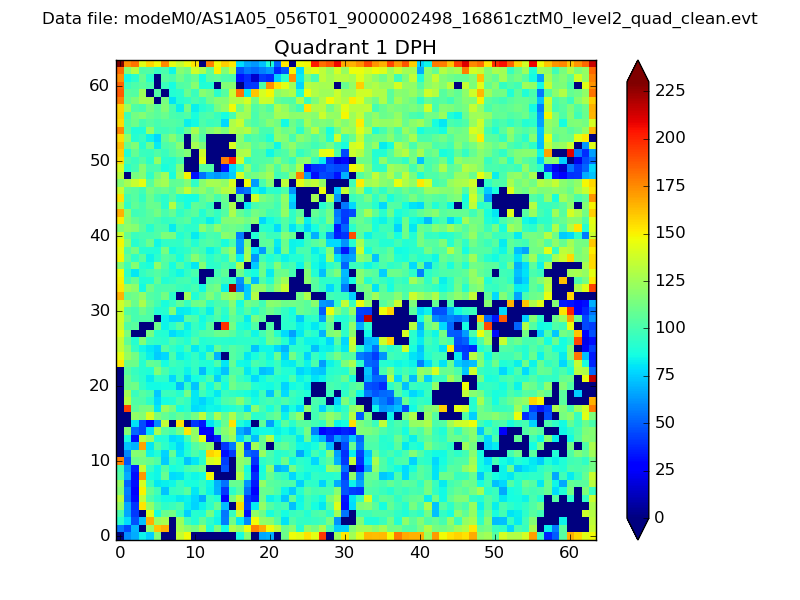
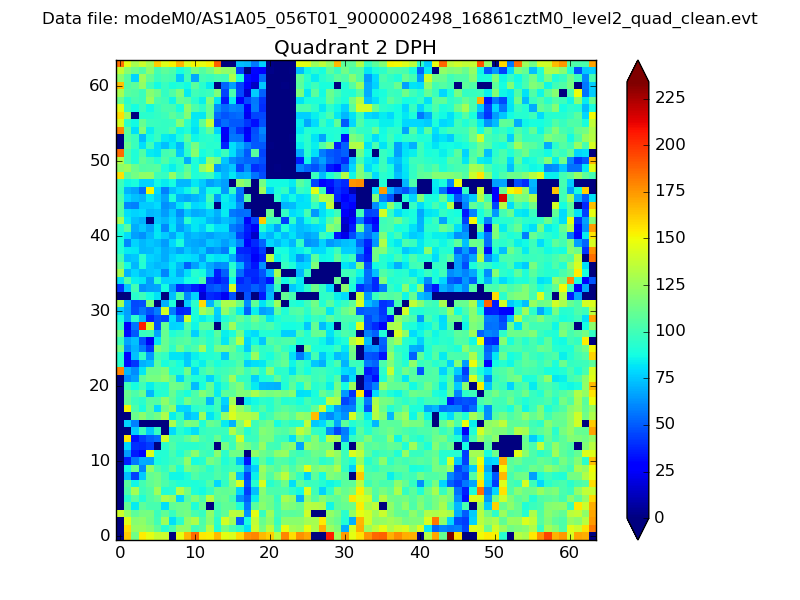
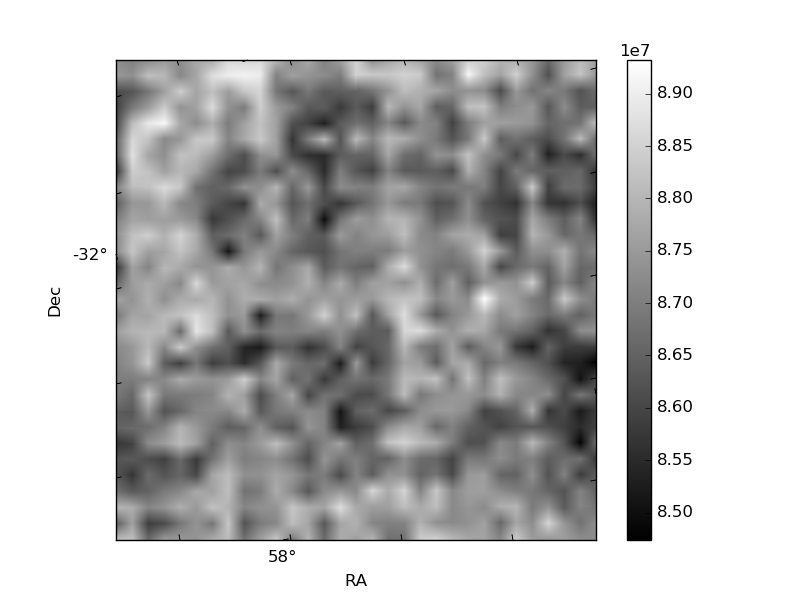
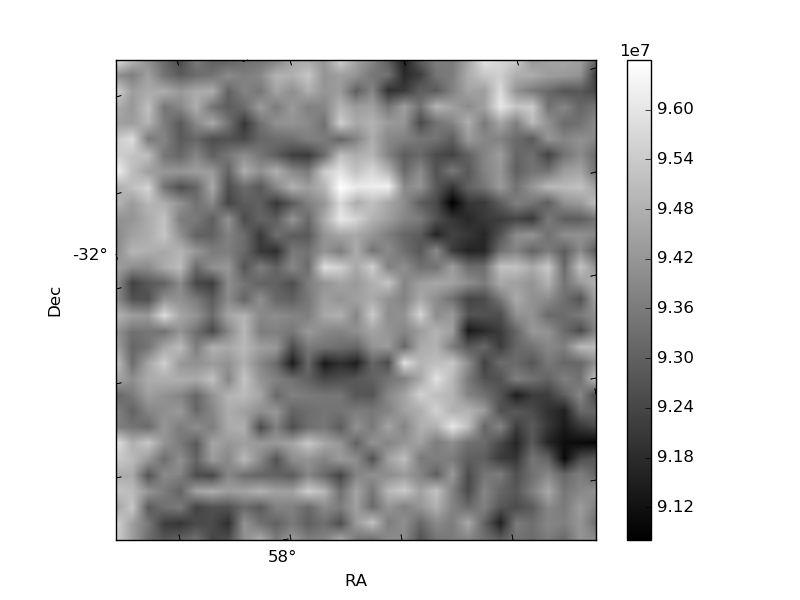
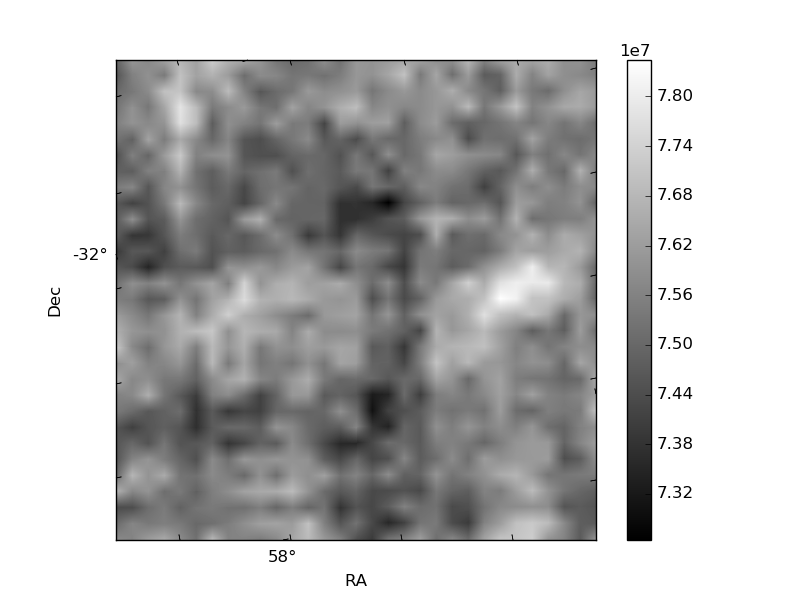
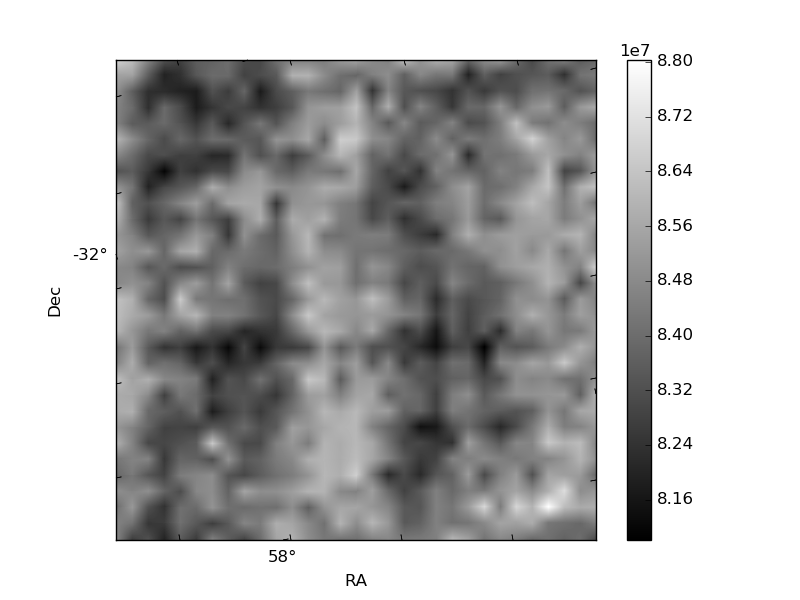
Histogram calculated using DETX and DETY for each event in the final _common_clean file
| Quadrant A |  |
 |
Quadrant B |
|---|---|---|---|
| Quadrant D |  |
 |
Quadrant C |
| Plot type | Count rate plots | Images |
|---|---|---|
| Comparison with Poisson distribution Blue bars denote a histogram of data divided into 1 sec bins. Red curve is a Poisson curve with rate = median count rate of data. |
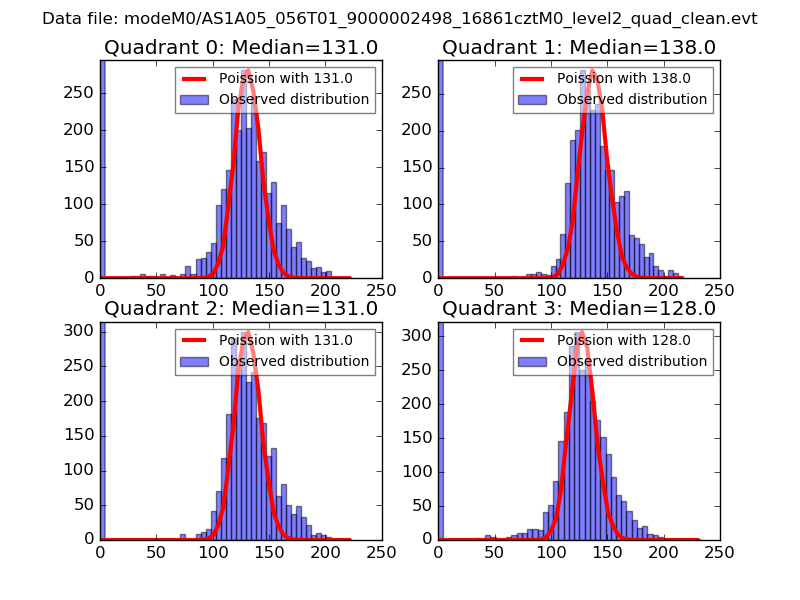 |
 |
| Quadrant-wise count rates Data is divided into 100 sec bins |
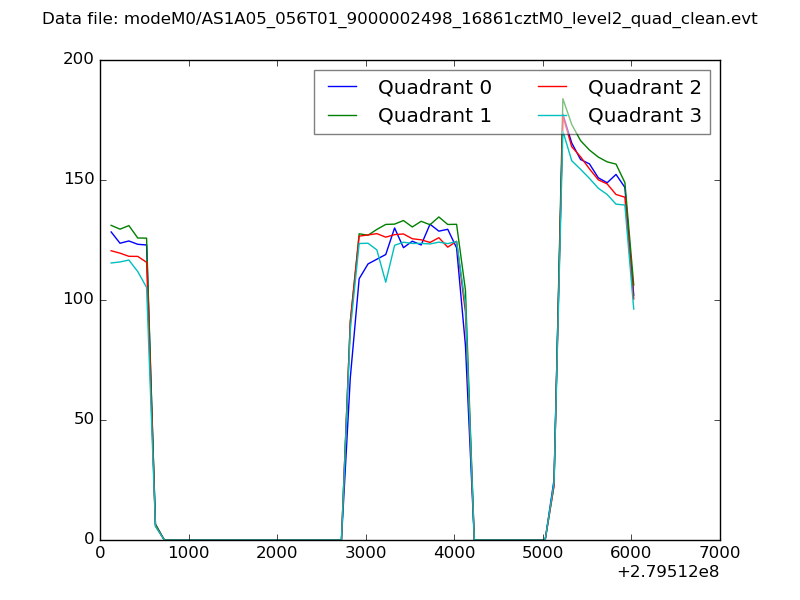 |
|
| Module-wise count rates for Quadrant A Data is divided into 100 sec bins |
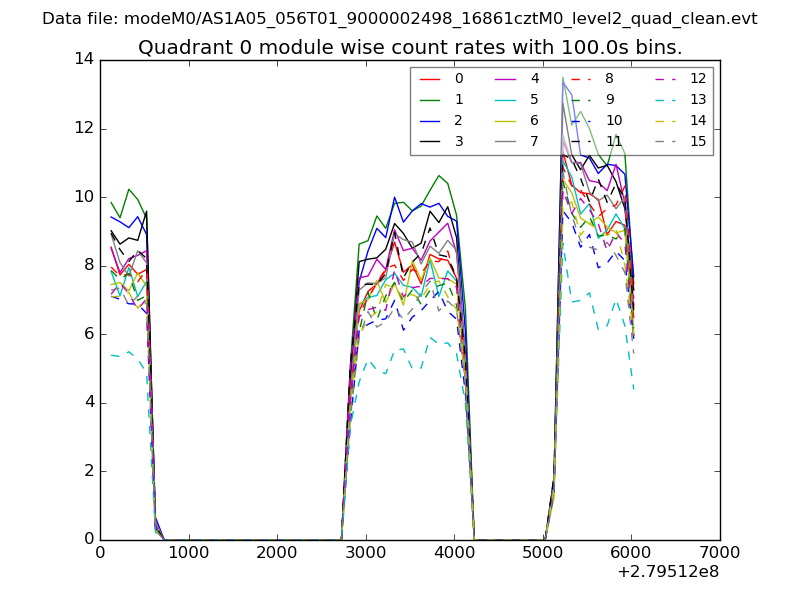 |
 |
| Module-wise count rates for Quadrant B Data is divided into 100 sec bins |
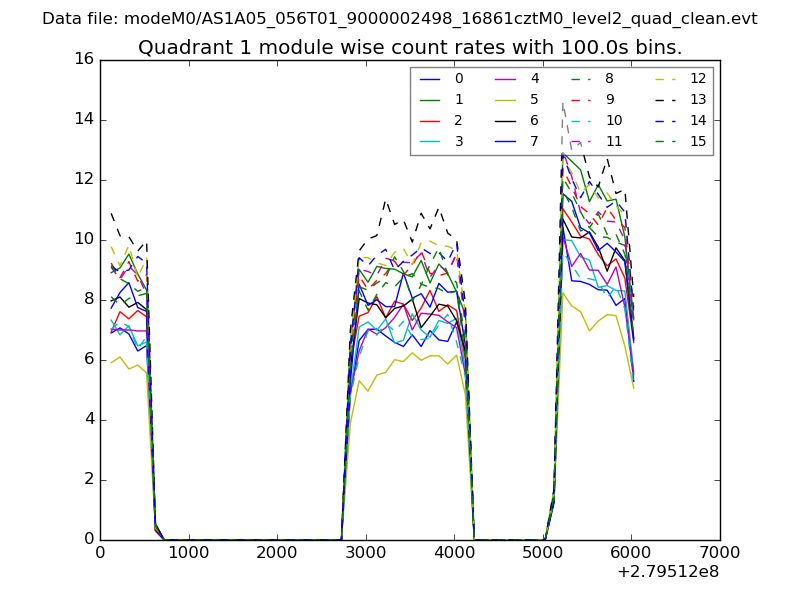 |
 |
| Module-wise count rates for Quadrant C Data is divided into 100 sec bins |
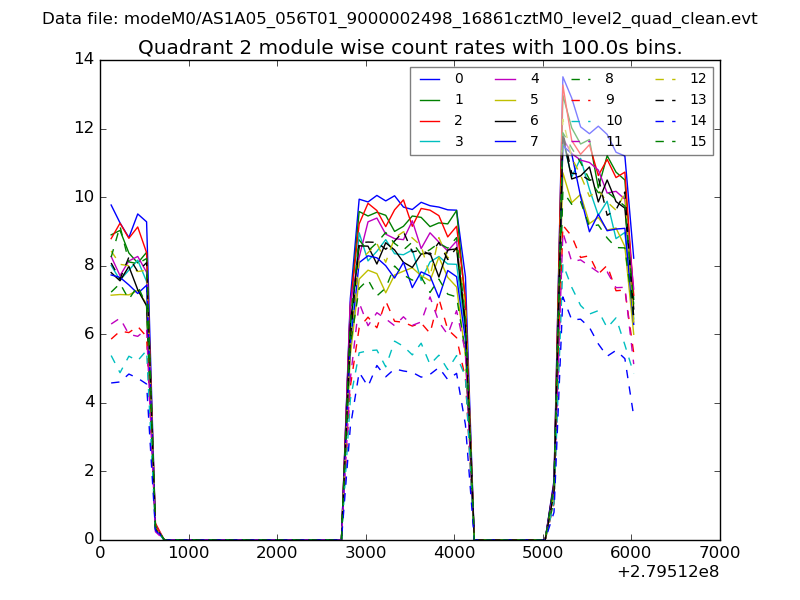 |
 |
| Module-wise count rates for Quadrant D Data is divided into 100 sec bins |
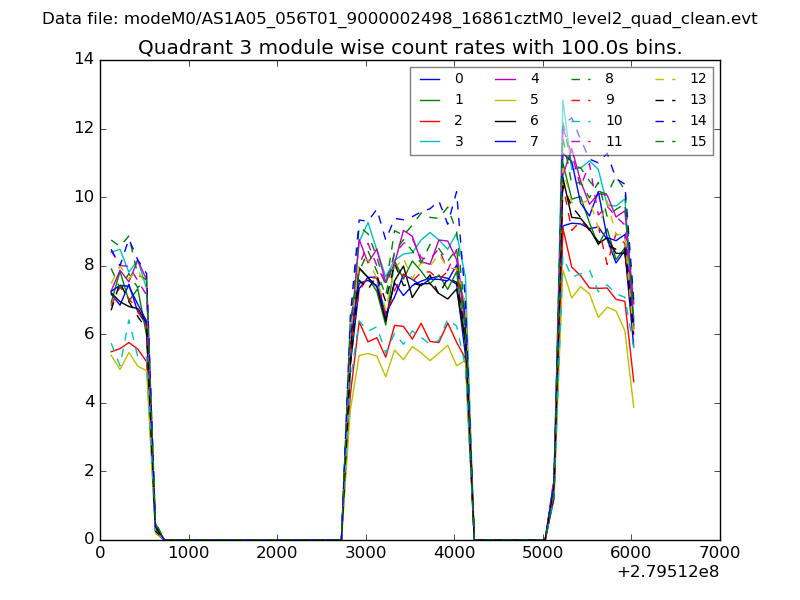 |
 |
| Parameter | Plot |
|---|---|
| CZT HV Monitor | 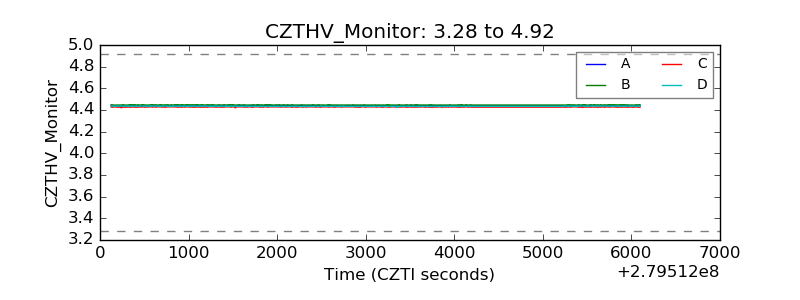 |
| D_VDD | 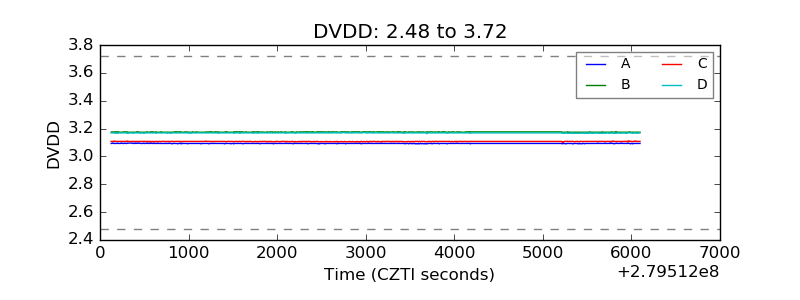 |
| Temperature 1 | 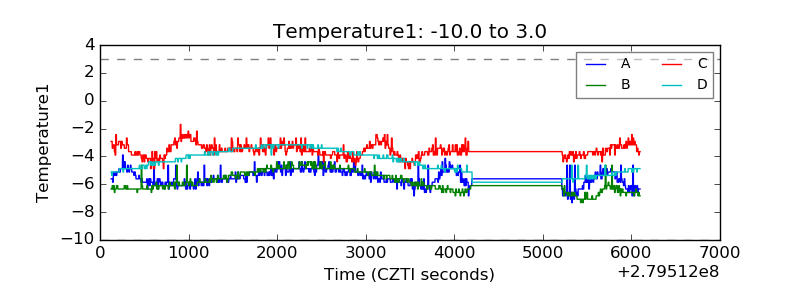 |
| Veto HV Monitor | 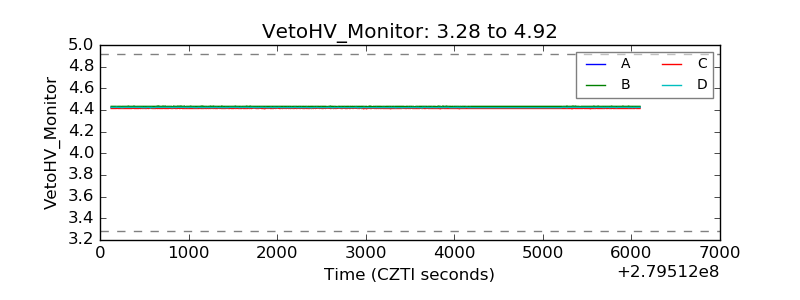 |
| Veto LLD | 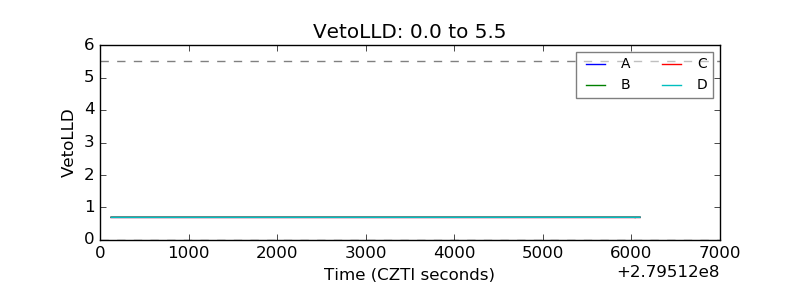 |
| Alpha Counter | 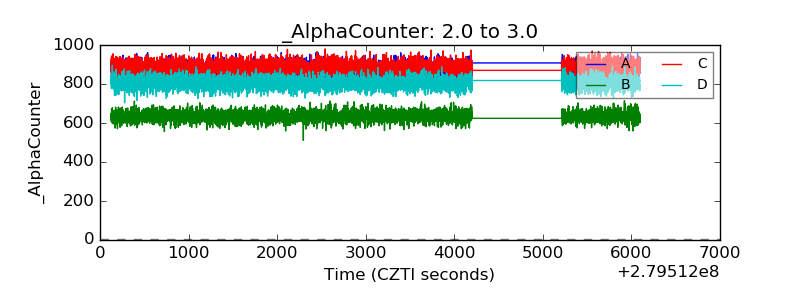 |
| _CPM_Rate | 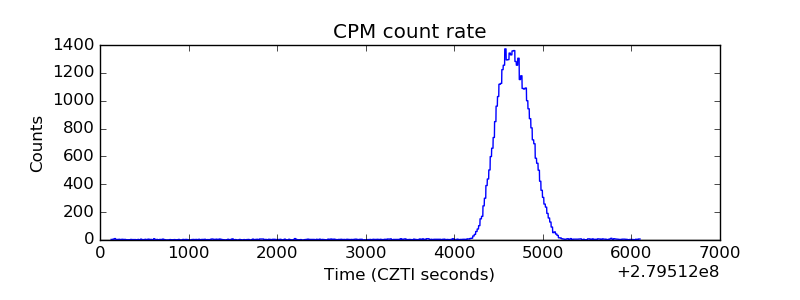 |
| CZT Counter | 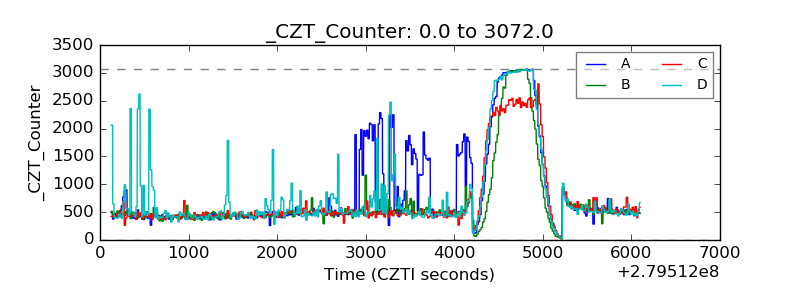 |
| +2.5 Volts monitor |  |
| +5 Volts monitor | 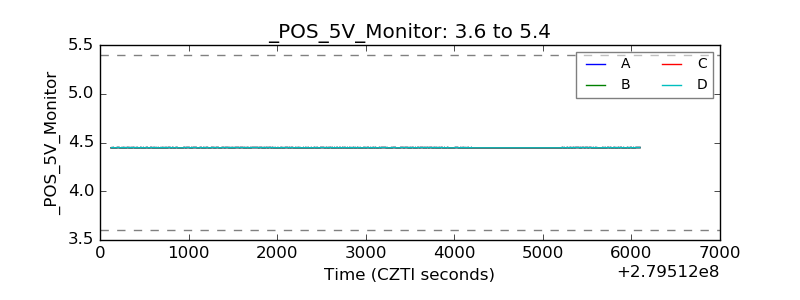 |
| _ROLL_ROT | 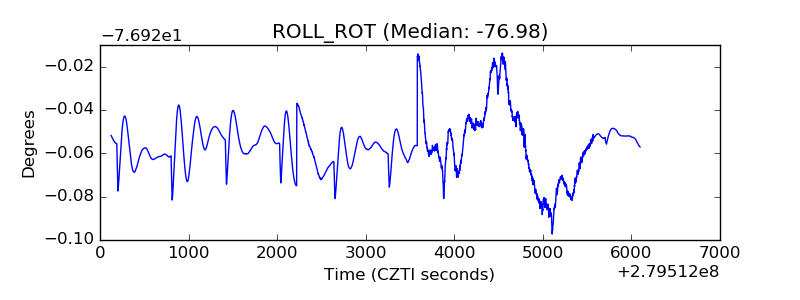 |
| _Roll_DEC | 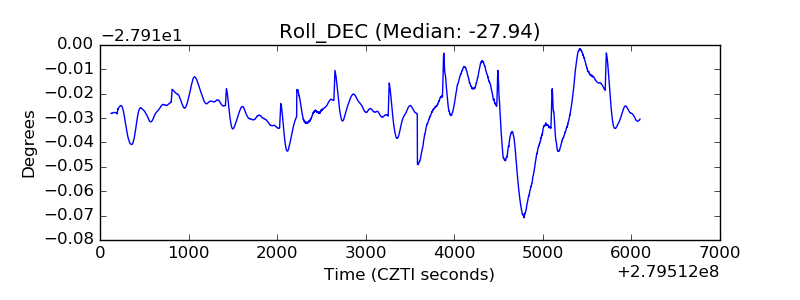 |
| _Roll_RA | 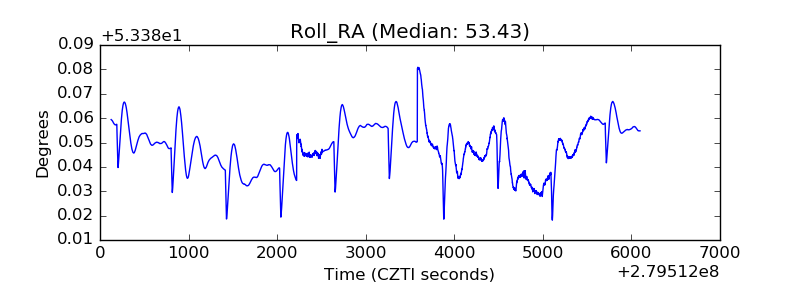 |
| Veto Counter | 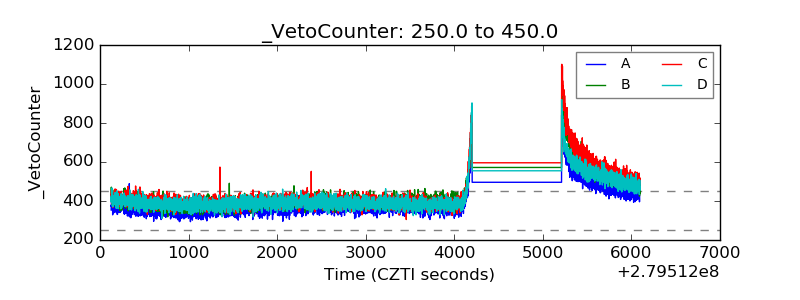 |