| Param | Original file | Final file |
|---|---|---|
| Filename | modeM0/AS1A05_101T05_9000002502cztM0_level2.fits | modeM0/AS1A05_101T05_9000002502cztM0_level2_quad_clean.evt |
| Size (bytes) | 204,399,360 | 234,711,360 |
| Size | 194.9 MB | 223.8 MB |
| Events in quadrant A | 1,280,880 | 1,597,085 |
| Events in quadrant B | 1,216,028 | 1,559,413 |
| Events in quadrant C | 1,264,174 | 1,549,374 |
| Events in quadrant D | 866,642 | 843,397 |
| Mode M9 | |||
|---|---|---|---|
| Quadrant | BADHDUFLAG | Total packets | Discarded packets |
| A | 0 | 38 | 0 |
| B | 0 | 38 | 0 |
| C | 0 | 38 | 0 |
| D | 0 | 38 | 0 |
| Mode SS | |||
|---|---|---|---|
| Quadrant | BADHDUFLAG | Total packets | Discarded packets |
| A | 0 | 462 | 0 |
| B | 0 | 462 | 0 |
| C | 0 | 462 | 0 |
| D | 0 | 462 | 0 |
| Mode M0 | |||
|---|---|---|---|
| Quadrant | BADHDUFLAG | Total packets | Discarded packets |
| A | 0 | 47947 | 0 |
| B | 0 | 53153 | 0 |
| C | 0 | 46595 | 0 |
| D | 0 | 120314 | 0 |
| Quadrant | Total seconds | Saturated seconds | Saturation percentage |
|---|---|---|---|
| A | 22637 | 242 | 1.069046% |
| B | 22637 | 839 | 3.706322% |
| C | 22637 | 231 | 1.020453% |
| D | 22637 | 8733 | 38.578434% |
Noise dominated data is calculated using 1-second bins in cleaned event files. If a bin has >2000 counts, and if more than 50% of those come from <1% of pixels, then it is considered to be noise-dominated and hence unusable.
| Quadrant | # 1 sec bins | Bins with >0 counts | Bins with >2000 counts | High rate bins dominated by noise | Noise dominated (total time) | Noise dominated (detector-on time) | Marked lightcurve |
|---|---|---|---|---|---|---|---|
| A | 26261 | 22636 | 0 | 0 | 0.00% | 0.00% |  |
| B | 26261 | 22607 | 0 | 0 | 0.00% | 0.00% | 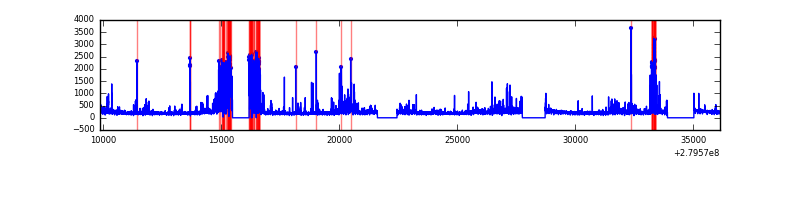 |
| C | 26261 | 22636 | 0 | 0 | 0.00% | 0.00% |  |
| D | 26261 | 22430 | 0 | 0 | 0.00% | 0.00% |  |
Top three noisy pixels from each quadrant. If the there are fewer than three noisy pixels in the level2.evt file, extra rows are filled as -1
| Pixel properties | Quadrant properties | ||||||
|---|---|---|---|---|---|---|---|
| Quadrant | DetID | PixID | Counts | Sigma | Mean | Median | Sigma |
| A | 0 | 29 | 1223 | 10.96 | 333 | 314 | 82.9 |
| A | 7 | 110 | 1058 | 8.97 | 333 | 314 | 82.9 |
| A | 0 | 30 | 1015 | 8.45 | 333 | 314 | 82.9 |
| B | 2 | 9 | 1004 | 10.48 | 322 | 308 | 66.4 |
| B | 2 | 8 | 839 | 7.99 | 322 | 308 | 66.4 |
| B | 3 | 80 | 836 | 7.95 | 322 | 308 | 66.4 |
| C | 3 | 126 | 867 | 6.4 | 334 | 312 | 86.7 |
| C | 9 | 233 | 851 | 6.21 | 334 | 312 | 86.7 |
| C | 3 | 158 | 847 | 6.17 | 334 | 312 | 86.7 |
| D | 6 | 231 | 647 | 6.34 | 247 | 224 | 66.7 |
| D | 3 | 14 | 628 | 6.06 | 247 | 224 | 66.7 |
| D | 6 | 67 | 625 | 6.01 | 247 | 224 | 66.7 |
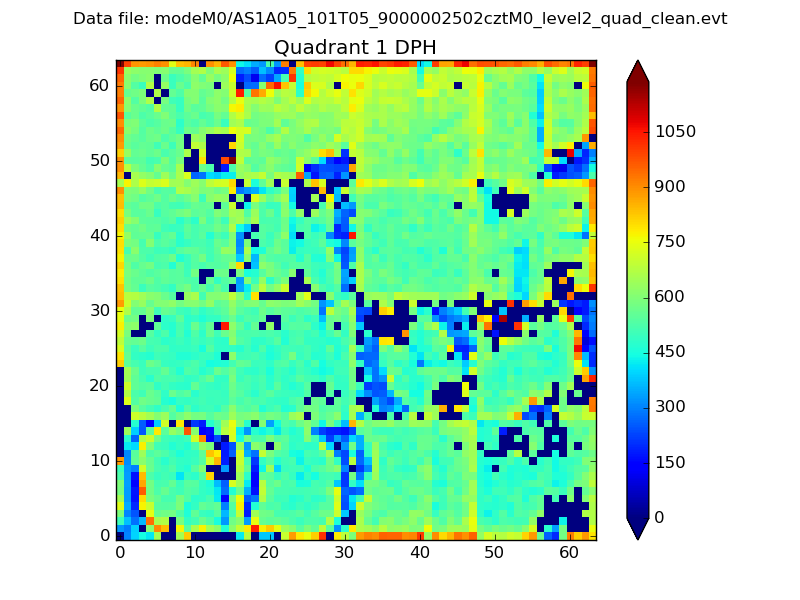
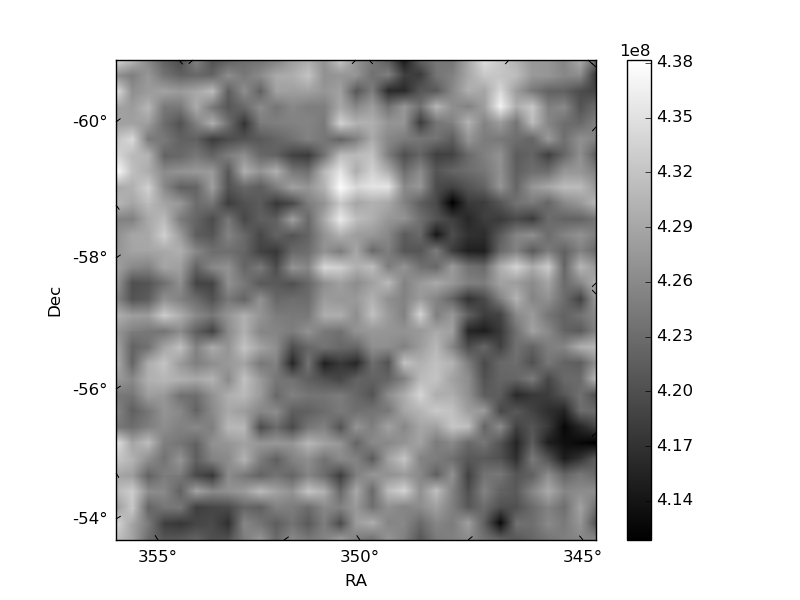
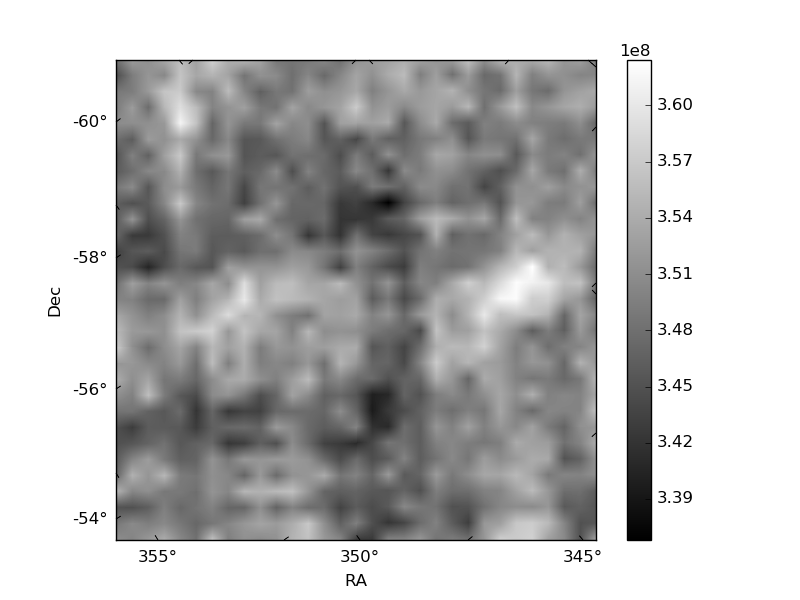
Histogram calculated using DETX and DETY for each event in the final _common_clean file
| Quadrant A |  |
 |
Quadrant B |
|---|---|---|---|
| Quadrant D | 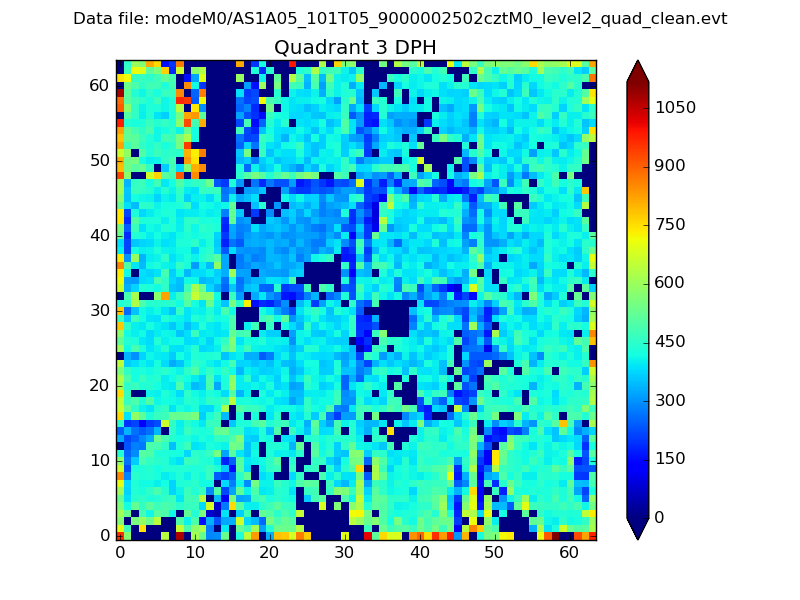 |
 |
Quadrant C |
| Plot type | Count rate plots | Images |
|---|---|---|
| Comparison with Poisson distribution Blue bars denote a histogram of data divided into 1 sec bins. Red curve is a Poisson curve with rate = median count rate of data. |
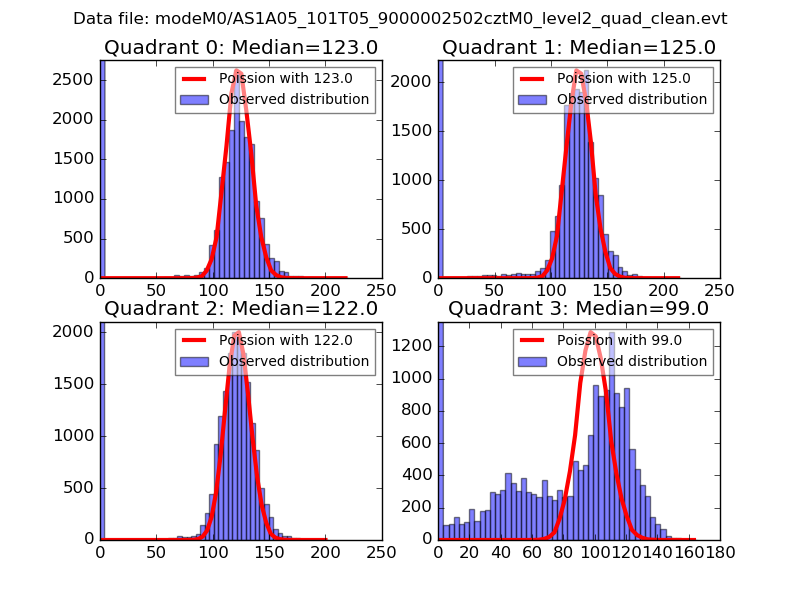 |
 |
| Quadrant-wise count rates Data is divided into 100 sec bins |
 |
|
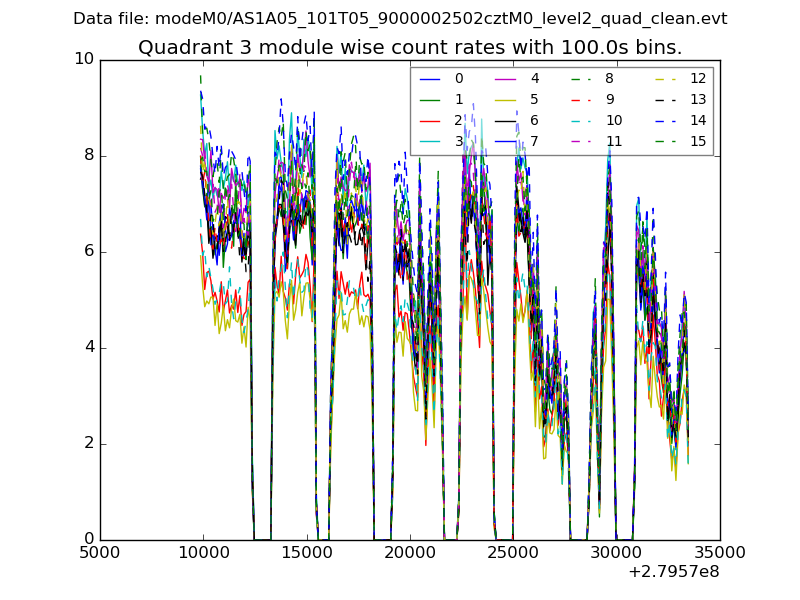
| Module-wise count rates for Quadrant A Data is divided into 100 sec bins |
 |
 |
| Module-wise count rates for Quadrant B Data is divided into 100 sec bins |
 |
 |
| Module-wise count rates for Quadrant C Data is divided into 100 sec bins |
 |
 |
| Module-wise count rates for Quadrant D Data is divided into 100 sec bins |
 |
 |
| Parameter | Plot |
|---|---|
| CZT HV Monitor | 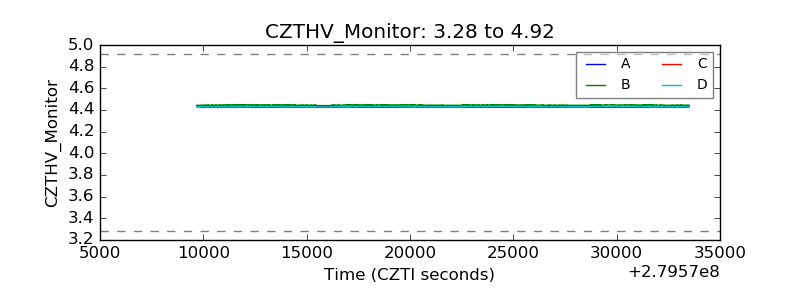 |
| D_VDD | 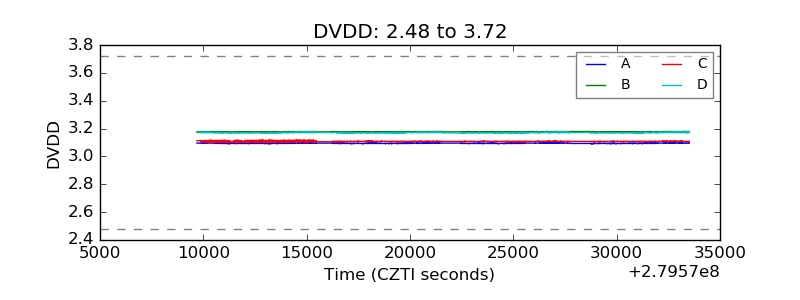 |
| Temperature 1 |  |
| Veto HV Monitor |  |
| Veto LLD |  |
| Alpha Counter |  |
| _CPM_Rate |  |
| CZT Counter |  |
| +2.5 Volts monitor | 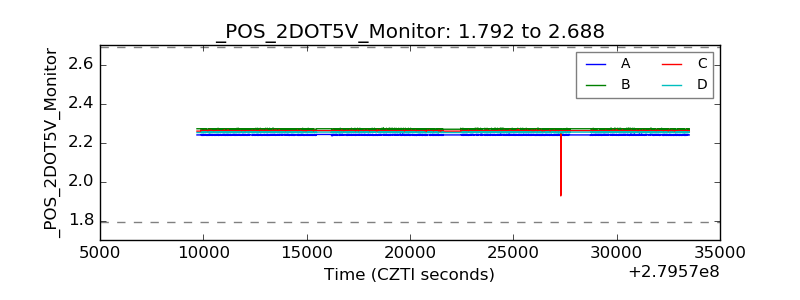 |
| +5 Volts monitor |  |
| _ROLL_ROT | 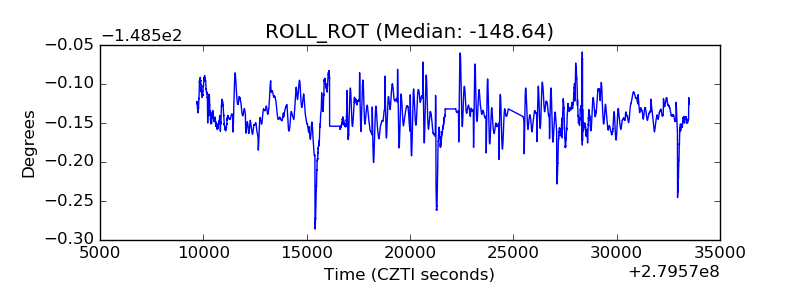 |
| _Roll_DEC |  |
| _Roll_RA |  |
| Veto Counter |  |