| Param | Original file | Final file |
|---|---|---|
| Filename | modeM0/AS1A05_101T05_9000002502_16872cztM0_level2.evt | modeM0/AS1A05_101T05_9000002502_16872cztM0_level2_quad_clean.evt |
| Size (bytes) | 662,063,040 | 90,757,440 |
| Size | 631.4 MB | 86.6 MB |
| Events in quadrant A | 2,883,373 | 641,226 |
| Events in quadrant B | 3,102,983 | 651,709 |
| Events in quadrant C | 2,999,237 | 628,579 |
| Events in quadrant D | 10,640,257 | 388,207 |
| Mode M9 | |||
|---|---|---|---|
| Quadrant | BADHDUFLAG | Total packets | Discarded packets |
| A | 0 | 10 | 0 |
| B | 0 | 10 | 0 |
| C | 0 | 10 | 0 |
| D | 0 | 10 | 0 |
| Mode SS | |||
|---|---|---|---|
| Quadrant | BADHDUFLAG | Total packets | Discarded packets |
| A | 0 | 126 | 0 |
| B | 0 | 126 | 0 |
| C | 0 | 126 | 0 |
| D | 0 | 126 | 0 |
| Mode M0 | |||
|---|---|---|---|
| Quadrant | BADHDUFLAG | Total packets | Discarded packets |
| A | 0 | 12778 | 2 |
| B | 0 | 13198 | 1 |
| C | 0 | 12894 | 1 |
| D | 0 | 35930 | 1 |
| Quadrant | Total seconds | Saturated seconds | Saturation percentage |
|---|---|---|---|
| A | 6271 | 47 | 0.749482% |
| B | 6271 | 58 | 0.924892% |
| C | 6271 | 61 | 0.972732% |
| D | 6271 | 3090 | 49.274438% |
Noise dominated data is calculated using 1-second bins in cleaned event files. If a bin has >2000 counts, and if more than 50% of those come from <1% of pixels, then it is considered to be noise-dominated and hence unusable.
| Quadrant | # 1 sec bins | Bins with >0 counts | Bins with >2000 counts | High rate bins dominated by noise | Noise dominated (total time) | Noise dominated (detector-on time) | Marked lightcurve |
|---|---|---|---|---|---|---|---|
| A | 7242 | 6273 | 2 | 2 | 0.03% | 0.03% | 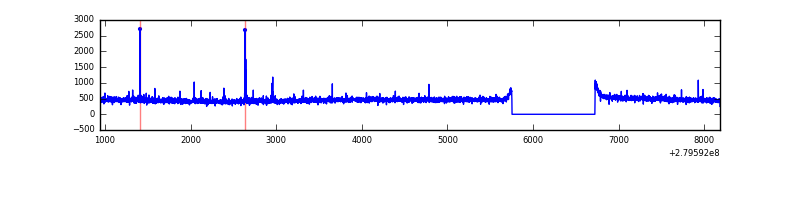 |
| B | 7242 | 6273 | 2 | 2 | 0.03% | 0.03% | 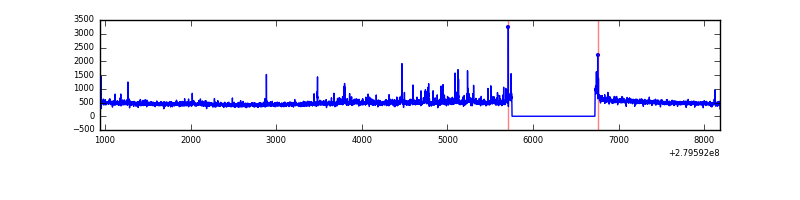 |
| C | 7242 | 6273 | 0 | 0 | 0.00% | 0.00% | 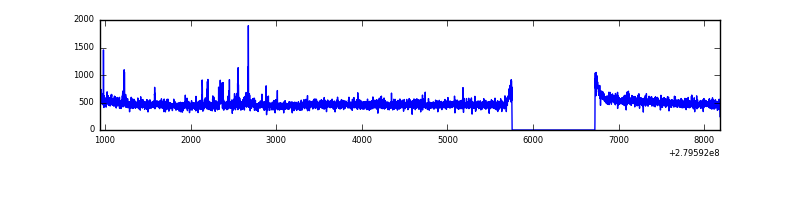 |
| D | 7241 | 6271 | 2327 | 2327 | 32.14% | 37.11% | 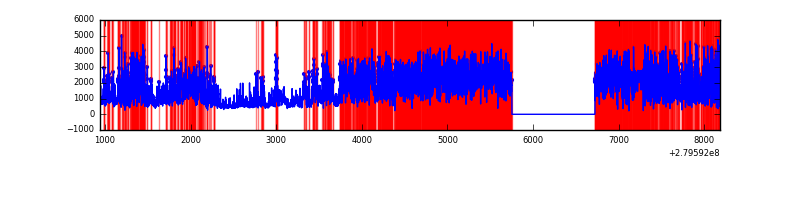 |
Top three noisy pixels from each quadrant. If the there are fewer than three noisy pixels in the level2.evt file, extra rows are filled as -1
| Pixel properties | Quadrant properties | ||||||
|---|---|---|---|---|---|---|---|
| Quadrant | DetID | PixID | Counts | Sigma | Mean | Median | Sigma |
| A | 9 | 143 | 33524 | 220.42 | 739 | 724 | 148.8 |
| A | 15 | 174 | 6735 | 40.39 | 739 | 724 | 148.8 |
| A | 0 | 226 | 6650 | 39.82 | 739 | 724 | 148.8 |
| B | 10 | 16 | 54215 | 382.73 | 743 | 724 | 139.8 |
| B | 15 | 35 | 33477 | 234.35 | 743 | 724 | 139.8 |
| B | 0 | 189 | 29492 | 205.84 | 743 | 724 | 139.8 |
| C | 14 | 238 | 110131 | 651.88 | 718 | 722 | 167.8 |
| C | 15 | 127 | 62850 | 370.17 | 718 | 722 | 167.8 |
| C | 3 | 233 | 23142 | 133.58 | 718 | 722 | 167.8 |
| D | 1 | 52 | 8581561 | 67367.88 | 527 | 513 | 127.4 |
| D | 10 | 70 | 39254 | 304.15 | 527 | 513 | 127.4 |
| D | 2 | 234 | 20192 | 154.5 | 527 | 513 | 127.4 |
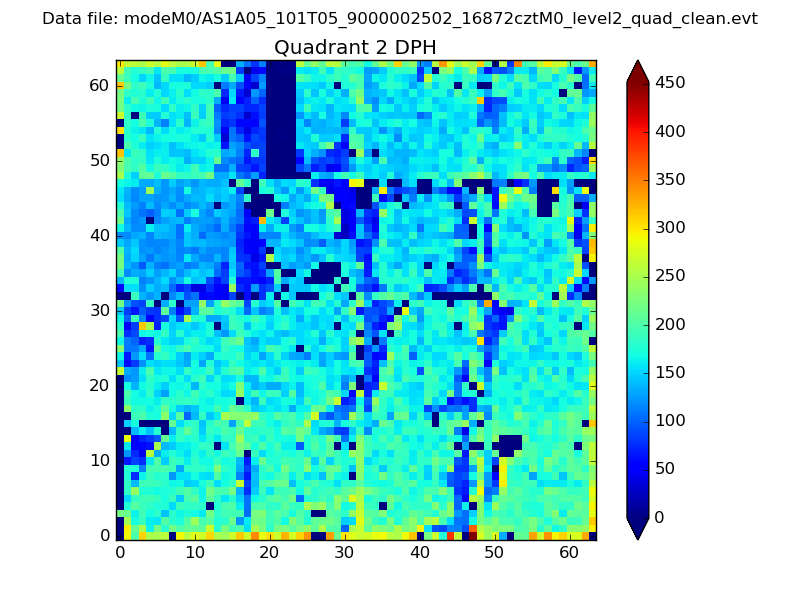
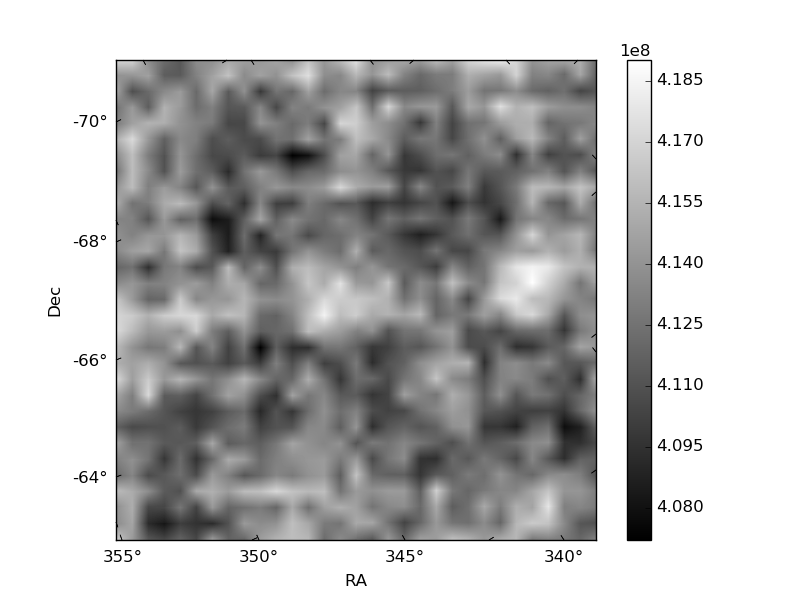
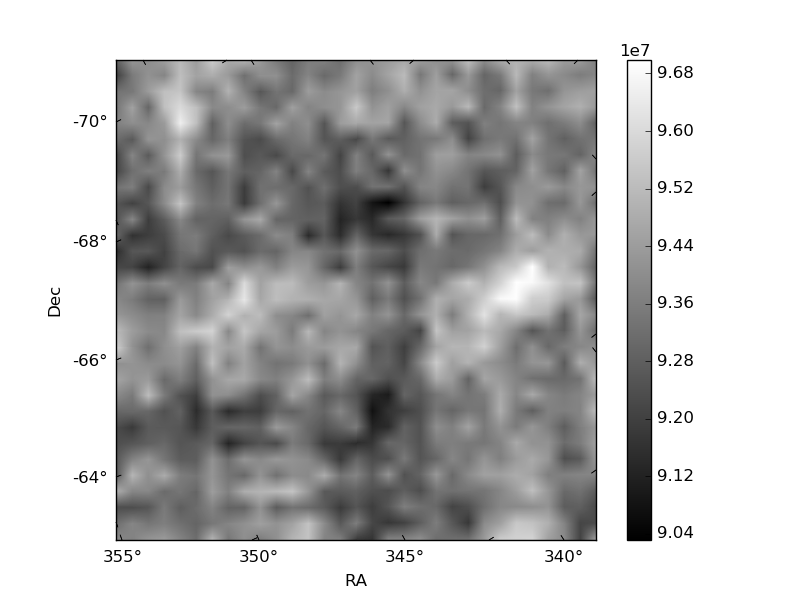
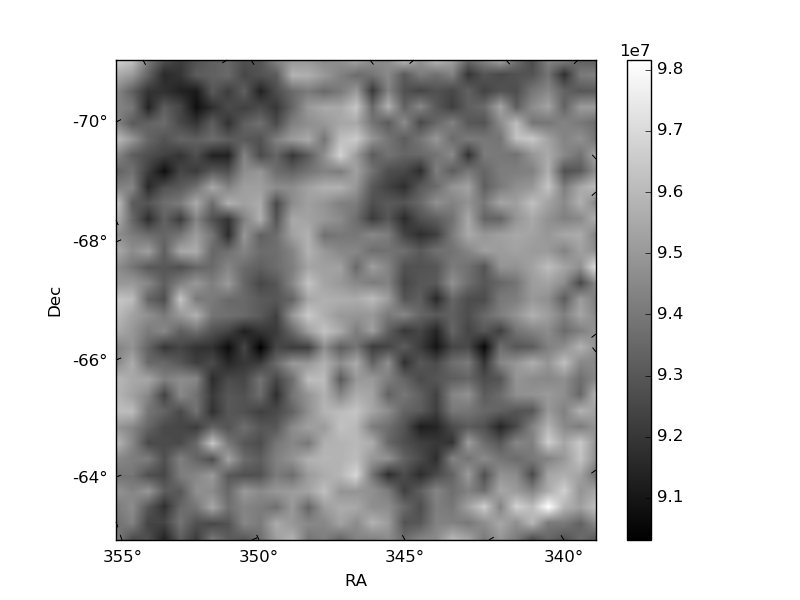
Histogram calculated using DETX and DETY for each event in the final _common_clean file
| Quadrant A | 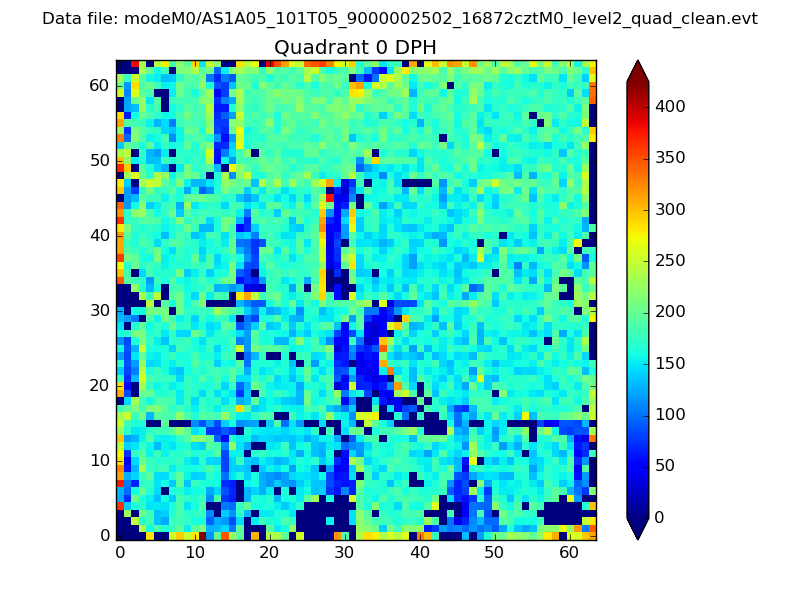 |
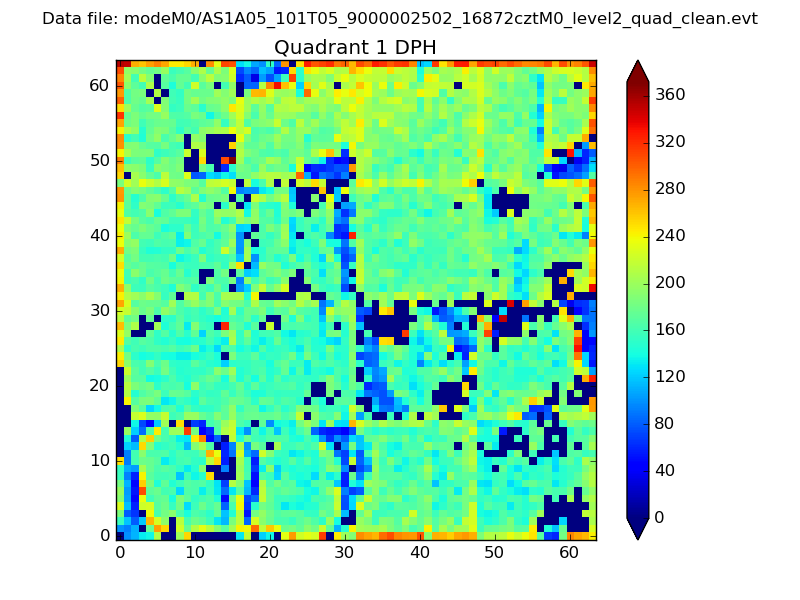 |
Quadrant B |
|---|---|---|---|
| Quadrant D | 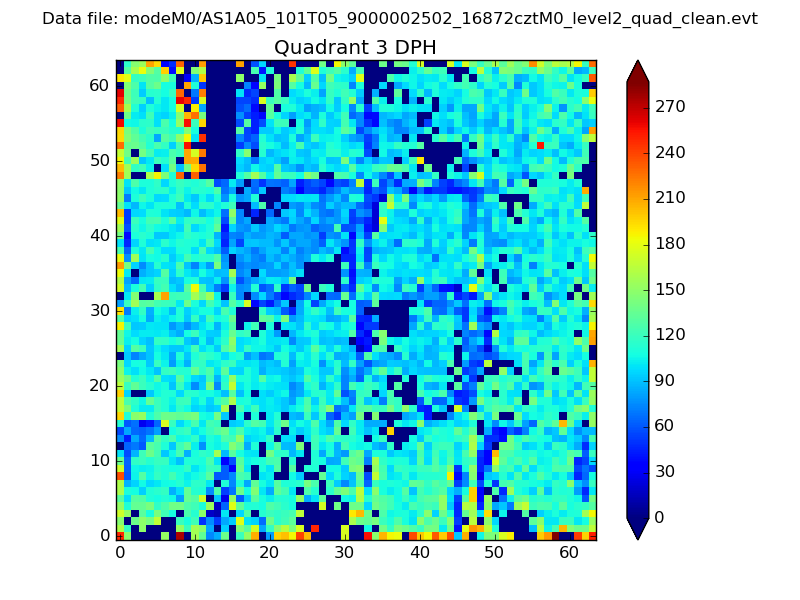 |
 |
Quadrant C |
| Plot type | Count rate plots | Images |
|---|---|---|
| Comparison with Poisson distribution Blue bars denote a histogram of data divided into 1 sec bins. Red curve is a Poisson curve with rate = median count rate of data. |
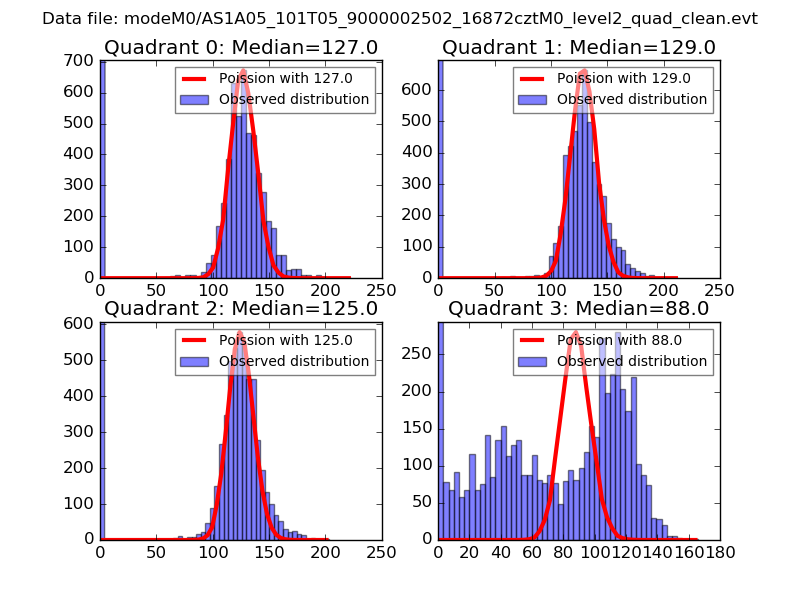 |
 |
| Quadrant-wise count rates Data is divided into 100 sec bins |
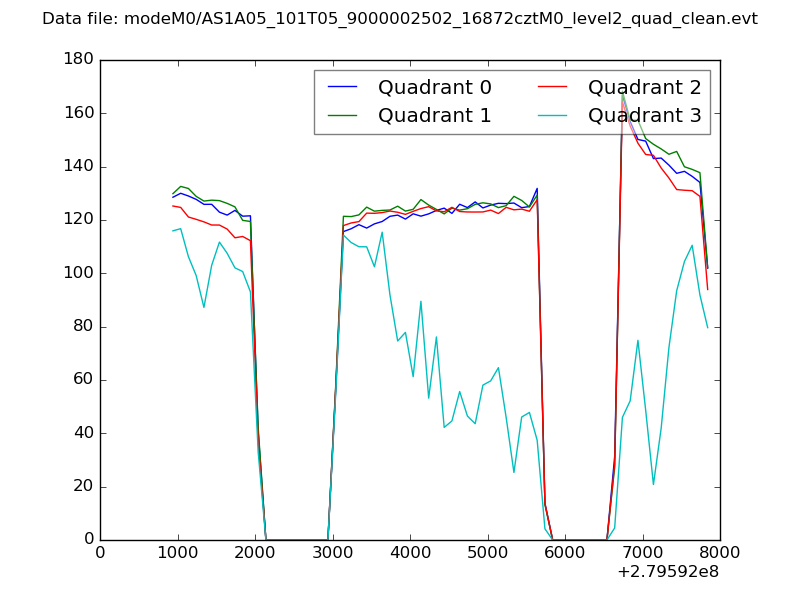 |
|
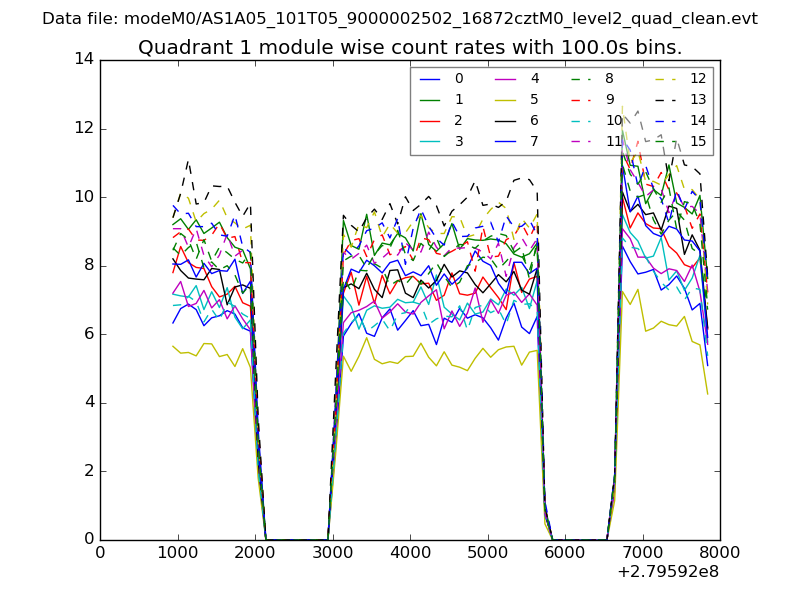
| Module-wise count rates for Quadrant A Data is divided into 100 sec bins |
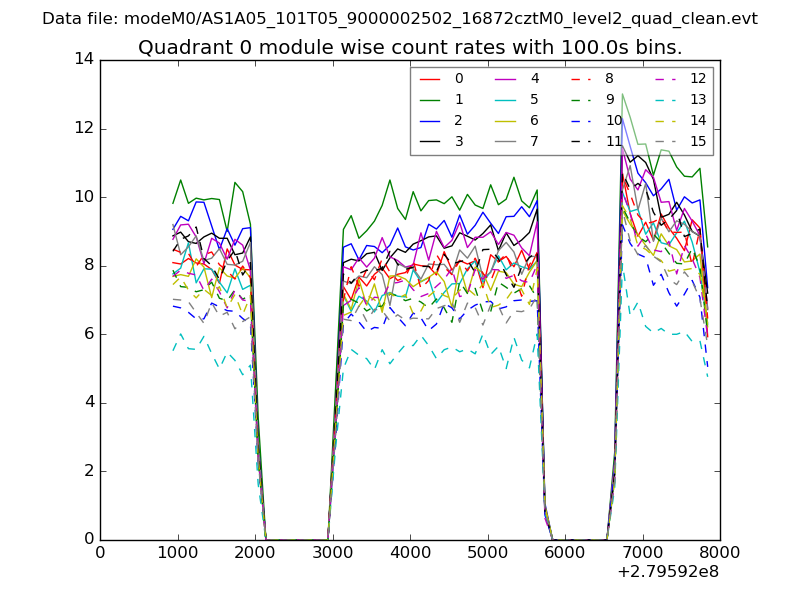 |
 |
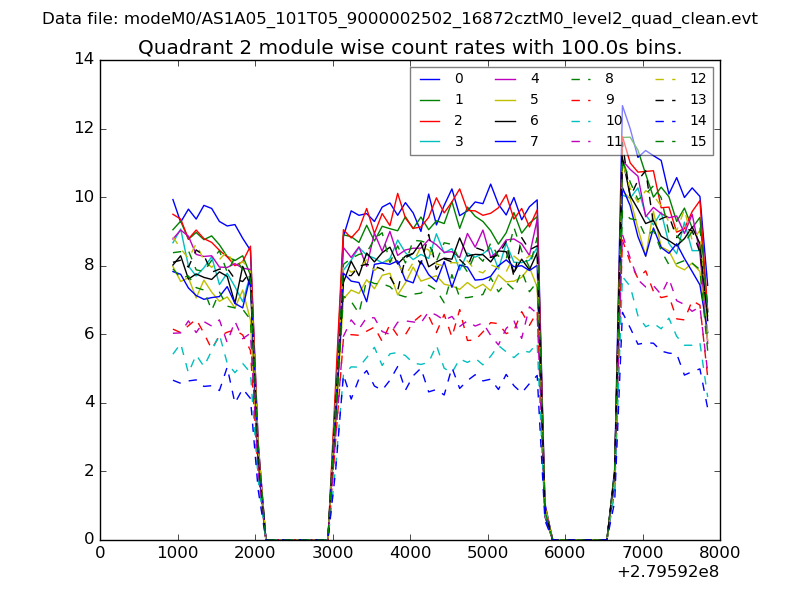
| Module-wise count rates for Quadrant B Data is divided into 100 sec bins |
 |
 |
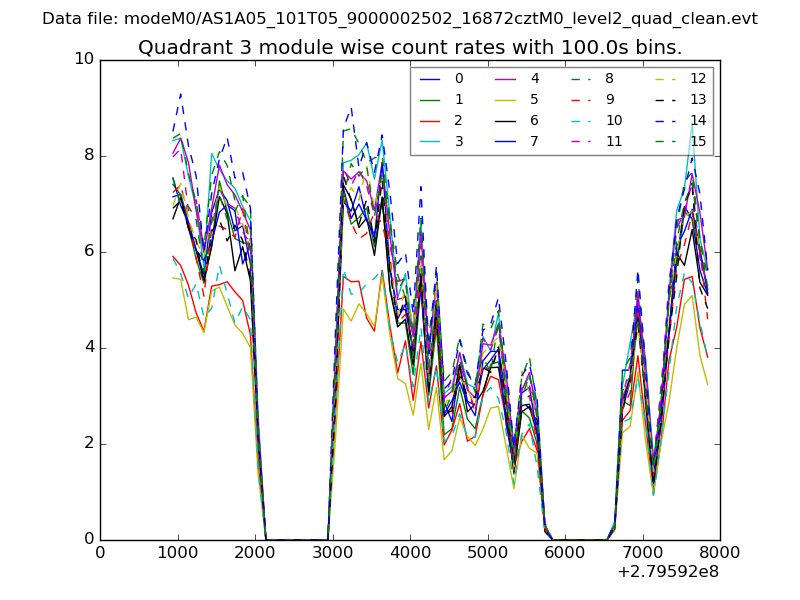
| Module-wise count rates for Quadrant C Data is divided into 100 sec bins |
 |
 |
| Module-wise count rates for Quadrant D Data is divided into 100 sec bins |
 |
 |
| Parameter | Plot |
|---|---|
| CZT HV Monitor | 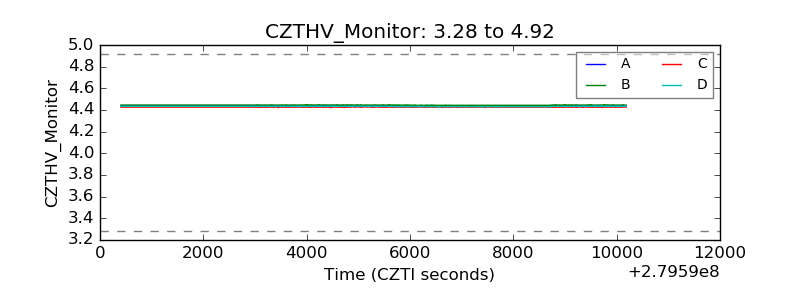 |
| D_VDD | 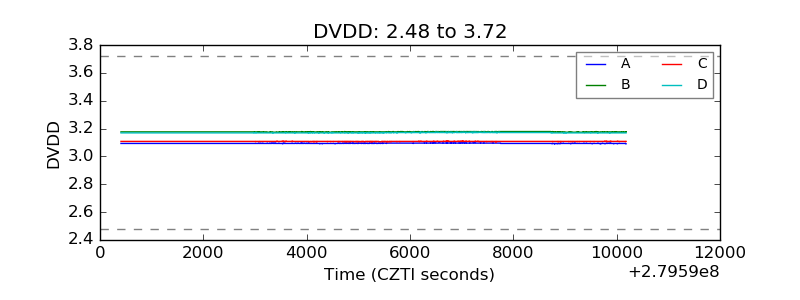 |
| Temperature 1 | 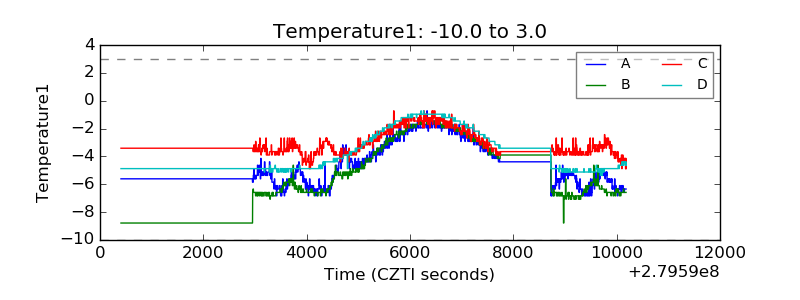 |
| Veto HV Monitor | 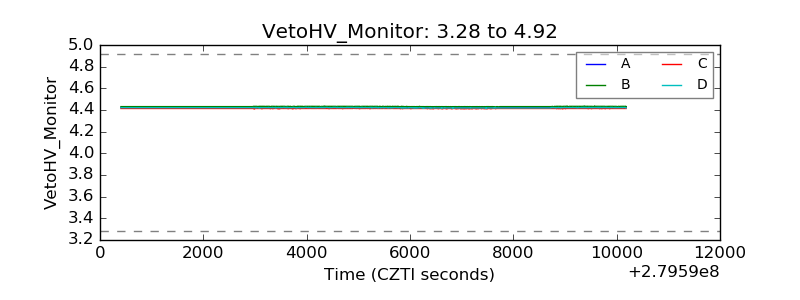 |
| Veto LLD | 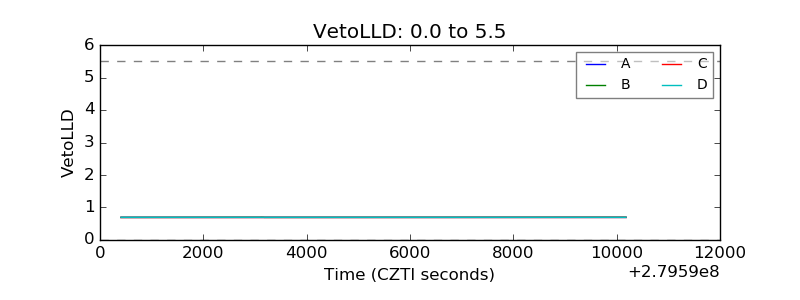 |
| Alpha Counter | 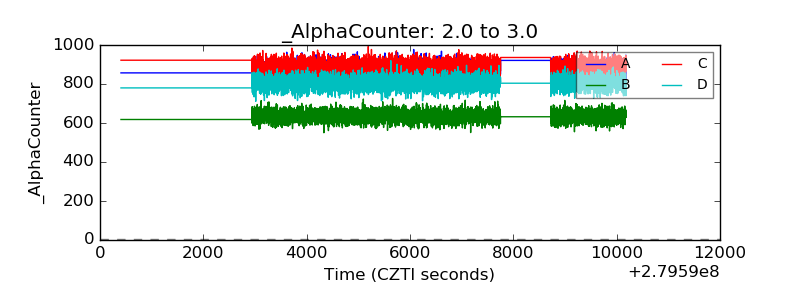 |
| _CPM_Rate | 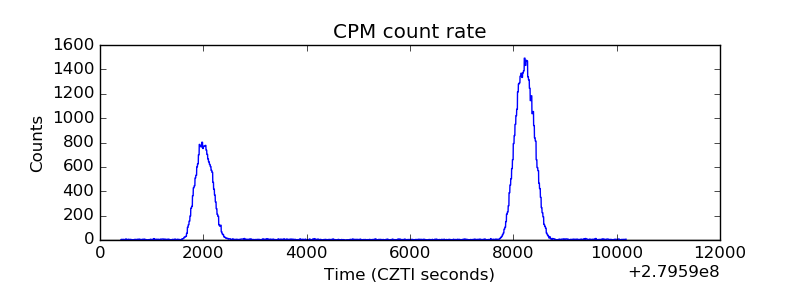 |
| CZT Counter | 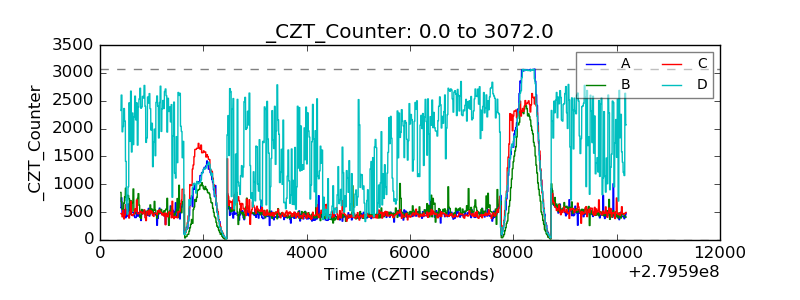 |
| +2.5 Volts monitor | 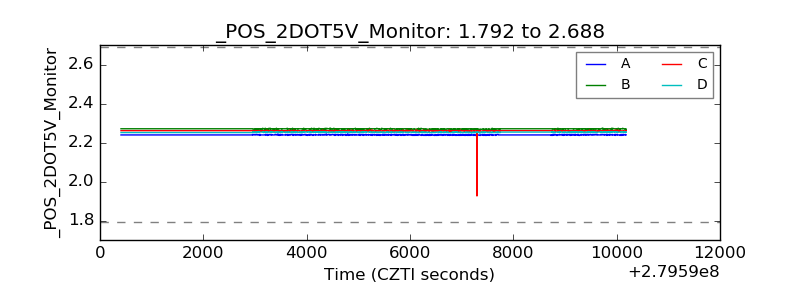 |
| +5 Volts monitor |  |
| _ROLL_ROT | 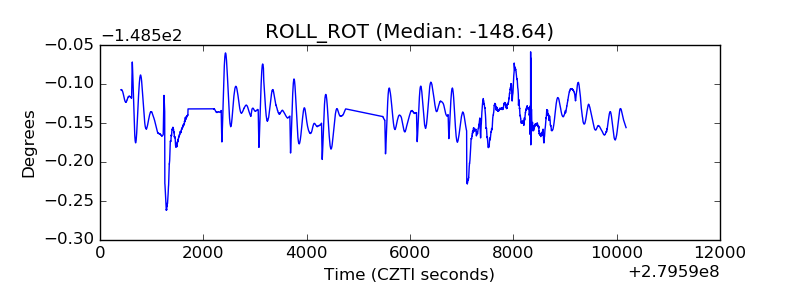 |
| _Roll_DEC | 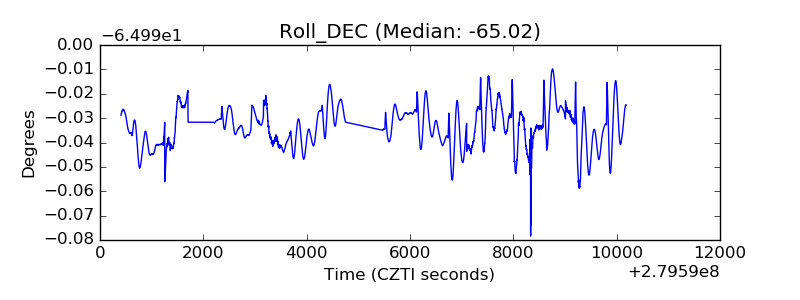 |
| _Roll_RA | 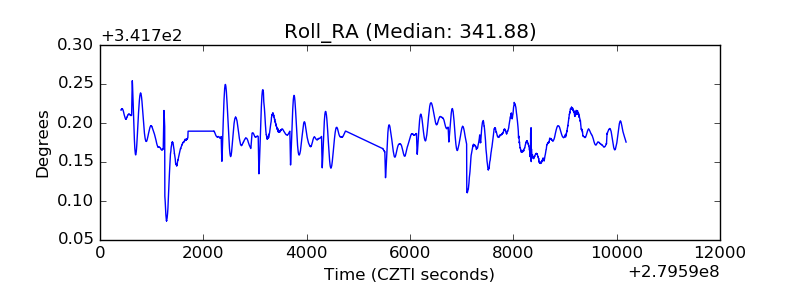 |
| Veto Counter | 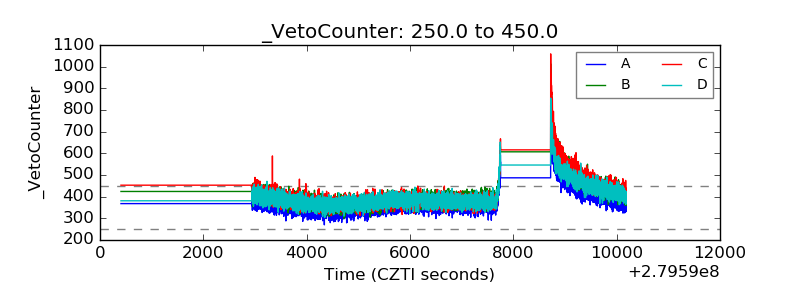 |