| Param | Original file | Final file |
|---|---|---|
| Filename | modeM0/AS1A05_101T05_9000002502_16874cztM0_level2.evt | modeM0/AS1A05_101T05_9000002502_16874cztM0_level2_quad_clean.evt |
| Size (bytes) | 741,602,880 | 71,640,000 |
| Size | 707.2 MB | 68.3 MB |
| Events in quadrant A | 3,522,634 | 487,770 |
| Events in quadrant B | 3,456,627 | 497,614 |
| Events in quadrant C | 3,076,688 | 488,746 |
| Events in quadrant D | 11,977,939 | 254,741 |
| Mode M9 | |||
|---|---|---|---|
| Quadrant | BADHDUFLAG | Total packets | Discarded packets |
| A | 0 | 14 | 0 |
| B | 0 | 14 | 0 |
| C | 0 | 14 | 0 |
| D | 0 | 15 | 0 |
| Mode SS | |||
|---|---|---|---|
| Quadrant | BADHDUFLAG | Total packets | Discarded packets |
| A | 0 | 128 | 0 |
| B | 0 | 128 | 0 |
| C | 0 | 128 | 0 |
| D | 0 | 128 | 0 |
| Mode M0 | |||
|---|---|---|---|
| Quadrant | BADHDUFLAG | Total packets | Discarded packets |
| A | 0 | 14534 | 2 |
| B | 0 | 14258 | 2 |
| C | 0 | 13144 | 2 |
| D | 0 | 39915 | 2 |
| Quadrant | Total seconds | Saturated seconds | Saturation percentage |
|---|---|---|---|
| A | 6287 | 128 | 2.035947% |
| B | 6287 | 137 | 2.179100% |
| C | 6287 | 76 | 1.208844% |
| D | 6287 | 3695 | 58.772069% |
Noise dominated data is calculated using 1-second bins in cleaned event files. If a bin has >2000 counts, and if more than 50% of those come from <1% of pixels, then it is considered to be noise-dominated and hence unusable.
| Quadrant | # 1 sec bins | Bins with >0 counts | Bins with >2000 counts | High rate bins dominated by noise | Noise dominated (total time) | Noise dominated (detector-on time) | Marked lightcurve |
|---|---|---|---|---|---|---|---|
| A | 7408 | 6289 | 43 | 43 | 0.58% | 0.68% | 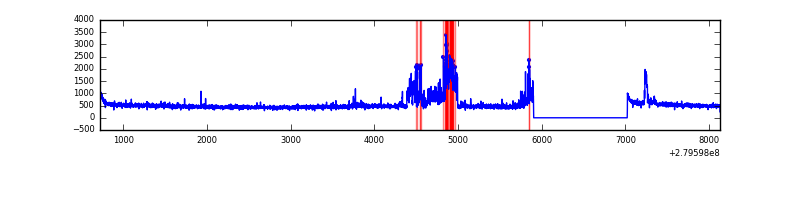 |
| B | 7408 | 6289 | 55 | 55 | 0.74% | 0.87% | 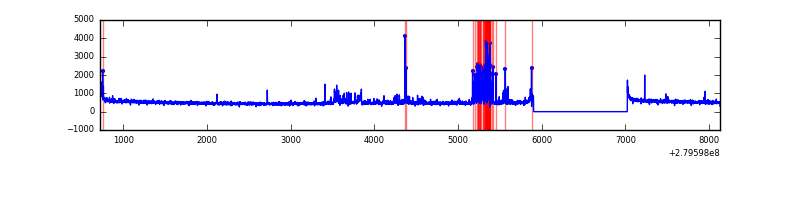 |
| C | 7408 | 6289 | 1 | 1 | 0.01% | 0.02% | 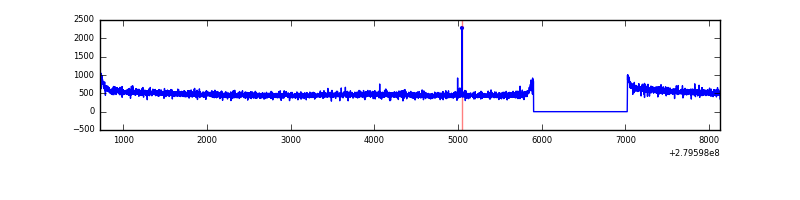 |
| D | 7408 | 6289 | 2889 | 2889 | 39.00% | 45.94% | 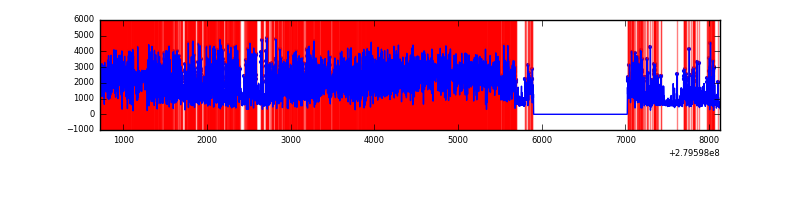 |
Top three noisy pixels from each quadrant. If the there are fewer than three noisy pixels in the level2.evt file, extra rows are filled as -1
| Pixel properties | Quadrant properties | ||||||
|---|---|---|---|---|---|---|---|
| Quadrant | DetID | PixID | Counts | Sigma | Mean | Median | Sigma |
| A | 15 | 174 | 515563 | 3354.51 | 774 | 760 | 153.5 |
| A | 0 | 23 | 14595 | 90.15 | 774 | 760 | 153.5 |
| A | 9 | 143 | 7860 | 46.26 | 774 | 760 | 153.5 |
| B | 10 | 16 | 262114 | 1799.21 | 776 | 755 | 145.3 |
| B | 15 | 35 | 62929 | 428.01 | 776 | 755 | 145.3 |
| B | 4 | 216 | 34282 | 230.8 | 776 | 755 | 145.3 |
| C | 14 | 238 | 117778 | 669.2 | 756 | 760 | 174.9 |
| C | 3 | 233 | 6326 | 31.83 | 756 | 760 | 174.9 |
| C | 13 | 61 | 5289 | 25.9 | 756 | 760 | 174.9 |
| D | 1 | 52 | 9727636 | 74000.65 | 551 | 535 | 131.4 |
| D | 10 | 70 | 142727 | 1081.75 | 551 | 535 | 131.4 |
| D | 2 | 234 | 19419 | 143.66 | 551 | 535 | 131.4 |
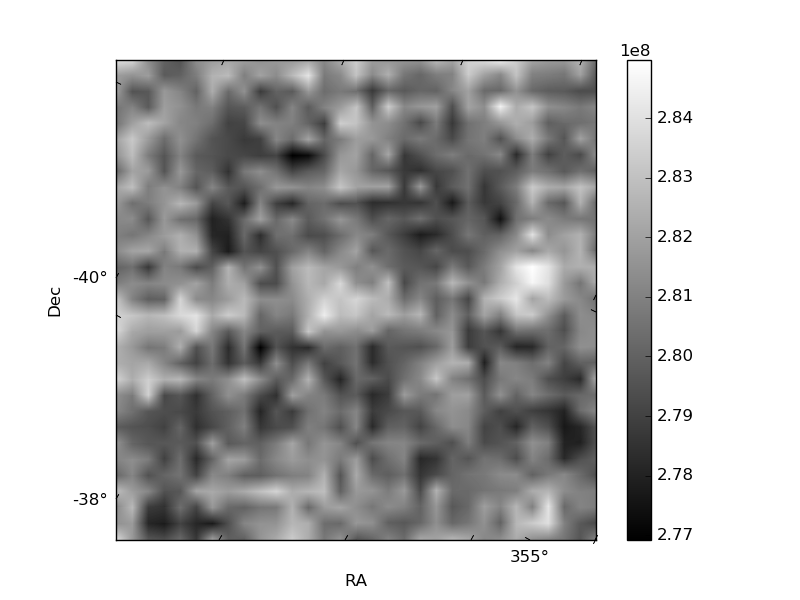
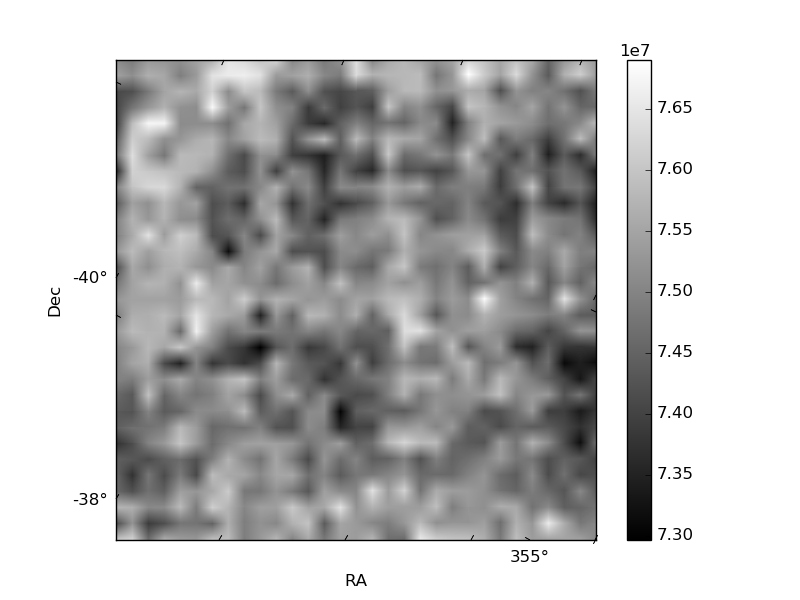
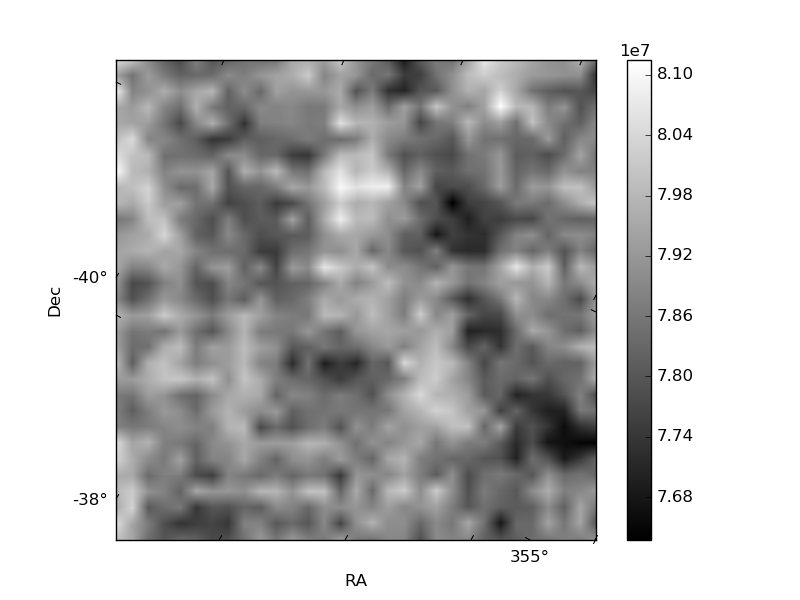
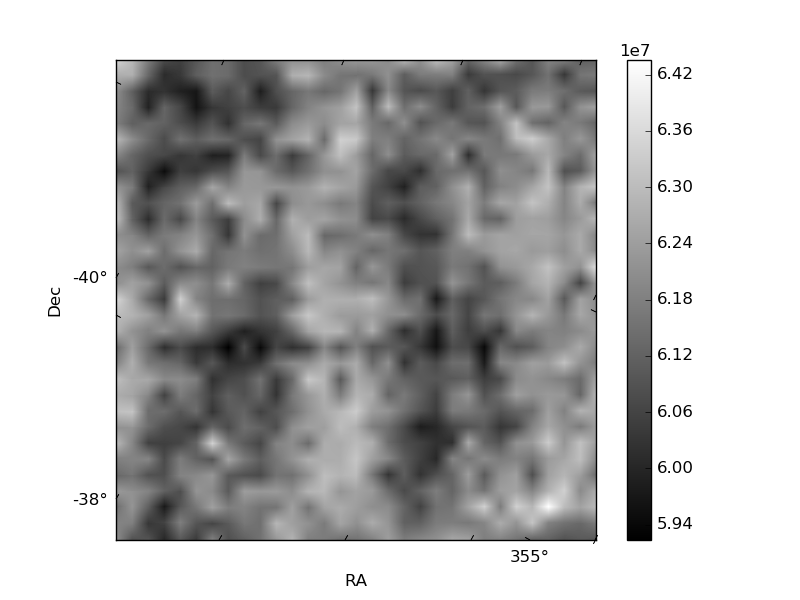
Histogram calculated using DETX and DETY for each event in the final _common_clean file
| Quadrant A | 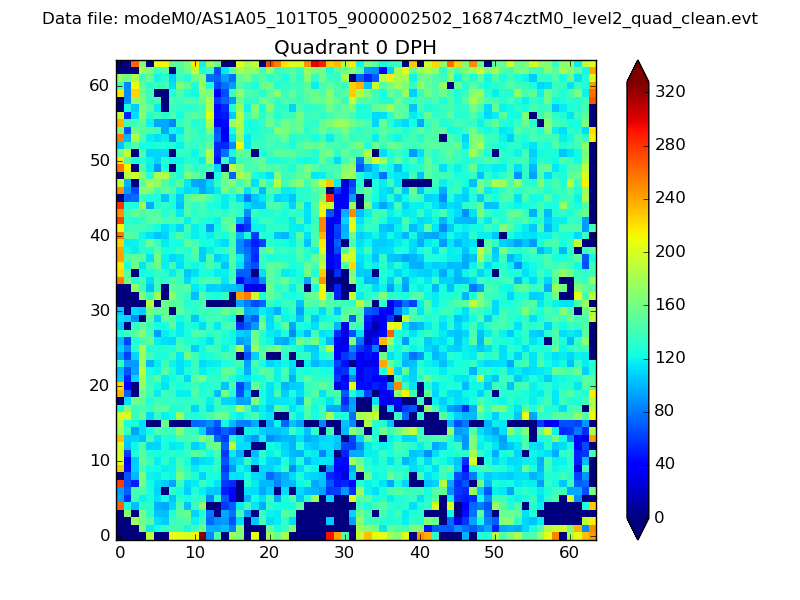 |
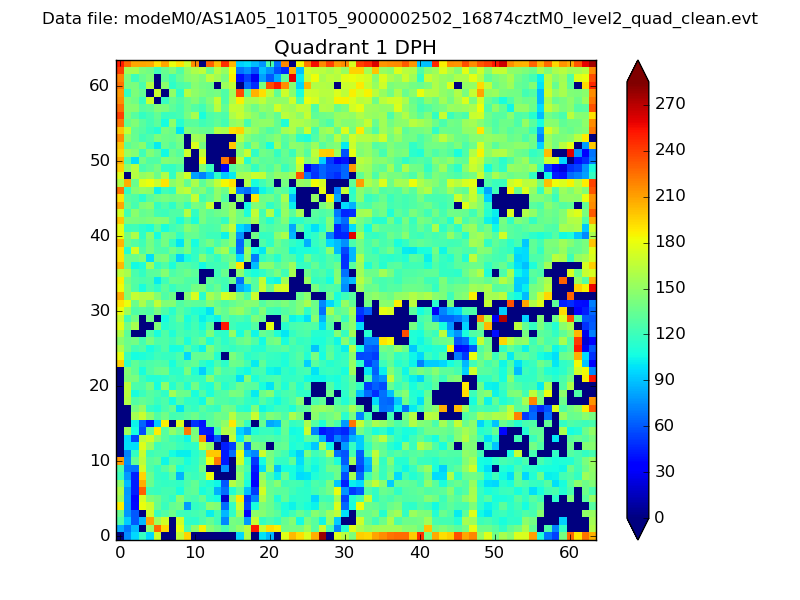 |
Quadrant B |
|---|---|---|---|
| Quadrant D | 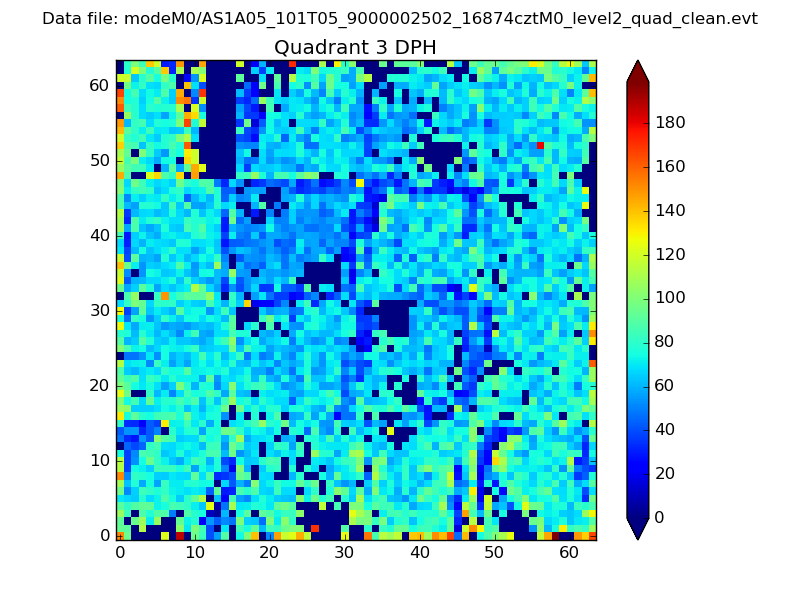 |
 |
Quadrant C |
| Plot type | Count rate plots | Images |
|---|---|---|
| Comparison with Poisson distribution Blue bars denote a histogram of data divided into 1 sec bins. Red curve is a Poisson curve with rate = median count rate of data. |
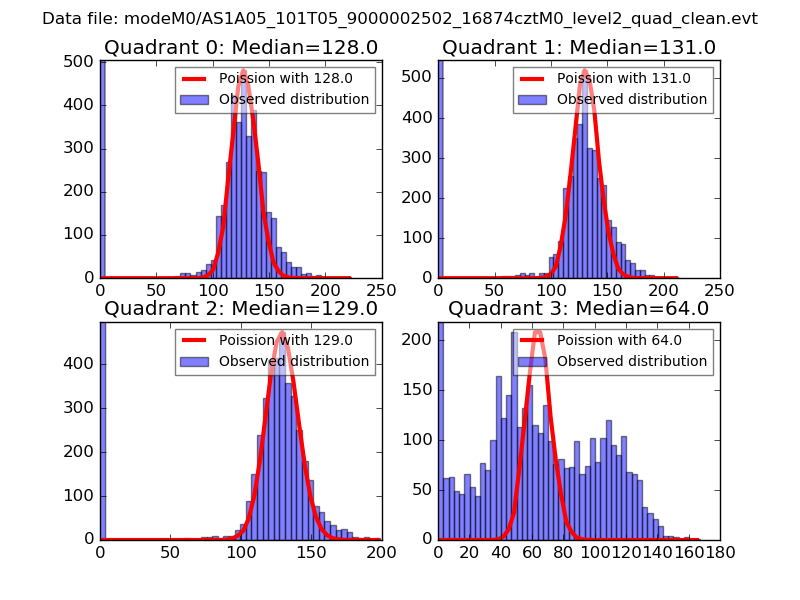 |
 |
| Quadrant-wise count rates Data is divided into 100 sec bins |
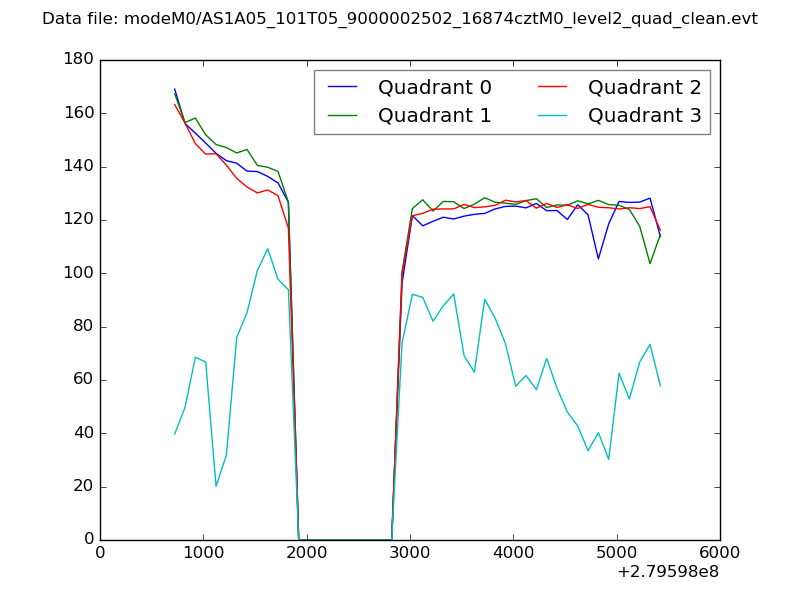 |
|
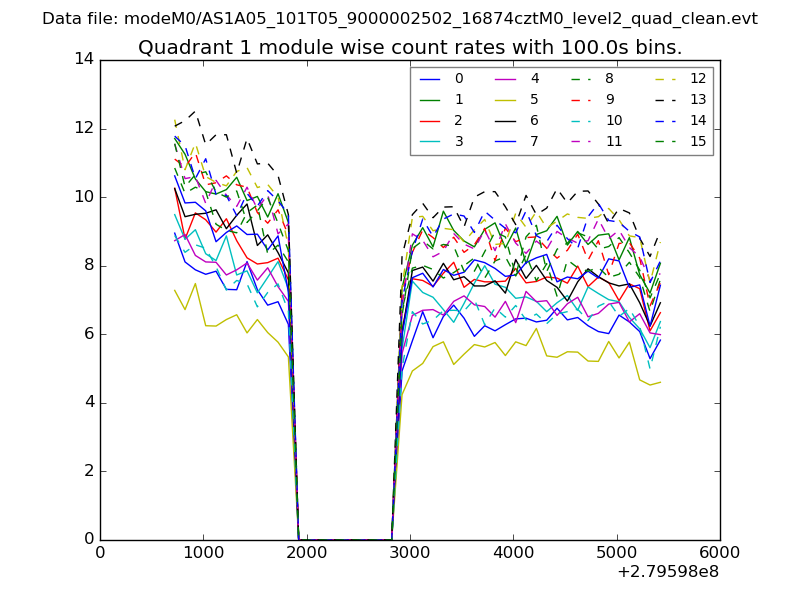
| Module-wise count rates for Quadrant A Data is divided into 100 sec bins |
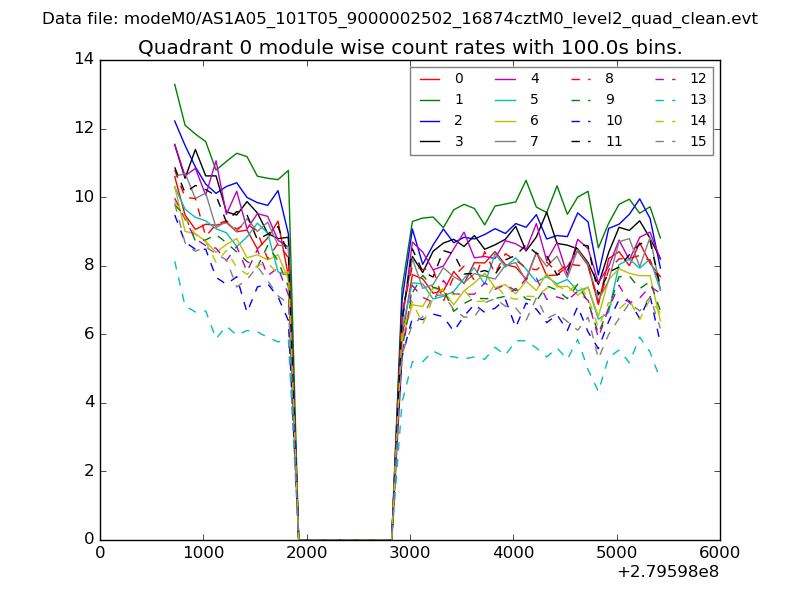 |
 |
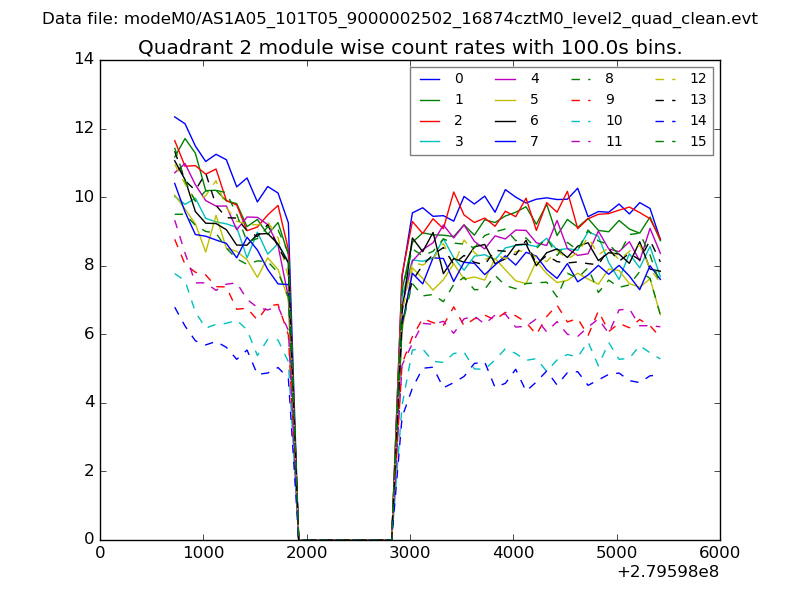
| Module-wise count rates for Quadrant B Data is divided into 100 sec bins |
 |
 |
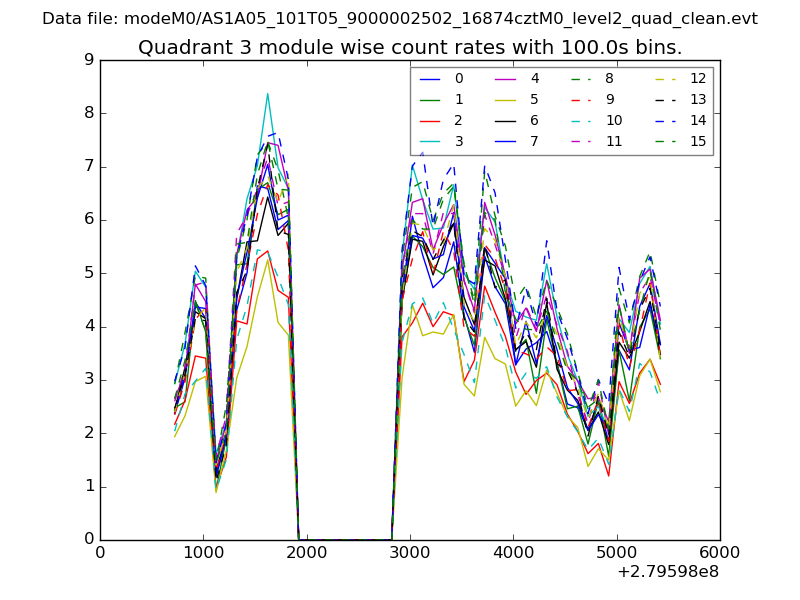
| Module-wise count rates for Quadrant C Data is divided into 100 sec bins |
 |
 |
| Module-wise count rates for Quadrant D Data is divided into 100 sec bins |
 |
 |
| Parameter | Plot |
|---|---|
| CZT HV Monitor | 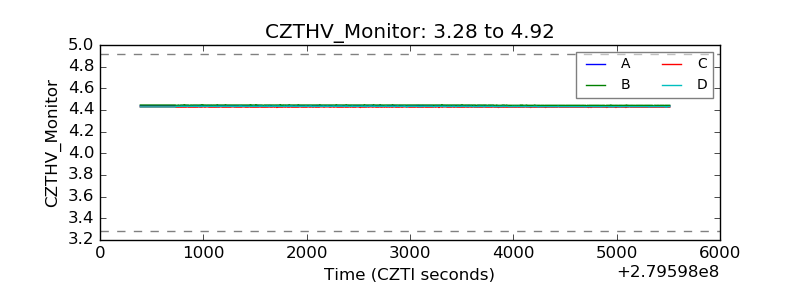 |
| D_VDD | 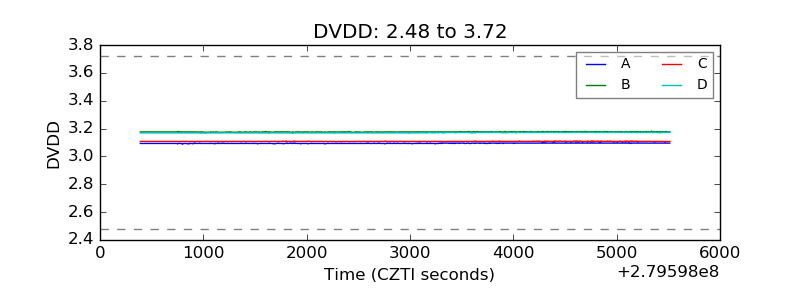 |
| Temperature 1 | 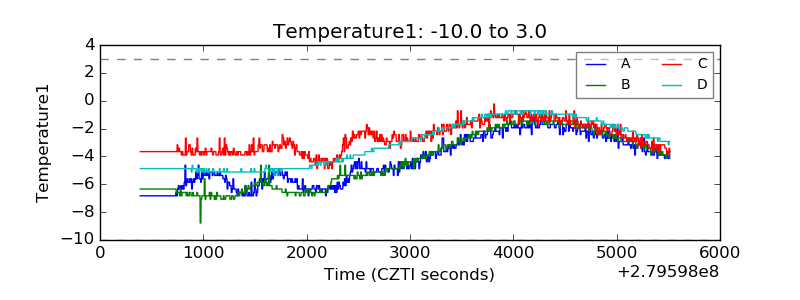 |
| Veto HV Monitor | 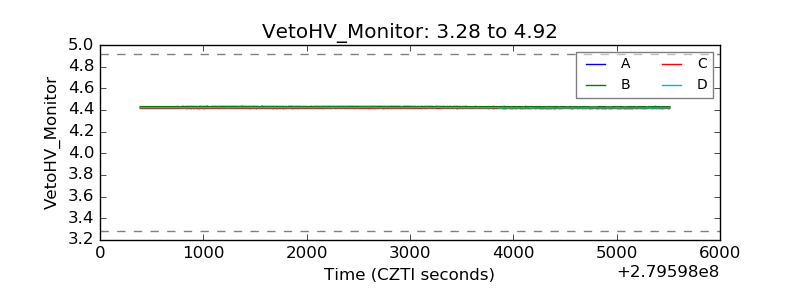 |
| Veto LLD | 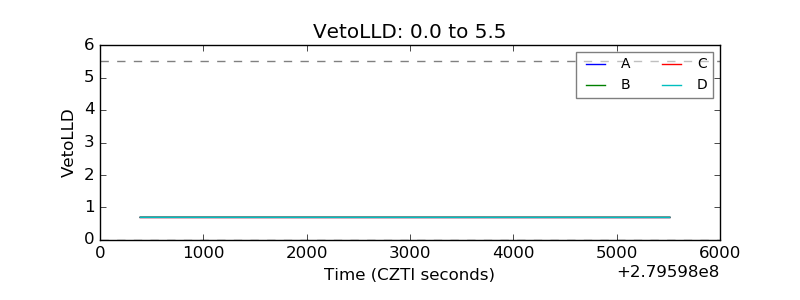 |
| Alpha Counter | 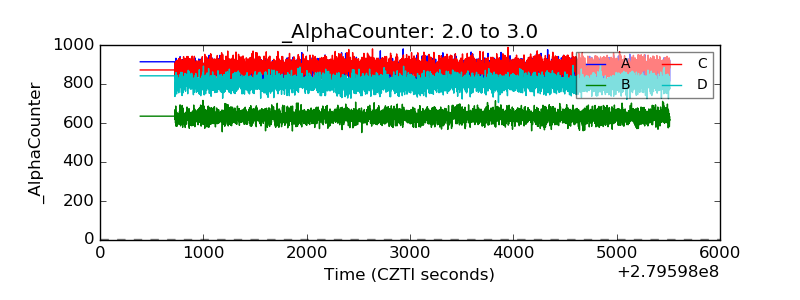 |
| _CPM_Rate | 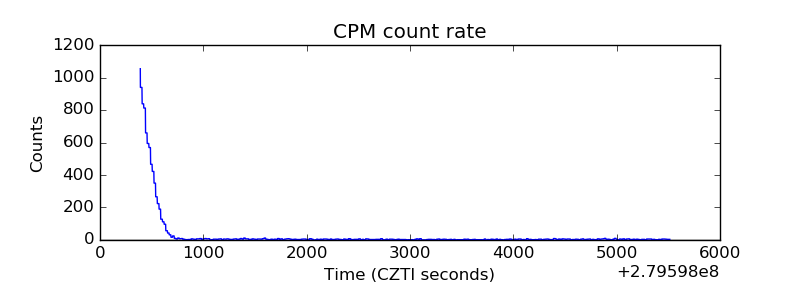 |
| CZT Counter | 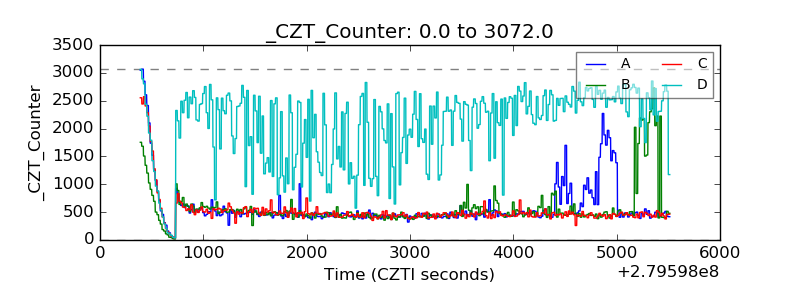 |
| +2.5 Volts monitor | 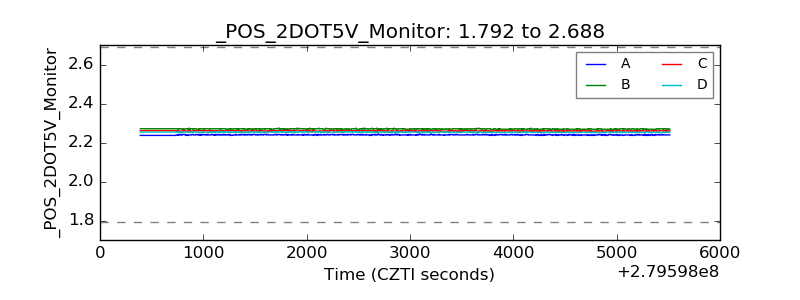 |
| +5 Volts monitor |  |
| _ROLL_ROT | 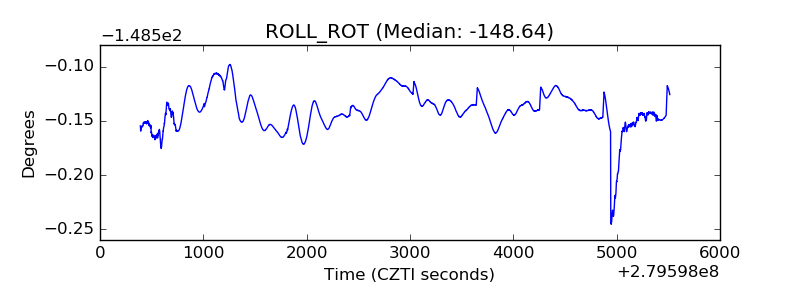 |
| _Roll_DEC | 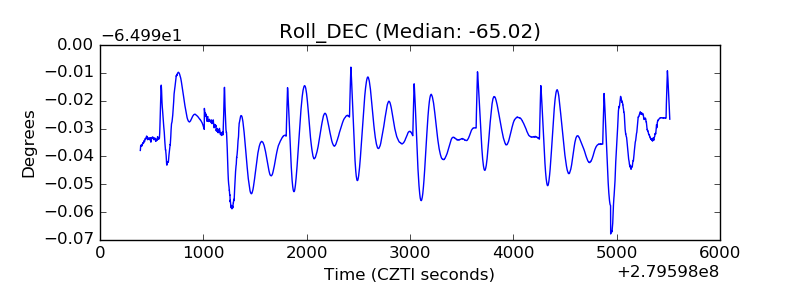 |
| _Roll_RA | 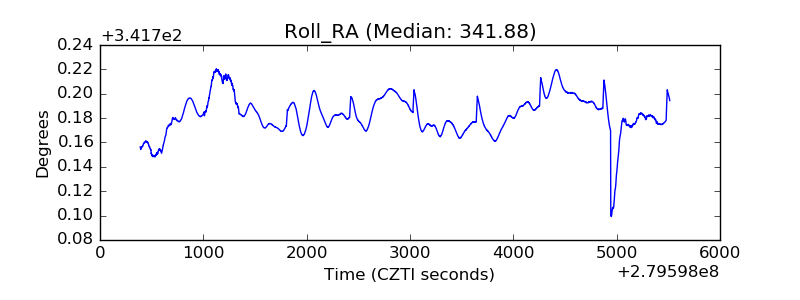 |
| Veto Counter | 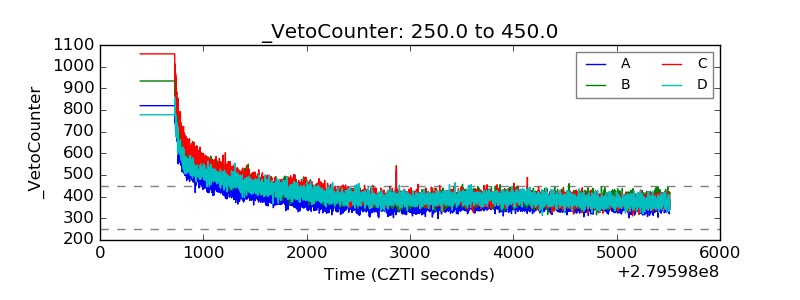 |