| Param | Original file | Final file |
|---|---|---|
| Filename | modeM0/AS1T03_034T01_9000002500cztM0_level2.fits | modeM0/AS1T03_034T01_9000002500cztM0_level2_quad_clean.evt |
| Size (bytes) | 435,870,720 | 291,879,360 |
| Size | 415.7 MB | 278.4 MB |
| Events in quadrant A | 2,734,210 | 1,560,423 |
| Events in quadrant B | 2,603,644 | 1,559,593 |
| Events in quadrant C | 2,685,338 | 1,495,140 |
| Events in quadrant D | 2,159,336 | 1,207,289 |
| Mode M9 | |||
|---|---|---|---|
| Quadrant | BADHDUFLAG | Total packets | Discarded packets |
| A | 0 | 74 | 0 |
| B | 0 | 74 | 0 |
| C | 0 | 74 | 0 |
| D | 0 | 74 | 0 |
| Mode M0 | |||
|---|---|---|---|
| Quadrant | BADHDUFLAG | Total packets | Discarded packets |
| A | 0 | 93363 | 0 |
| B | 0 | 96394 | 0 |
| C | 0 | 91314 | 0 |
| D | 0 | 163114 | 0 |
| Mode SS | |||
|---|---|---|---|
| Quadrant | BADHDUFLAG | Total packets | Discarded packets |
| A | 0 | 898 | 0 |
| B | 0 | 898 | 0 |
| C | 0 | 898 | 0 |
| D | 0 | 898 | 0 |
| Quadrant | Total seconds | Saturated seconds | Saturation percentage |
|---|---|---|---|
| A | 43902 | 652 | 1.485126% |
| B | 43903 | 757 | 1.724256% |
| C | 43903 | 753 | 1.715145% |
| D | 43902 | 7683 | 17.500342% |
Noise dominated data is calculated using 1-second bins in cleaned event files. If a bin has >2000 counts, and if more than 50% of those come from <1% of pixels, then it is considered to be noise-dominated and hence unusable.
| Quadrant | # 1 sec bins | Bins with >0 counts | Bins with >2000 counts | High rate bins dominated by noise | Noise dominated (total time) | Noise dominated (detector-on time) | Marked lightcurve |
|---|---|---|---|---|---|---|---|
| A | 54245 | 43900 | 0 | 0 | 0.00% | 0.00% | 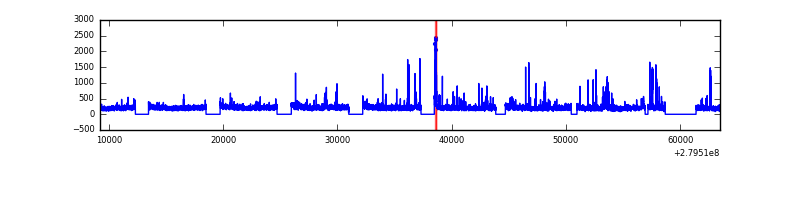 |
| B | 54245 | 43901 | 0 | 0 | 0.00% | 0.00% |  |
| C | 54245 | 43901 | 0 | 0 | 0.00% | 0.00% | 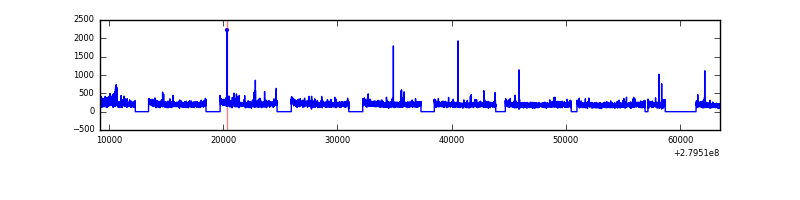 |
| D | 54245 | 43855 | 0 | 0 | 0.00% | 0.00% | 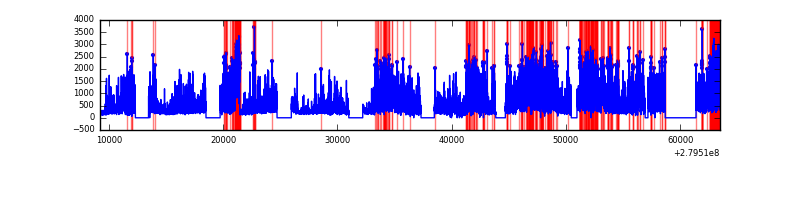 |
Top three noisy pixels from each quadrant. If the there are fewer than three noisy pixels in the level2.evt file, extra rows are filled as -1
| Pixel properties | Quadrant properties | ||||||
|---|---|---|---|---|---|---|---|
| Quadrant | DetID | PixID | Counts | Sigma | Mean | Median | Sigma |
| A | 0 | 29 | 2585 | 10.77 | 711 | 666 | 178.2 |
| A | 0 | 30 | 2059 | 7.82 | 711 | 666 | 178.2 |
| A | 7 | 110 | 2052 | 7.78 | 711 | 666 | 178.2 |
| B | 2 | 9 | 2080 | 10.39 | 688 | 655 | 137.1 |
| B | 5 | 128 | 1734 | 7.87 | 688 | 655 | 137.1 |
| B | 2 | 8 | 1726 | 7.81 | 688 | 655 | 137.1 |
| C | 1 | 81 | 1997 | 7.31 | 709 | 664 | 182.4 |
| C | 1 | 80 | 1995 | 7.3 | 709 | 664 | 182.4 |
| C | 2 | 191 | 1803 | 6.25 | 709 | 664 | 182.4 |
| D | 3 | 14 | 1568 | 6.11 | 616 | 560 | 165.0 |
| D | 6 | 231 | 1561 | 6.07 | 616 | 560 | 165.0 |
| D | 6 | 67 | 1515 | 5.79 | 616 | 560 | 165.0 |
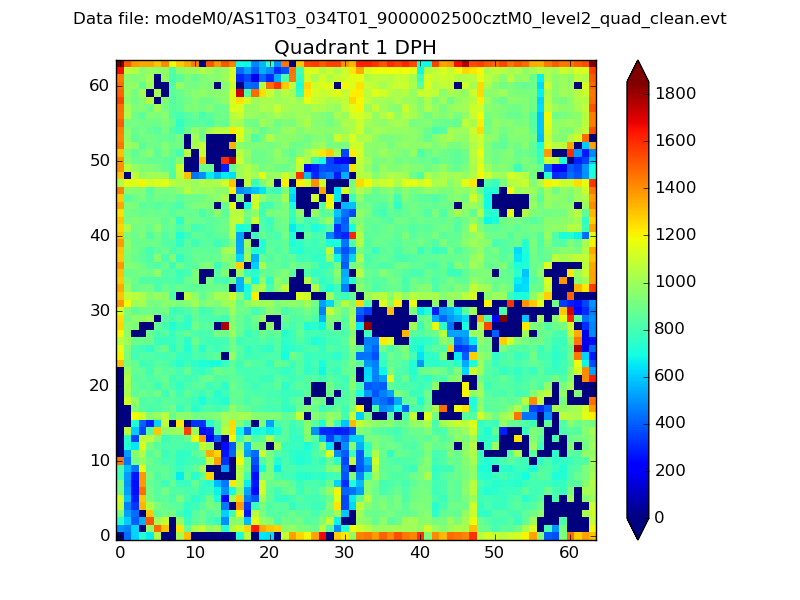
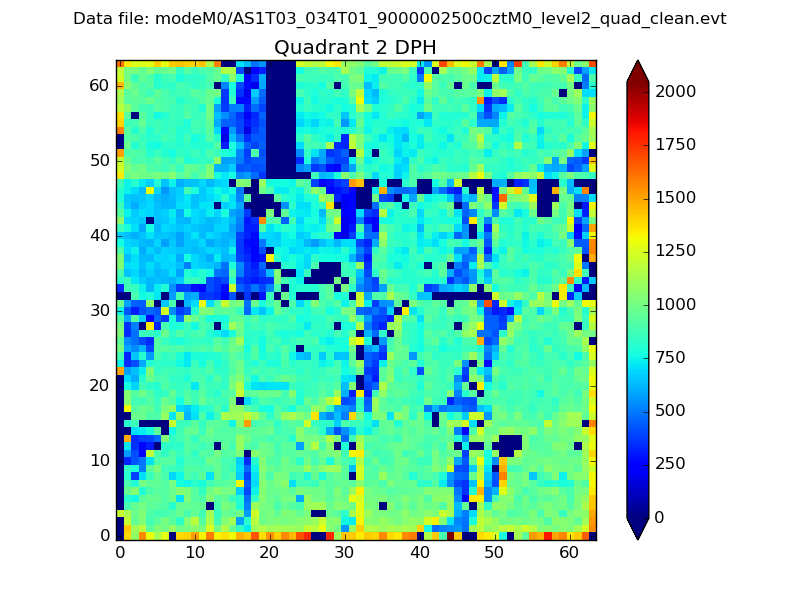
Histogram calculated using DETX and DETY for each event in the final _common_clean file
| Quadrant A | 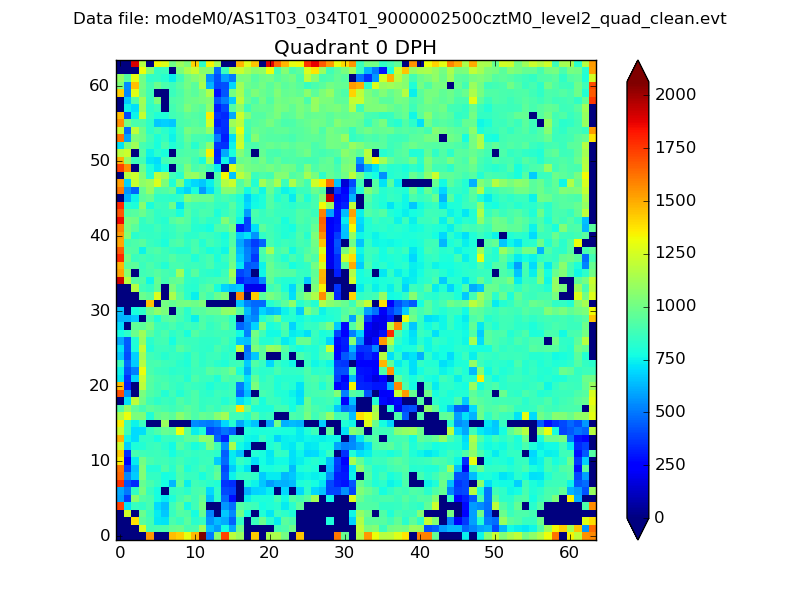 |
 |
Quadrant B |
|---|---|---|---|
| Quadrant D |  |
 |
Quadrant C |
| Plot type | Count rate plots | Images |
|---|---|---|
| Comparison with Poisson distribution Blue bars denote a histogram of data divided into 1 sec bins. Red curve is a Poisson curve with rate = median count rate of data. |
 |
 |
| Quadrant-wise count rates Data is divided into 100 sec bins |
 |
|
| Module-wise count rates for Quadrant A Data is divided into 100 sec bins |
 |
 |
| Module-wise count rates for Quadrant B Data is divided into 100 sec bins |
 |
 |
| Module-wise count rates for Quadrant C Data is divided into 100 sec bins |
 |
 |
| Module-wise count rates for Quadrant D Data is divided into 100 sec bins |
 |
 |
| Parameter | Plot |
|---|---|
| CZT HV Monitor |  |
| D_VDD | 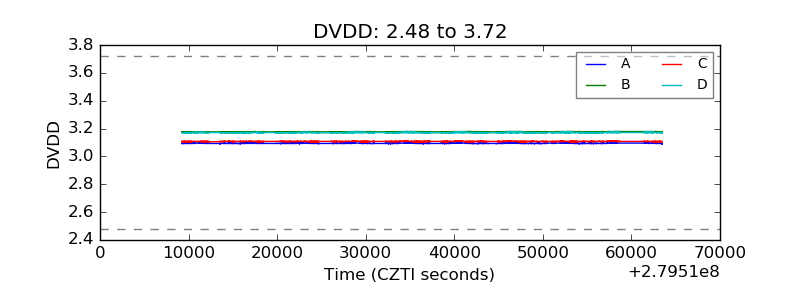 |
| Temperature 1 |  |
| Veto HV Monitor |  |
| Veto LLD |  |
| Alpha Counter | 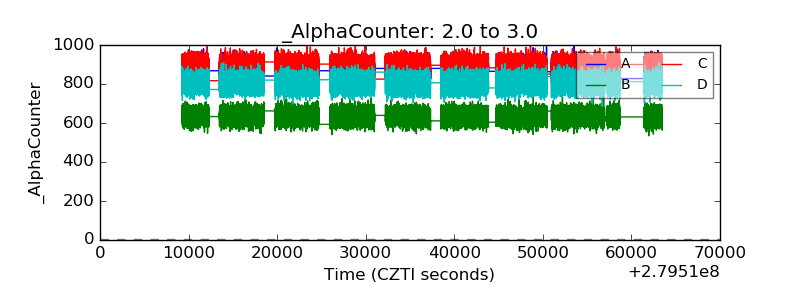 |
| _CPM_Rate |  |
| CZT Counter | 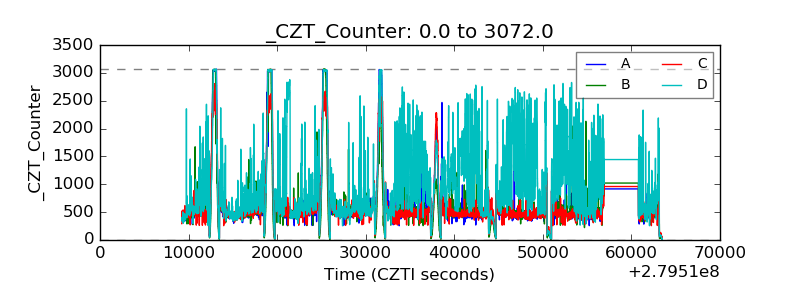 |
| +2.5 Volts monitor |  |
| +5 Volts monitor |  |
| _ROLL_ROT |  |
| _Roll_DEC |  |
| _Roll_RA |  |
| Veto Counter |  |