| Param | Original file | Final file |
|---|---|---|
| Filename | modeM0/AS1T03_034T01_9000002500_16861cztM0_level2.evt | modeM0/AS1T03_034T01_9000002500_16861cztM0_level2_quad_clean.evt |
| Size (bytes) | 764,020,800 | 86,425,920 |
| Size | 728.6 MB | 82.4 MB |
| Events in quadrant A | 4,772,080 | 491,553 |
| Events in quadrant B | 5,143,119 | 507,040 |
| Events in quadrant C | 4,979,905 | 482,124 |
| Events in quadrant D | 7,586,685 | 463,298 |
| Mode M9 | |||
|---|---|---|---|
| Quadrant | BADHDUFLAG | Total packets | Discarded packets |
| A | 0 | 23 | 0 |
| B | 0 | 23 | 0 |
| C | 0 | 23 | 0 |
| D | 0 | 23 | 0 |
| Mode M0 | |||
|---|---|---|---|
| Quadrant | BADHDUFLAG | Total packets | Discarded packets |
| A | 0 | 20059 | 3 |
| B | 0 | 21303 | 2 |
| C | 0 | 20425 | 2 |
| D | 0 | 29200 | 10 |
| Mode SS | |||
|---|---|---|---|
| Quadrant | BADHDUFLAG | Total packets | Discarded packets |
| A | 0 | 200 | 0 |
| B | 0 | 200 | 0 |
| C | 0 | 200 | 0 |
| D | 0 | 200 | 0 |
| Quadrant | Total seconds | Saturated seconds | Saturation percentage |
|---|---|---|---|
| A | 9699 | 43 | 0.443345% |
| B | 9699 | 92 | 0.948551% |
| C | 9699 | 81 | 0.835138% |
| D | 9698 | 630 | 6.496185% |
Noise dominated data is calculated using 1-second bins in cleaned event files. If a bin has >2000 counts, and if more than 50% of those come from <1% of pixels, then it is considered to be noise-dominated and hence unusable.
| Quadrant | # 1 sec bins | Bins with >0 counts | Bins with >2000 counts | High rate bins dominated by noise | Noise dominated (total time) | Noise dominated (detector-on time) | Marked lightcurve |
|---|---|---|---|---|---|---|---|
| A | 12095 | 9702 | 0 | 0 | 0.00% | 0.00% |  |
| B | 12095 | 9702 | 3 | 3 | 0.02% | 0.03% | 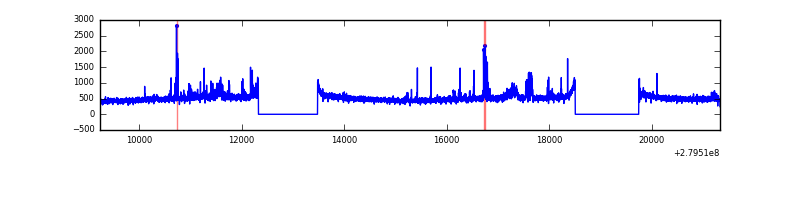 |
| C | 12095 | 9702 | 1 | 1 | 0.01% | 0.01% | 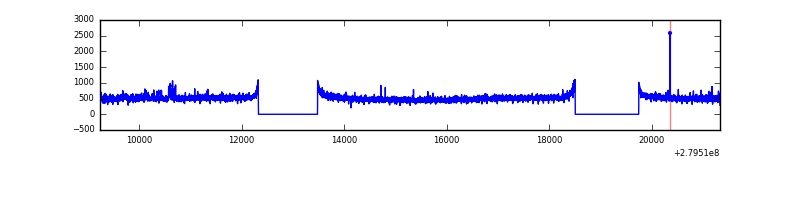 |
| D | 12095 | 9702 | 503 | 503 | 4.16% | 5.18% | 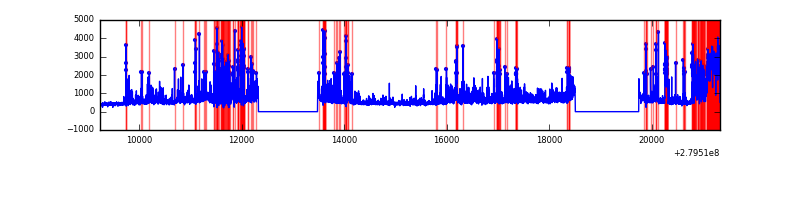 |
Top three noisy pixels from each quadrant. If the there are fewer than three noisy pixels in the level2.evt file, extra rows are filled as -1
| Pixel properties | Quadrant properties | ||||||
|---|---|---|---|---|---|---|---|
| Quadrant | DetID | PixID | Counts | Sigma | Mean | Median | Sigma |
| A | 0 | 23 | 17026 | 64.2 | 1235 | 1212 | 246.3 |
| A | 0 | 226 | 12009 | 43.83 | 1235 | 1212 | 246.3 |
| A | 12 | 194 | 8921 | 31.3 | 1235 | 1212 | 246.3 |
| B | 15 | 35 | 210781 | 914.1 | 1229 | 1201 | 229.3 |
| B | 4 | 216 | 56196 | 239.87 | 1229 | 1201 | 229.3 |
| B | 3 | 209 | 29259 | 122.38 | 1229 | 1201 | 229.3 |
| C | 14 | 238 | 185472 | 668.62 | 1189 | 1201 | 275.6 |
| C | 3 | 233 | 141754 | 509.99 | 1189 | 1201 | 275.6 |
| C | 0 | 207 | 15088 | 50.39 | 1189 | 1201 | 275.6 |
| D | 1 | 52 | 3071823 | 10755.02 | 1174 | 1140 | 285.5 |
| D | 2 | 234 | 37701 | 128.05 | 1174 | 1140 | 285.5 |
| D | 15 | 145 | 29397 | 98.97 | 1174 | 1140 | 285.5 |
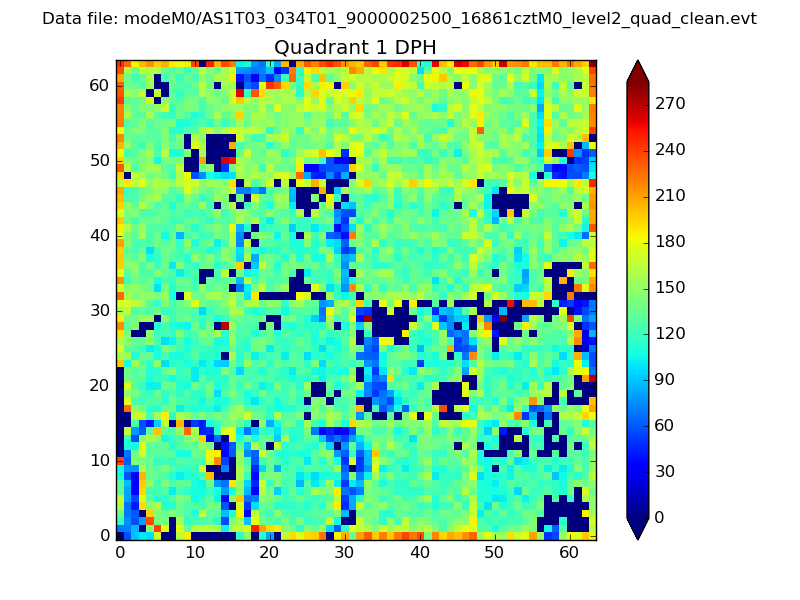
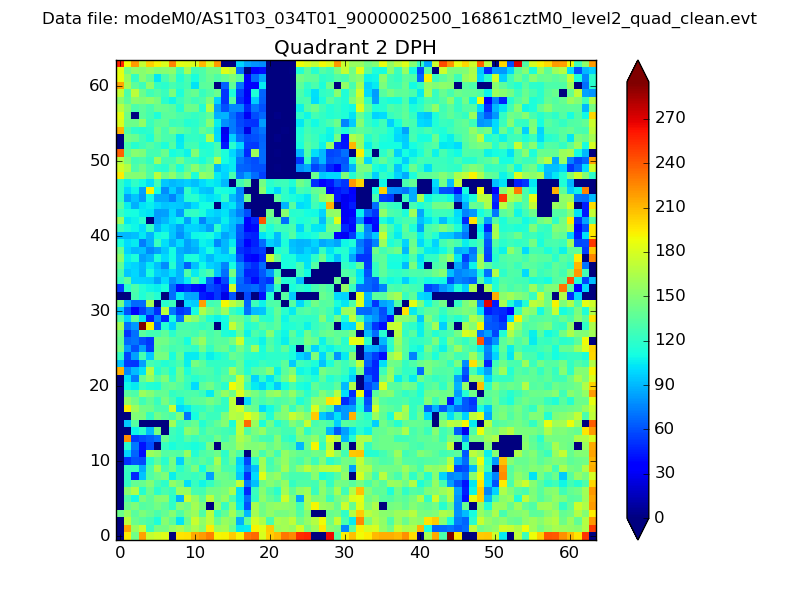
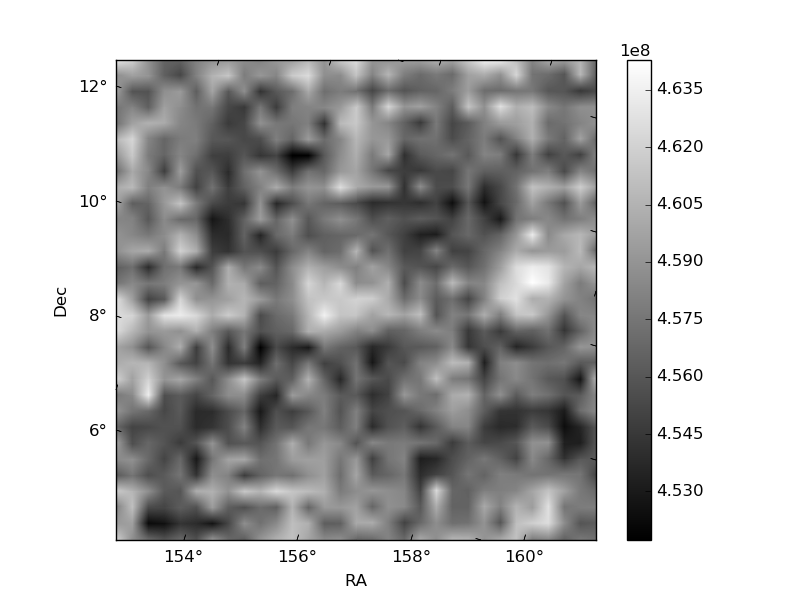
Histogram calculated using DETX and DETY for each event in the final _common_clean file
| Quadrant A | 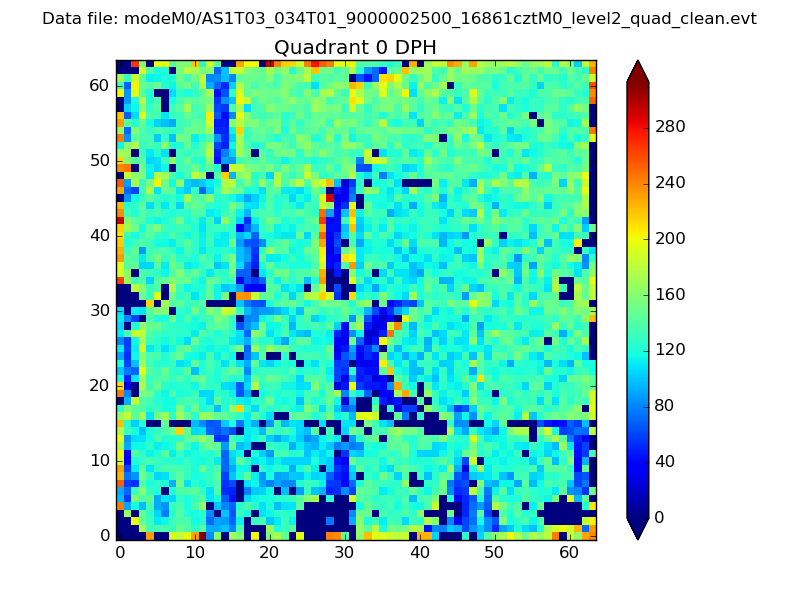 |
 |
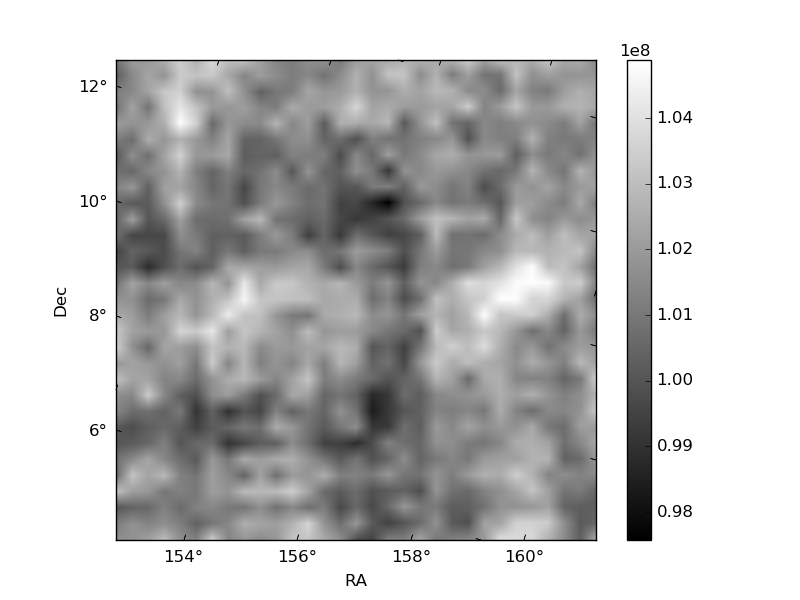
Quadrant B |
|---|---|---|---|
| Quadrant D | 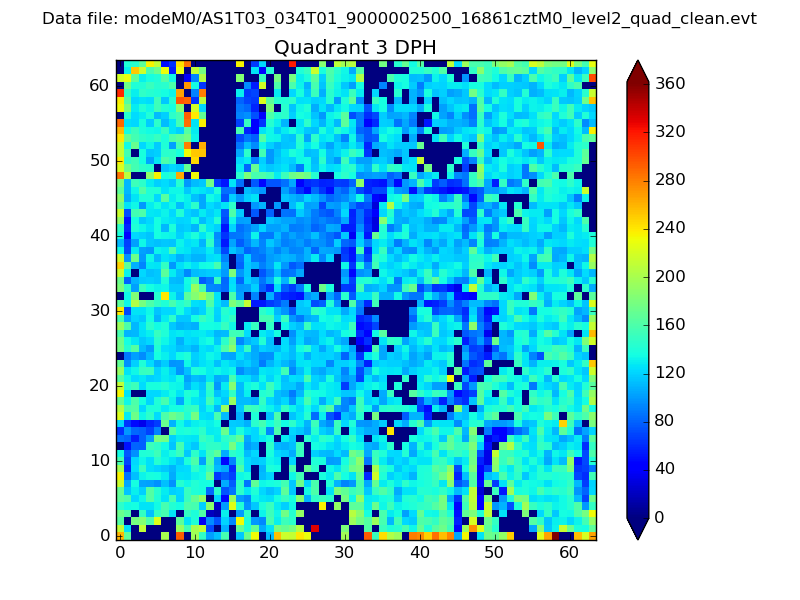 |
 |
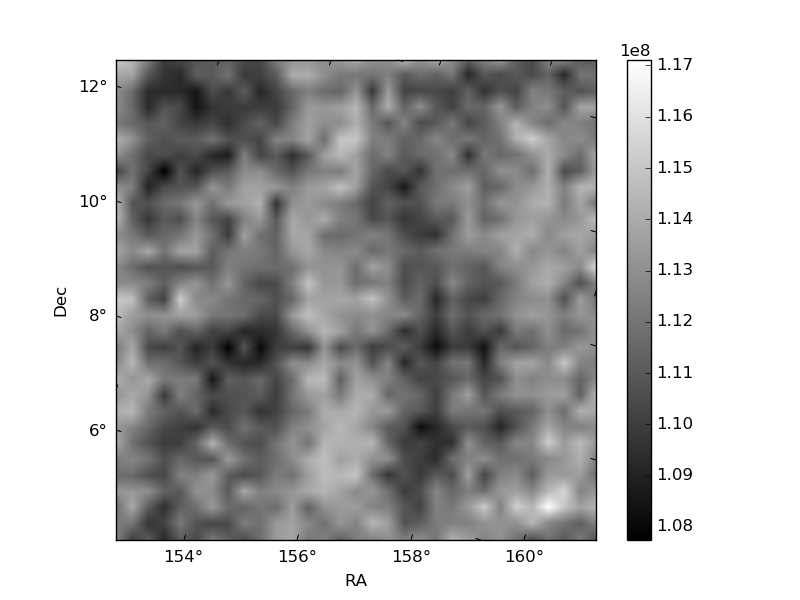
Quadrant C |
| Plot type | Count rate plots | Images |
|---|---|---|
| Comparison with Poisson distribution Blue bars denote a histogram of data divided into 1 sec bins. Red curve is a Poisson curve with rate = median count rate of data. |
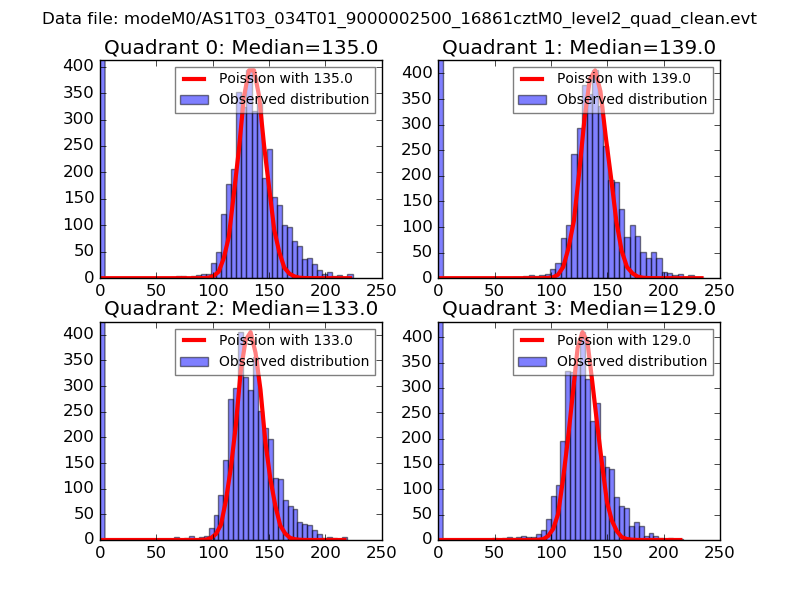 |
 |
| Quadrant-wise count rates Data is divided into 100 sec bins |
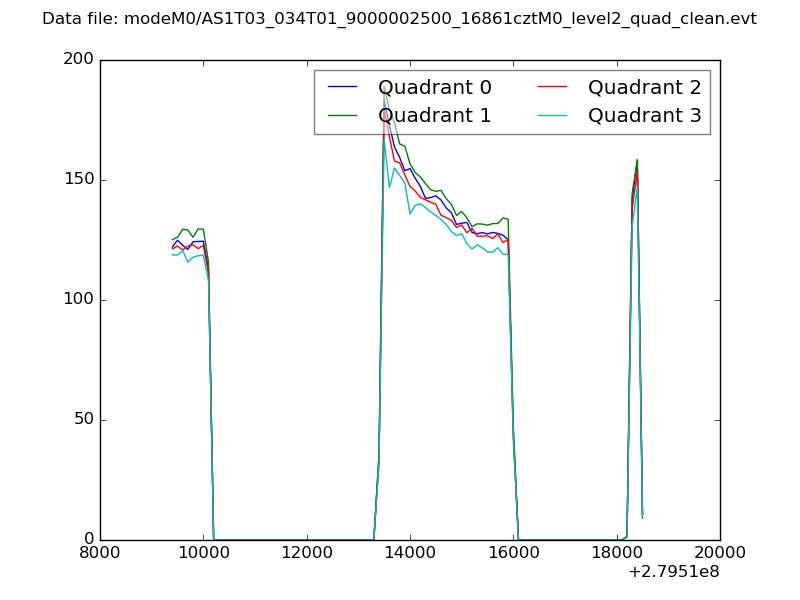 |
|
| Module-wise count rates for Quadrant A Data is divided into 100 sec bins |
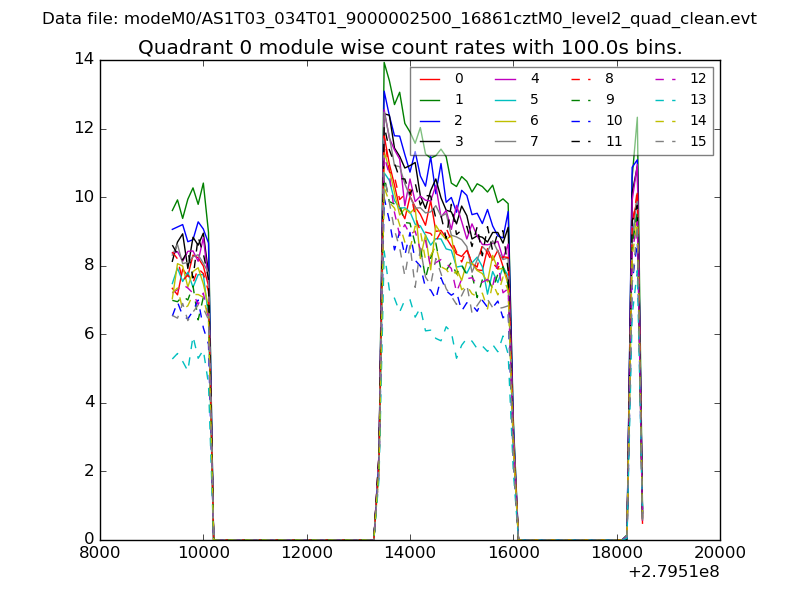 |
 |
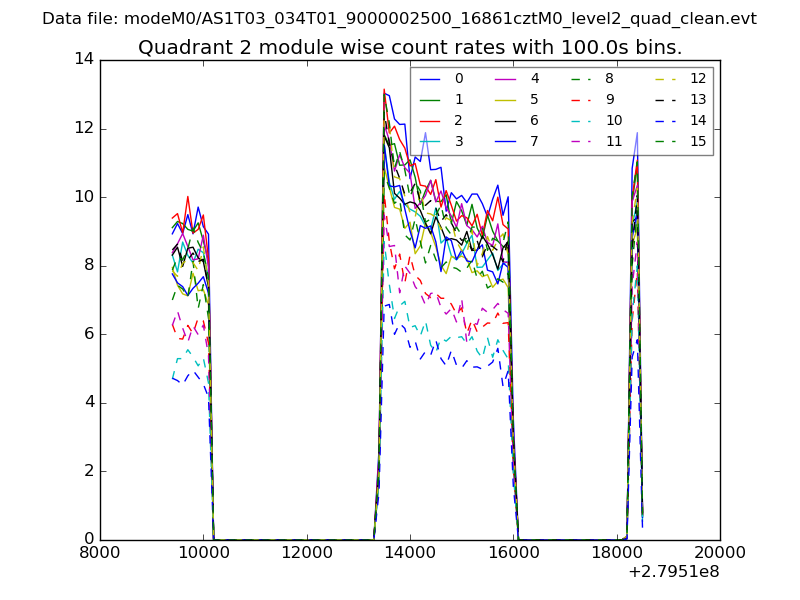
| Module-wise count rates for Quadrant B Data is divided into 100 sec bins |
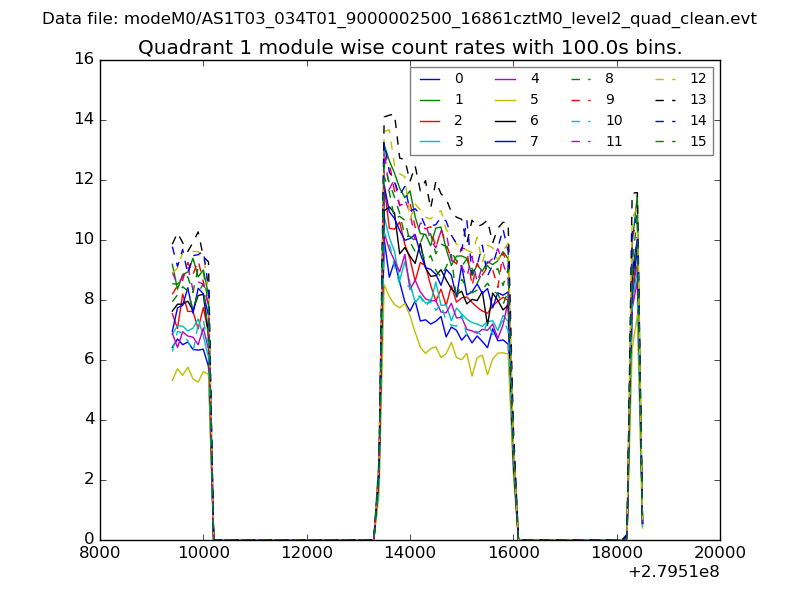 |
 |
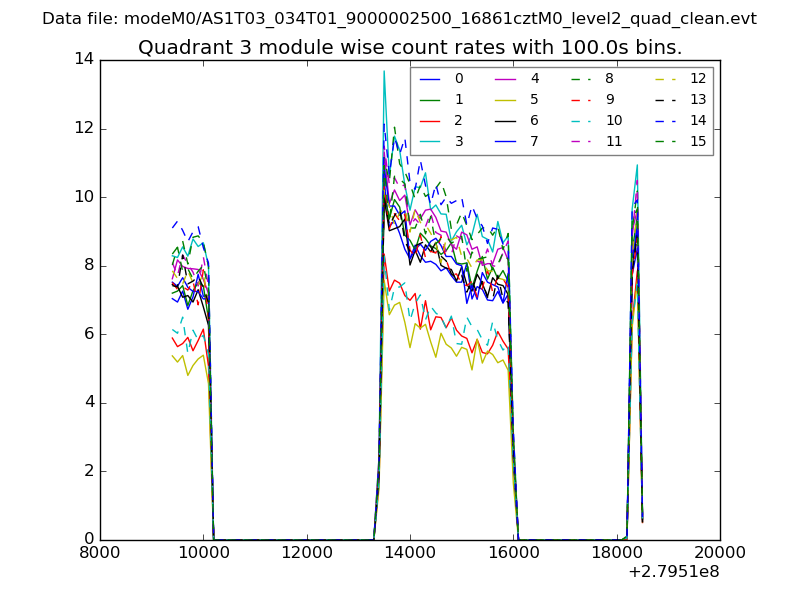
| Module-wise count rates for Quadrant C Data is divided into 100 sec bins |
 |
 |
| Module-wise count rates for Quadrant D Data is divided into 100 sec bins |
 |
 |
| Parameter | Plot |
|---|---|
| CZT HV Monitor | 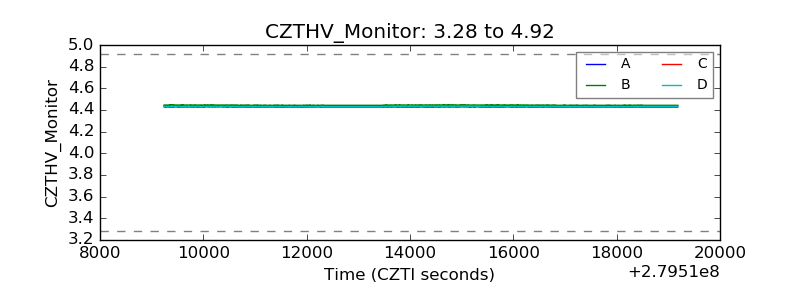 |
| D_VDD |  |
| Temperature 1 | 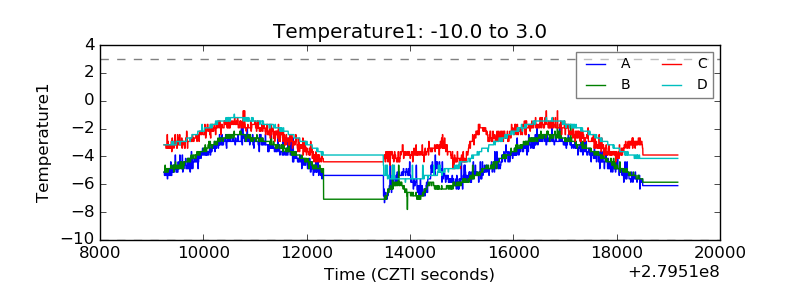 |
| Veto HV Monitor | 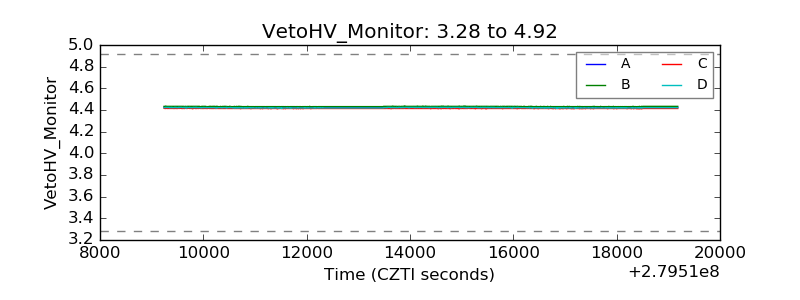 |
| Veto LLD | 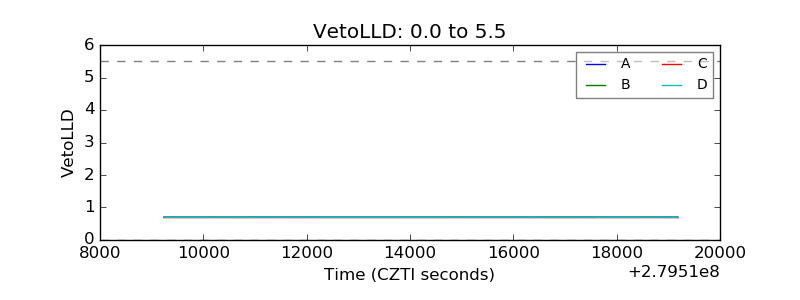 |
| Alpha Counter | 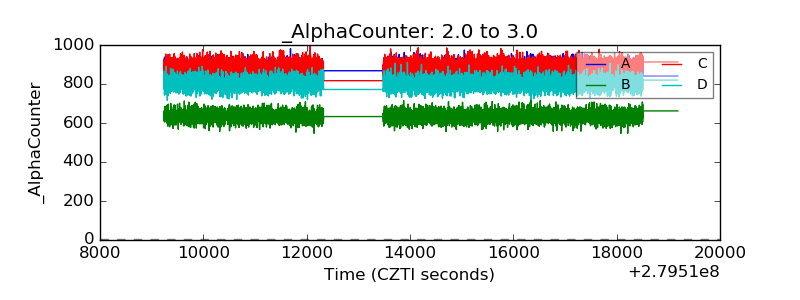 |
| _CPM_Rate | 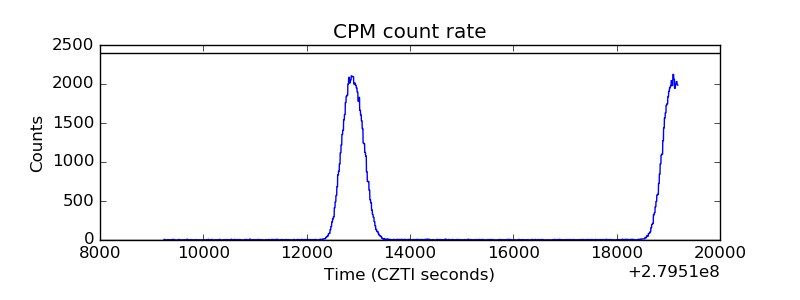 |
| CZT Counter | 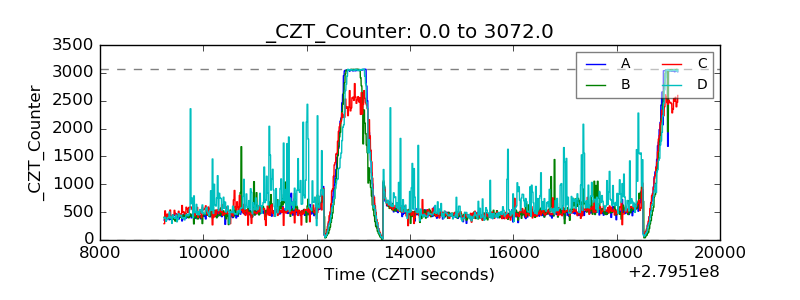 |
| +2.5 Volts monitor |  |
| +5 Volts monitor | 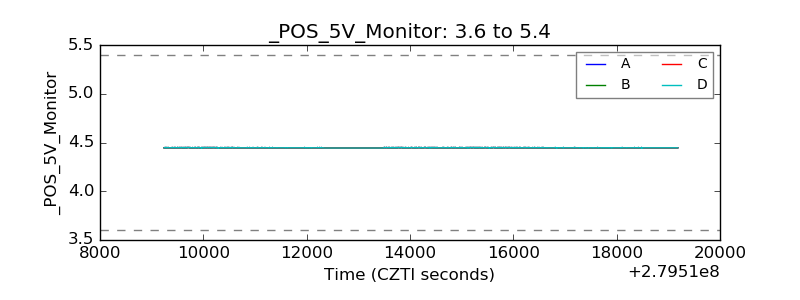 |
| _ROLL_ROT | 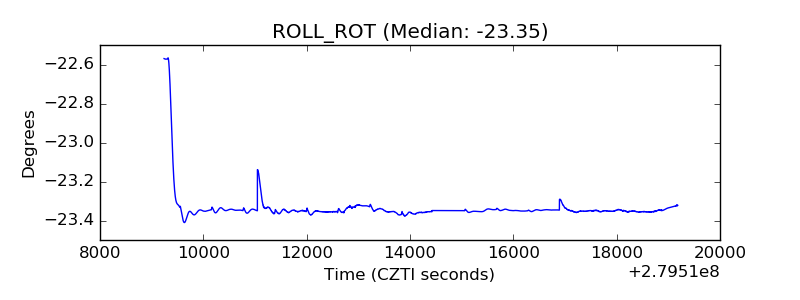 |
| _Roll_DEC | 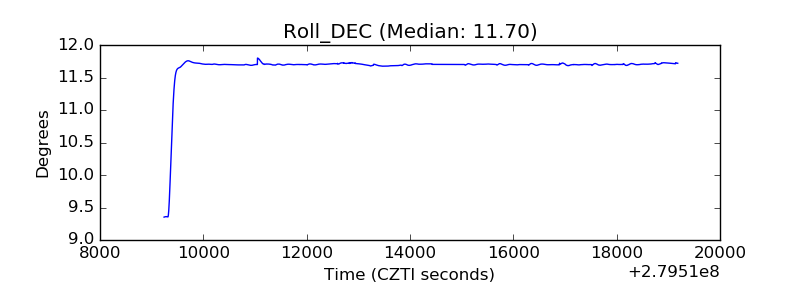 |
| _Roll_RA | 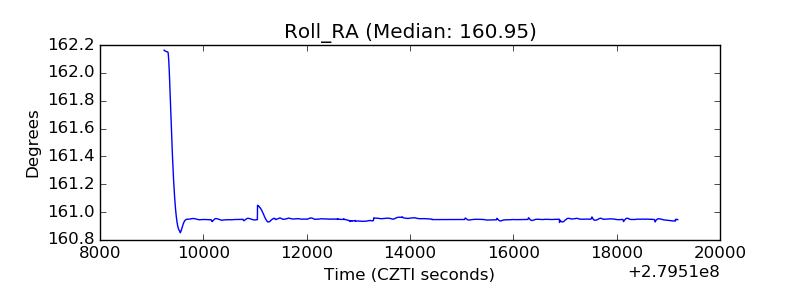 |
| Veto Counter | 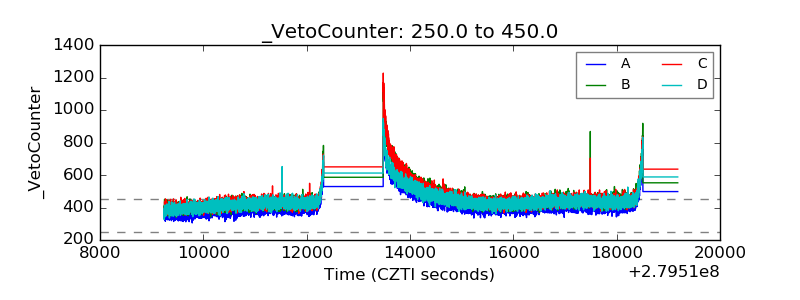 |