| Param | Original file | Final file |
|---|---|---|
| Filename | modeM0/AS1T03_034T01_9000002500_16862cztM0_level2.evt | modeM0/AS1T03_034T01_9000002500_16862cztM0_level2_quad_clean.evt |
| Size (bytes) | 463,936,320 | 79,502,400 |
| Size | 442.4 MB | 75.8 MB |
| Events in quadrant A | 2,899,777 | 514,918 |
| Events in quadrant B | 3,050,822 | 529,232 |
| Events in quadrant C | 2,948,702 | 505,269 |
| Events in quadrant D | 4,762,558 | 457,822 |
| Mode M9 | |||
|---|---|---|---|
| Quadrant | BADHDUFLAG | Total packets | Discarded packets |
| A | 0 | 12 | 0 |
| B | 0 | 12 | 0 |
| C | 0 | 12 | 0 |
| D | 0 | 12 | 0 |
| Mode M0 | |||
|---|---|---|---|
| Quadrant | BADHDUFLAG | Total packets | Discarded packets |
| A | 0 | 11899 | 2 |
| B | 0 | 12331 | 1 |
| C | 0 | 11989 | 1 |
| D | 0 | 17877 | 1 |
| Mode SS | |||
|---|---|---|---|
| Quadrant | BADHDUFLAG | Total packets | Discarded packets |
| A | 0 | 118 | 0 |
| B | 0 | 118 | 0 |
| C | 0 | 118 | 0 |
| D | 0 | 118 | 0 |
| Quadrant | Total seconds | Saturated seconds | Saturation percentage |
|---|---|---|---|
| A | 5716 | 65 | 1.137159% |
| B | 5716 | 99 | 1.731980% |
| C | 5716 | 103 | 1.801959% |
| D | 5716 | 560 | 9.797061% |
Noise dominated data is calculated using 1-second bins in cleaned event files. If a bin has >2000 counts, and if more than 50% of those come from <1% of pixels, then it is considered to be noise-dominated and hence unusable.
| Quadrant | # 1 sec bins | Bins with >0 counts | Bins with >2000 counts | High rate bins dominated by noise | Noise dominated (total time) | Noise dominated (detector-on time) | Marked lightcurve |
|---|---|---|---|---|---|---|---|
| A | 6972 | 5718 | 0 | 0 | 0.00% | 0.00% | 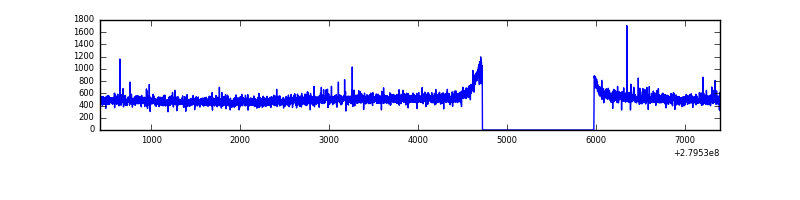 |
| B | 6972 | 5718 | 11 | 11 | 0.16% | 0.19% | 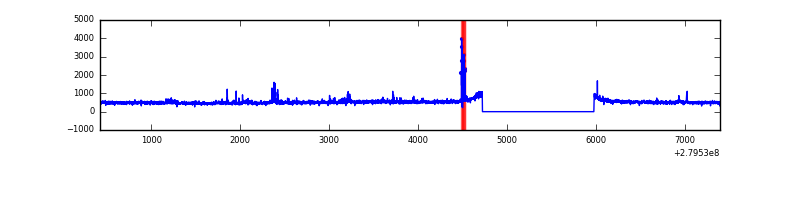 |
| C | 6972 | 5718 | 0 | 0 | 0.00% | 0.00% | 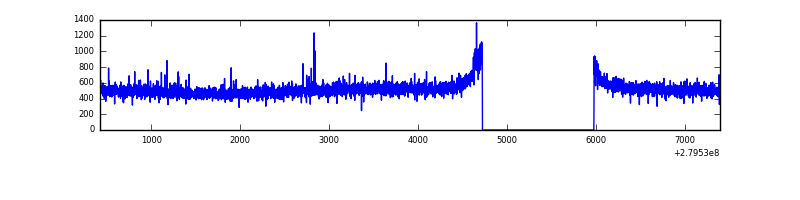 |
| D | 6972 | 5718 | 479 | 479 | 6.87% | 8.38% |  |
Top three noisy pixels from each quadrant. If the there are fewer than three noisy pixels in the level2.evt file, extra rows are filled as -1
| Pixel properties | Quadrant properties | ||||||
|---|---|---|---|---|---|---|---|
| Quadrant | DetID | PixID | Counts | Sigma | Mean | Median | Sigma |
| A | 9 | 143 | 9935 | 60.54 | 751 | 737 | 151.9 |
| A | 0 | 226 | 6981 | 41.1 | 751 | 737 | 151.9 |
| A | 12 | 194 | 5620 | 32.14 | 751 | 737 | 151.9 |
| B | 10 | 16 | 57282 | 402.19 | 742 | 725 | 140.6 |
| B | 15 | 35 | 55002 | 385.98 | 742 | 725 | 140.6 |
| B | 0 | 197 | 21753 | 149.54 | 742 | 725 | 140.6 |
| C | 14 | 238 | 112442 | 661.98 | 720 | 727 | 168.8 |
| C | 0 | 207 | 26508 | 152.77 | 720 | 727 | 168.8 |
| C | 13 | 61 | 5250 | 26.8 | 720 | 727 | 168.8 |
| D | 1 | 52 | 1925250 | 11296.86 | 700 | 681 | 170.4 |
| D | 13 | 168 | 73363 | 426.63 | 700 | 681 | 170.4 |
| D | 10 | 70 | 50764 | 293.98 | 700 | 681 | 170.4 |
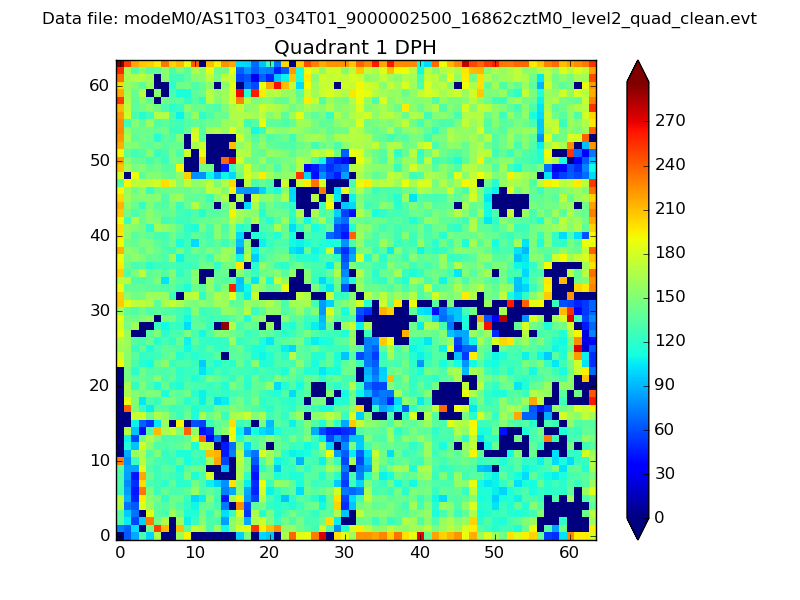
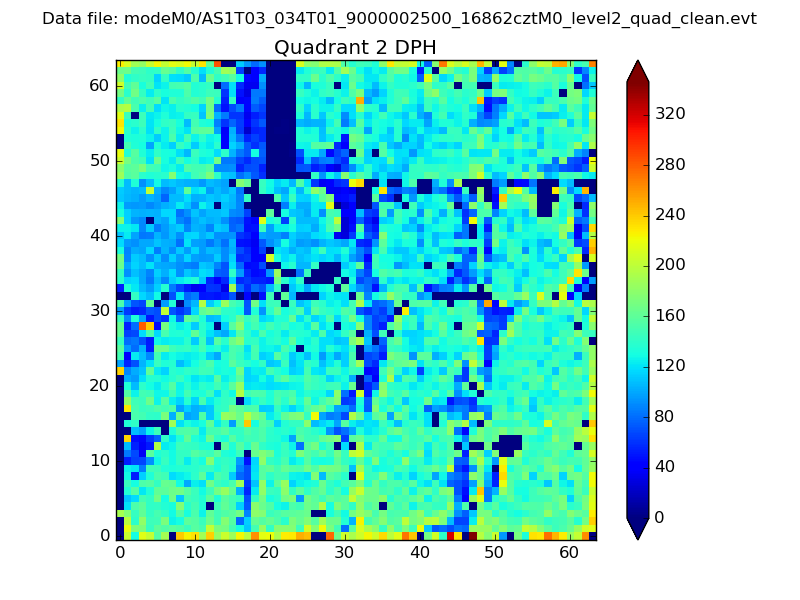
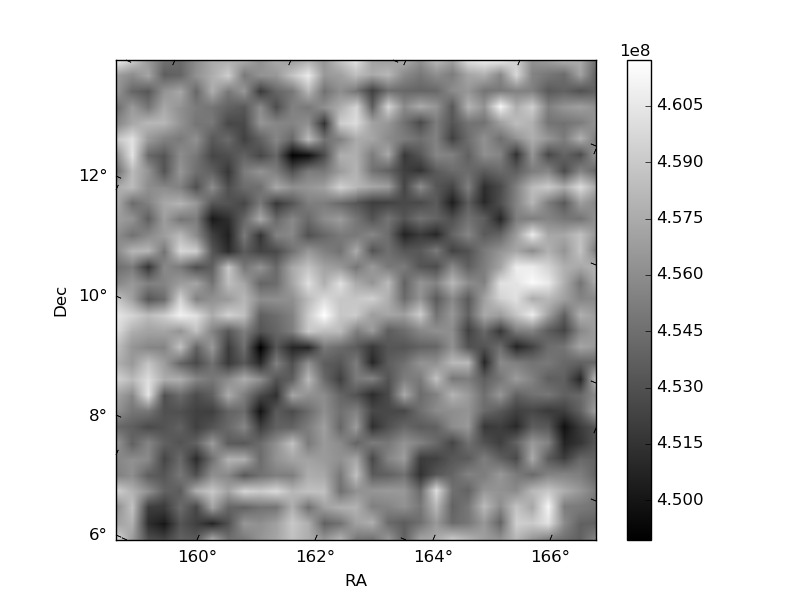
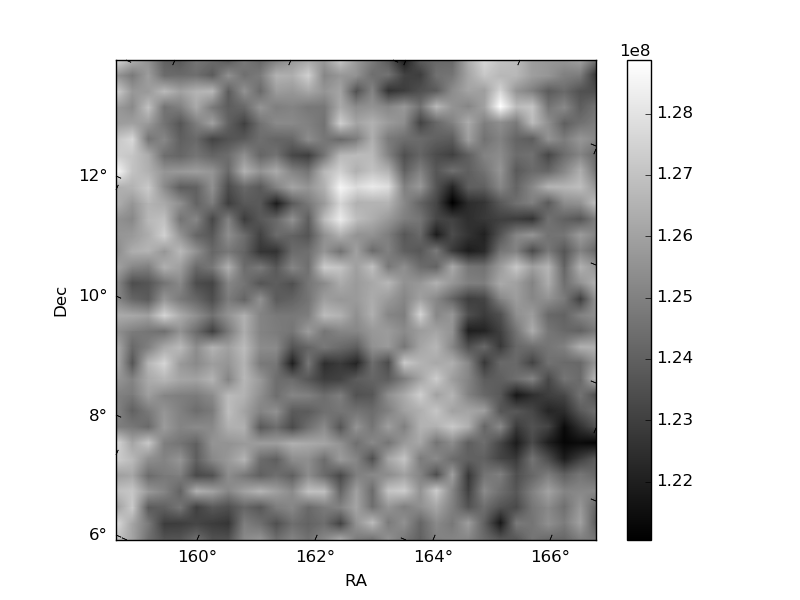
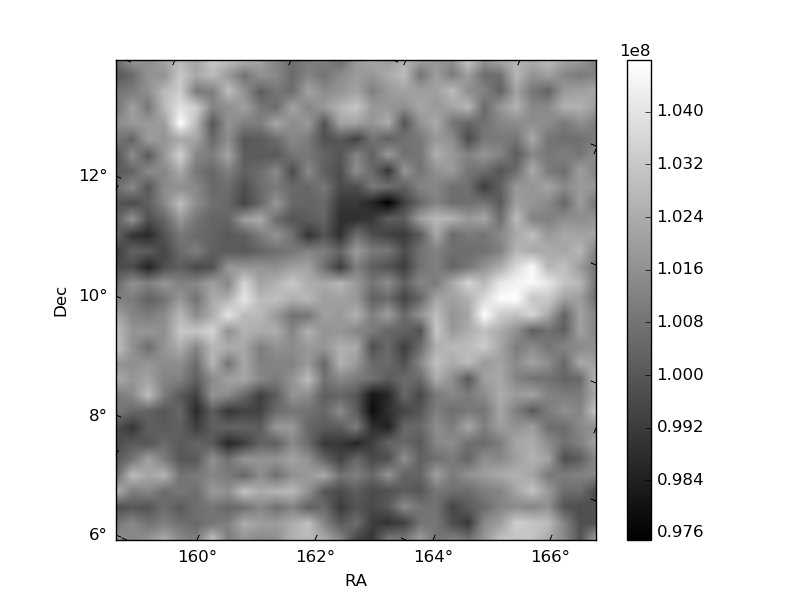
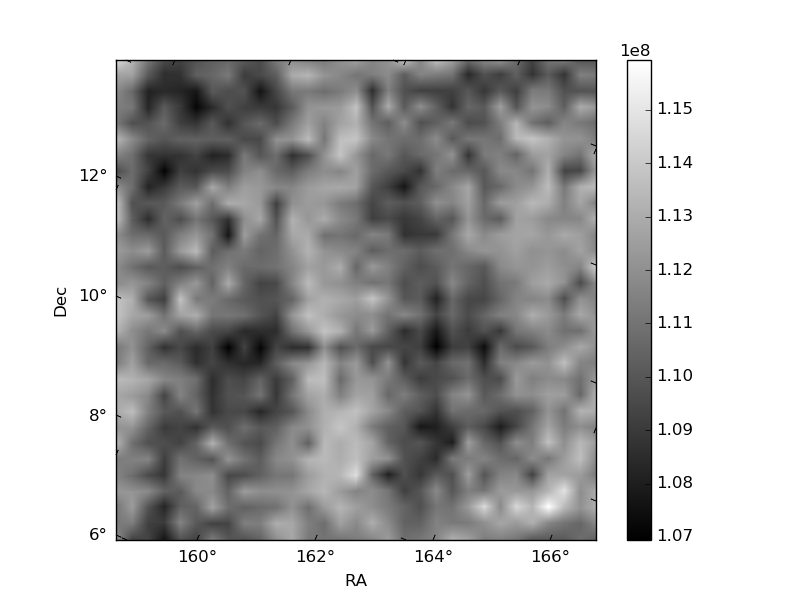
Histogram calculated using DETX and DETY for each event in the final _common_clean file
| Quadrant A | 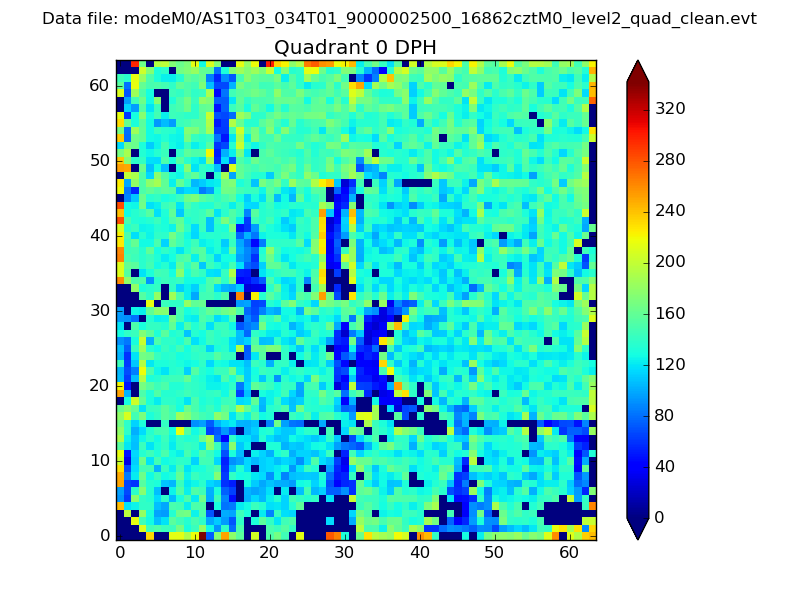 |
 |
Quadrant B |
|---|---|---|---|
| Quadrant D | 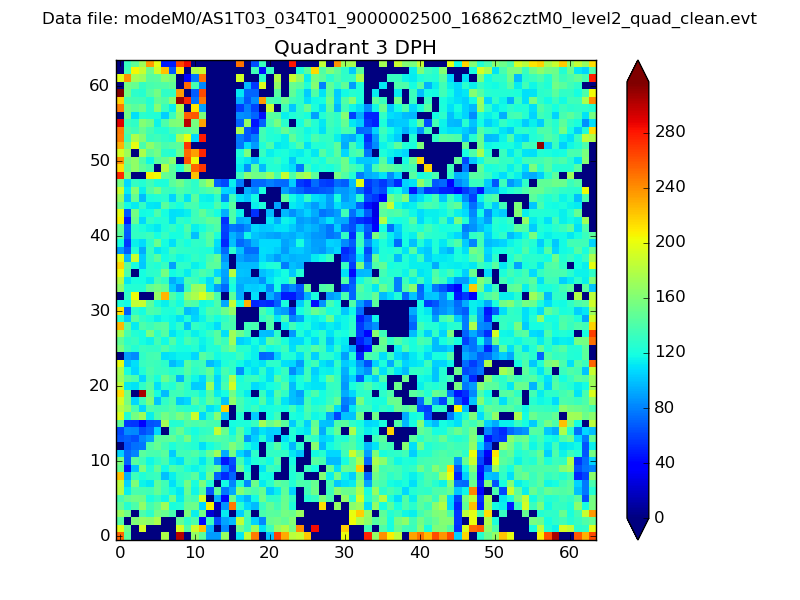 |
 |
Quadrant C |
| Plot type | Count rate plots | Images |
|---|---|---|
| Comparison with Poisson distribution Blue bars denote a histogram of data divided into 1 sec bins. Red curve is a Poisson curve with rate = median count rate of data. |
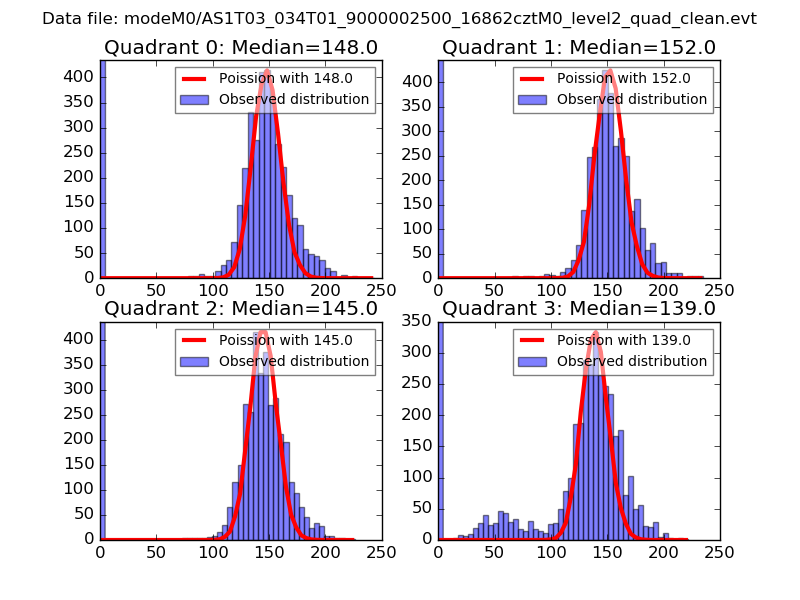 |
 |
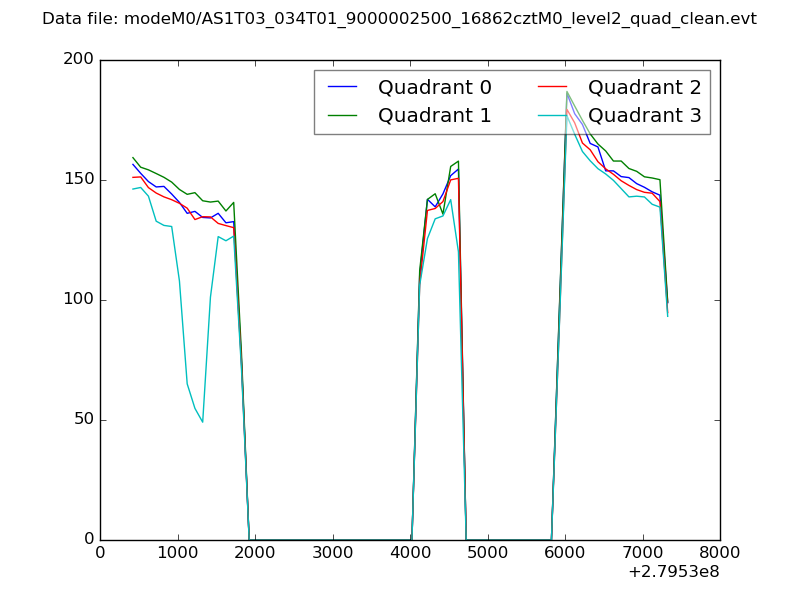
| Quadrant-wise count rates Data is divided into 100 sec bins |
 |
|
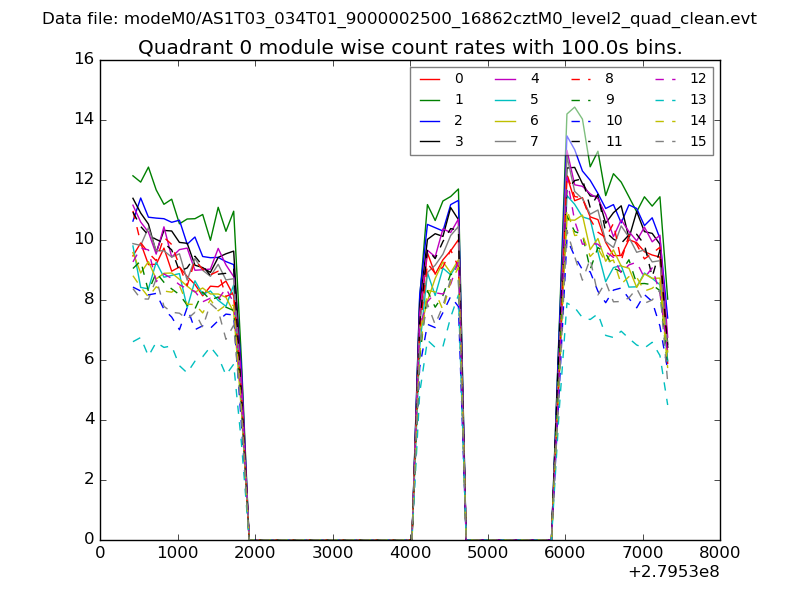
| Module-wise count rates for Quadrant A Data is divided into 100 sec bins |
 |
 |
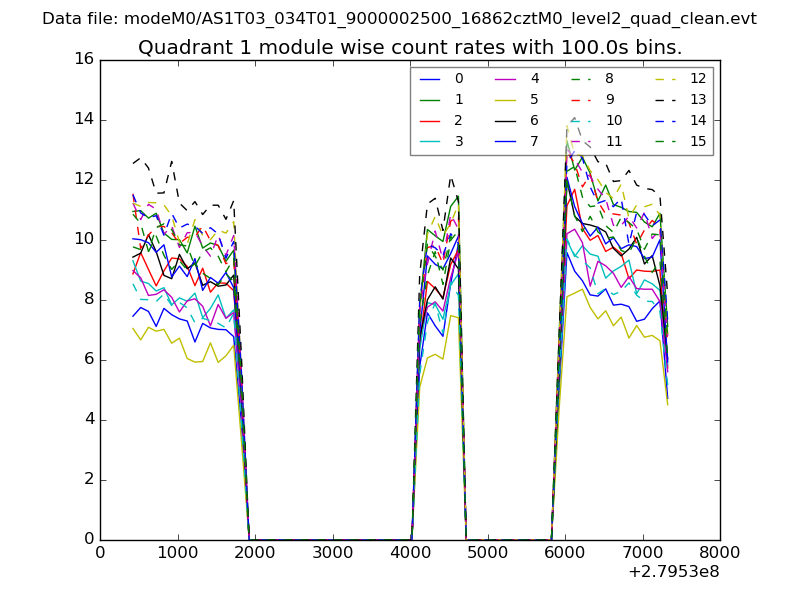
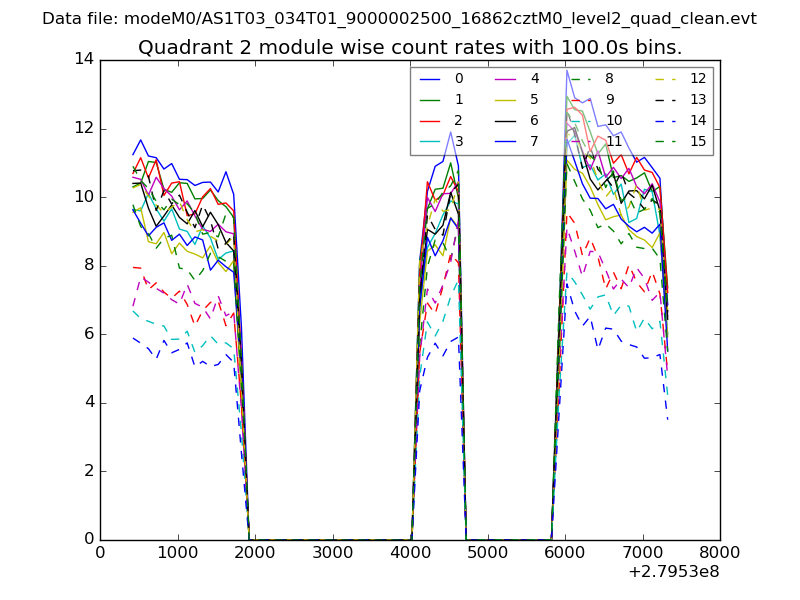
| Module-wise count rates for Quadrant B Data is divided into 100 sec bins |
 |
 |
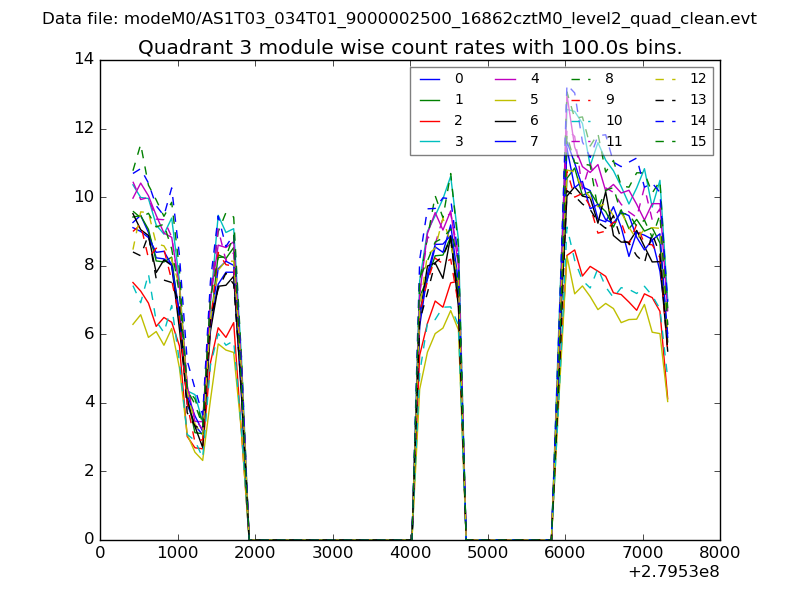
| Module-wise count rates for Quadrant C Data is divided into 100 sec bins |
 |
 |
| Module-wise count rates for Quadrant D Data is divided into 100 sec bins |
 |
 |
| Parameter | Plot |
|---|---|
| CZT HV Monitor | 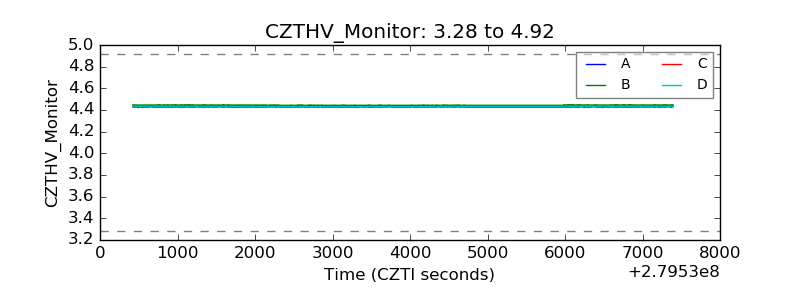 |
| D_VDD | 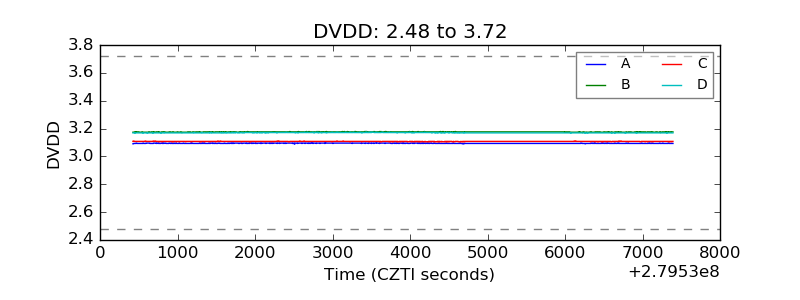 |
| Temperature 1 | 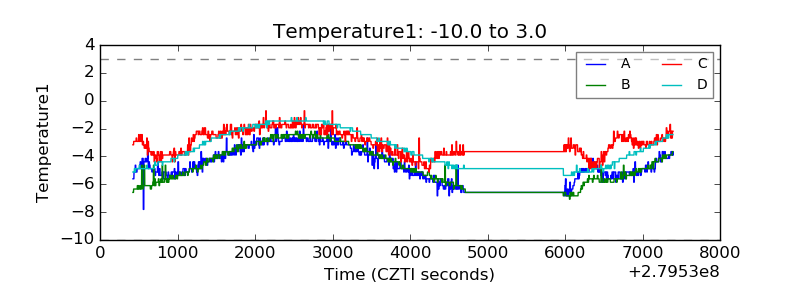 |
| Veto HV Monitor | 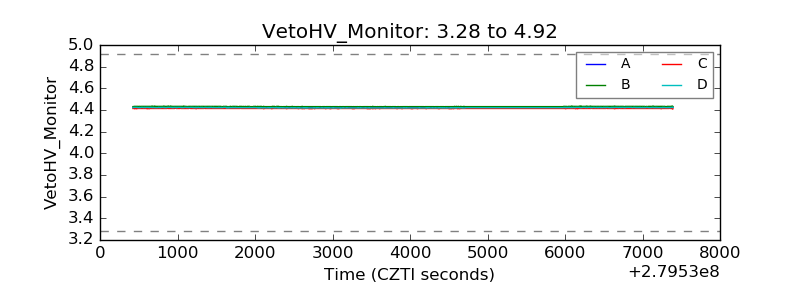 |
| Veto LLD | 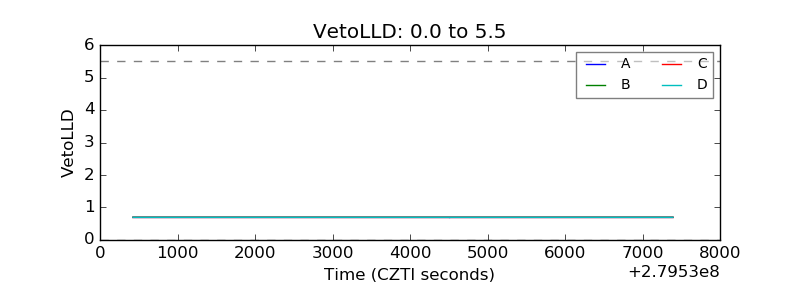 |
| Alpha Counter | 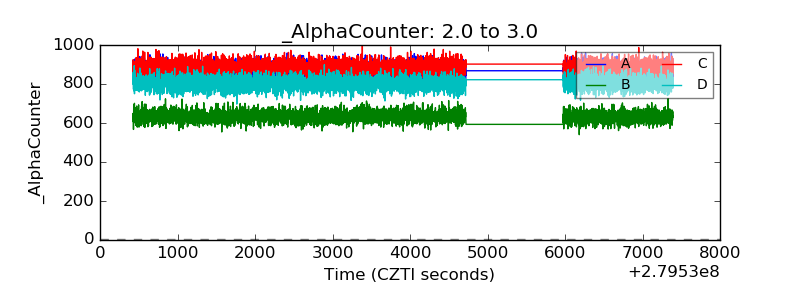 |
| _CPM_Rate | 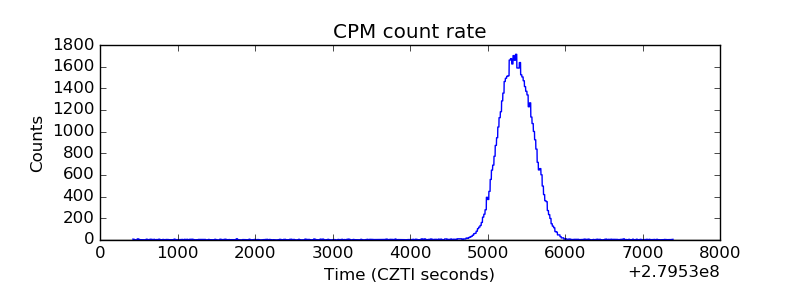 |
| CZT Counter | 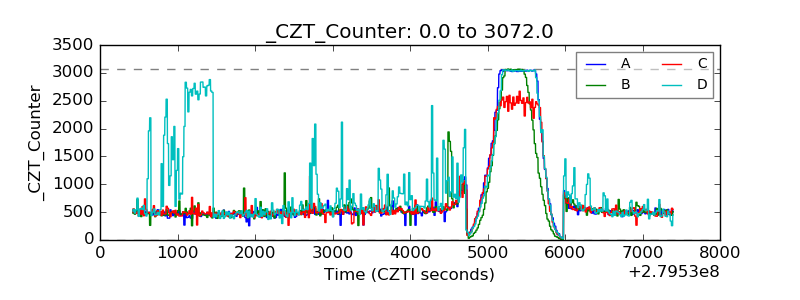 |
| +2.5 Volts monitor |  |
| +5 Volts monitor |  |
| _ROLL_ROT | 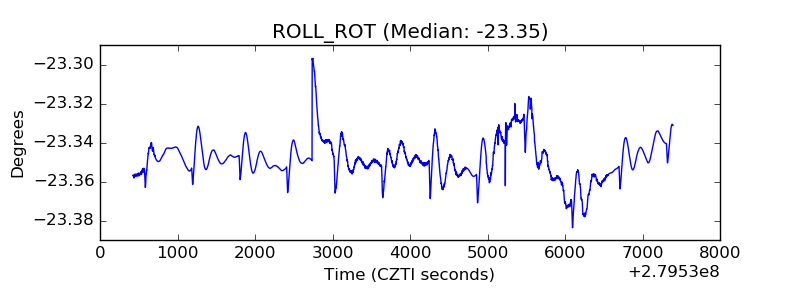 |
| _Roll_DEC | 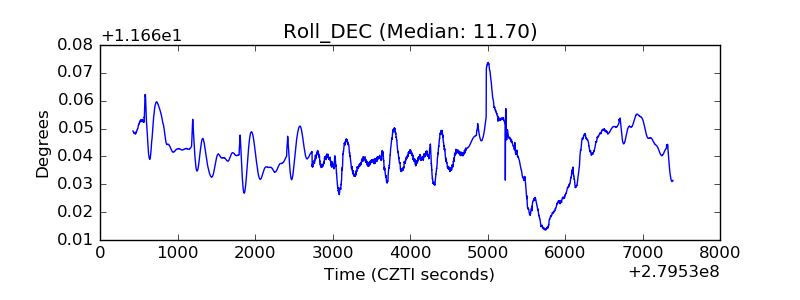 |
| _Roll_RA | 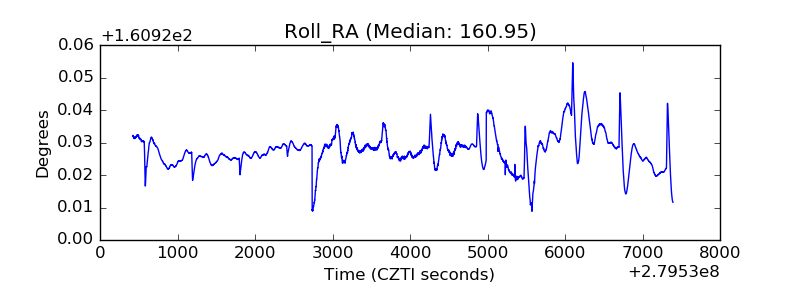 |
| Veto Counter | 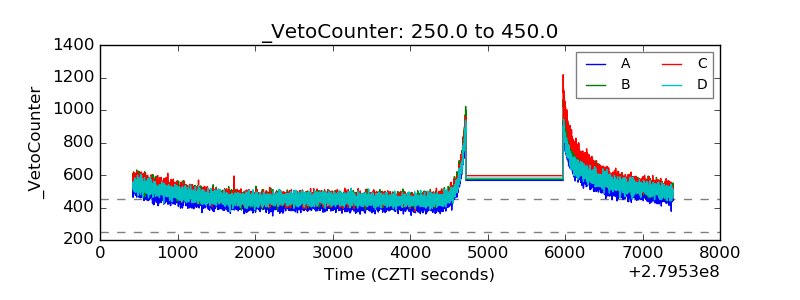 |