| Param | Original file | Final file |
|---|---|---|
| Filename | modeM0/AS1T03_034T01_9000002500_16863cztM0_level2.evt | modeM0/AS1T03_034T01_9000002500_16863cztM0_level2_quad_clean.evt |
| Size (bytes) | 434,102,400 | 79,701,120 |
| Size | 414.0 MB | 76.0 MB |
| Events in quadrant A | 2,965,710 | 509,741 |
| Events in quadrant B | 3,098,343 | 518,954 |
| Events in quadrant C | 2,964,069 | 498,997 |
| Events in quadrant D | 3,727,164 | 483,047 |
| Mode M9 | |||
|---|---|---|---|
| Quadrant | BADHDUFLAG | Total packets | Discarded packets |
| A | 0 | 12 | 0 |
| B | 0 | 12 | 0 |
| C | 0 | 12 | 0 |
| D | 0 | 12 | 0 |
| Mode M0 | |||
|---|---|---|---|
| Quadrant | BADHDUFLAG | Total packets | Discarded packets |
| A | 0 | 12073 | 2 |
| B | 0 | 12449 | 1 |
| C | 0 | 11977 | 1 |
| D | 0 | 14640 | 1 |
| Mode SS | |||
|---|---|---|---|
| Quadrant | BADHDUFLAG | Total packets | Discarded packets |
| A | 0 | 118 | 0 |
| B | 0 | 118 | 0 |
| C | 0 | 118 | 0 |
| D | 0 | 118 | 0 |
| Quadrant | Total seconds | Saturated seconds | Saturation percentage |
|---|---|---|---|
| A | 5760 | 96 | 1.666667% |
| B | 5760 | 109 | 1.892361% |
| C | 5760 | 119 | 2.065972% |
| D | 5760 | 168 | 2.916667% |
Noise dominated data is calculated using 1-second bins in cleaned event files. If a bin has >2000 counts, and if more than 50% of those come from <1% of pixels, then it is considered to be noise-dominated and hence unusable.
| Quadrant | # 1 sec bins | Bins with >0 counts | Bins with >2000 counts | High rate bins dominated by noise | Noise dominated (total time) | Noise dominated (detector-on time) | Marked lightcurve |
|---|---|---|---|---|---|---|---|
| A | 6986 | 5762 | 0 | 0 | 0.00% | 0.00% | 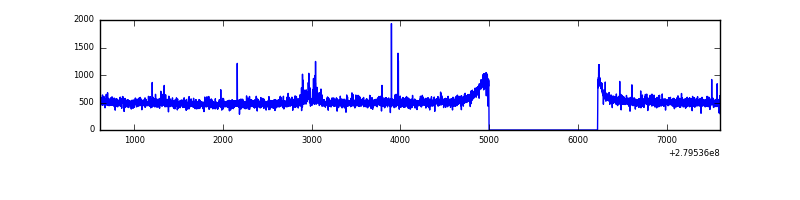 |
| B | 6986 | 5762 | 3 | 3 | 0.04% | 0.05% | 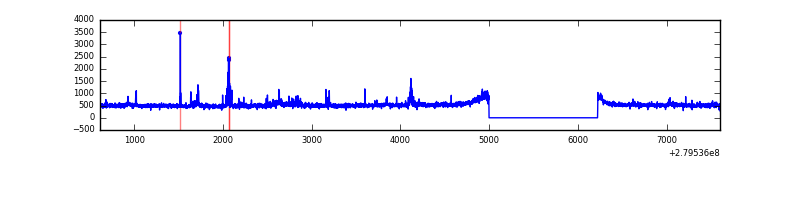 |
| C | 6986 | 5762 | 0 | 0 | 0.00% | 0.00% | 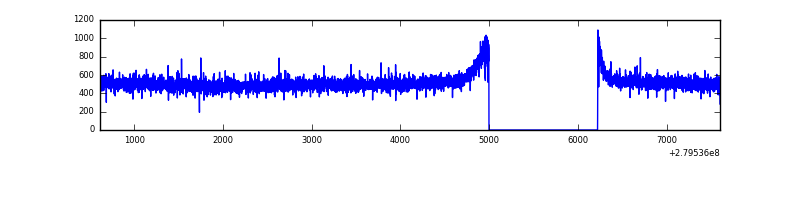 |
| D | 6986 | 5762 | 80 | 80 | 1.15% | 1.39% | 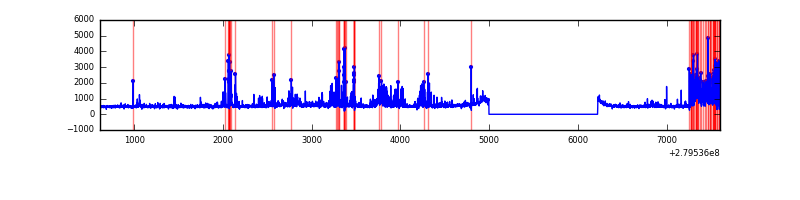 |
Top three noisy pixels from each quadrant. If the there are fewer than three noisy pixels in the level2.evt file, extra rows are filled as -1
| Pixel properties | Quadrant properties | ||||||
|---|---|---|---|---|---|---|---|
| Quadrant | DetID | PixID | Counts | Sigma | Mean | Median | Sigma |
| A | 15 | 174 | 27806 | 174.62 | 761 | 745 | 155.0 |
| A | 9 | 143 | 12285 | 74.46 | 761 | 745 | 155.0 |
| A | 0 | 226 | 7011 | 40.43 | 761 | 745 | 155.0 |
| B | 15 | 35 | 86085 | 596.33 | 751 | 735 | 143.1 |
| B | 0 | 219 | 22214 | 150.07 | 751 | 735 | 143.1 |
| B | 10 | 16 | 19453 | 130.78 | 751 | 735 | 143.1 |
| C | 14 | 238 | 112084 | 652.14 | 728 | 735 | 170.7 |
| C | 0 | 207 | 10027 | 54.42 | 728 | 735 | 170.7 |
| C | 13 | 61 | 5128 | 25.73 | 728 | 735 | 170.7 |
| D | 1 | 52 | 835472 | 4618.03 | 739 | 719 | 180.8 |
| D | 10 | 70 | 60546 | 330.98 | 739 | 719 | 180.8 |
| D | 2 | 234 | 27578 | 148.59 | 739 | 719 | 180.8 |
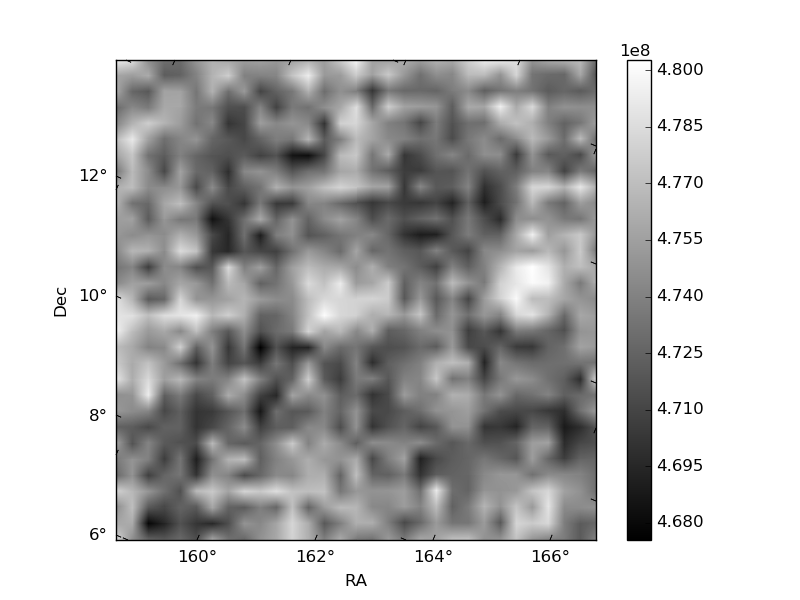
Histogram calculated using DETX and DETY for each event in the final _common_clean file
| Quadrant A | 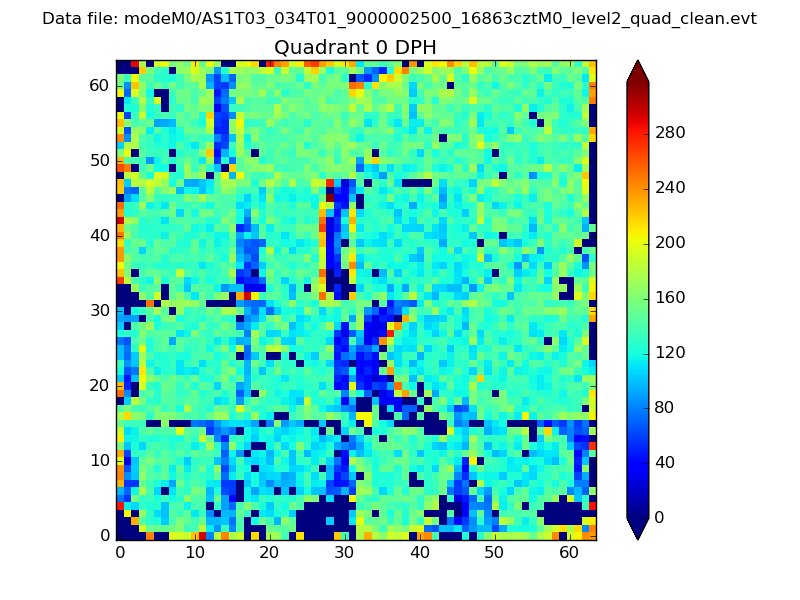 |
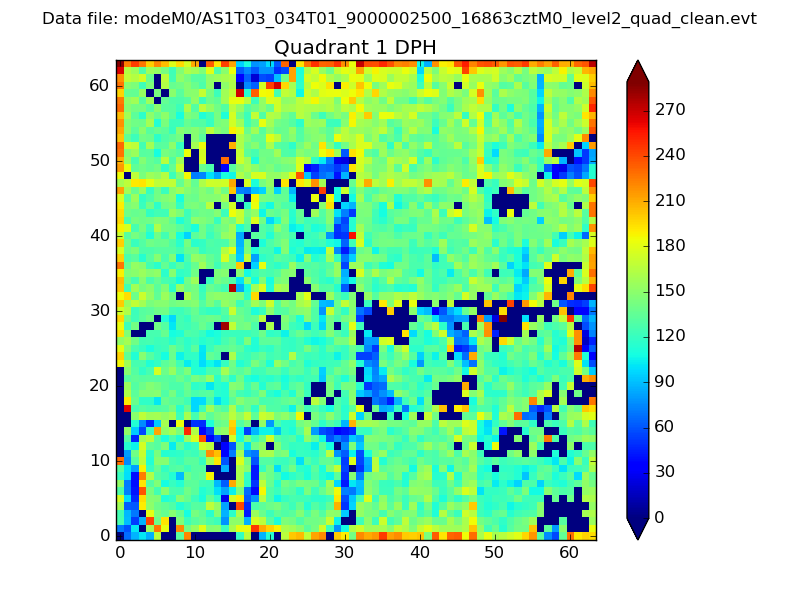 |
Quadrant B |
|---|---|---|---|
| Quadrant D |  |
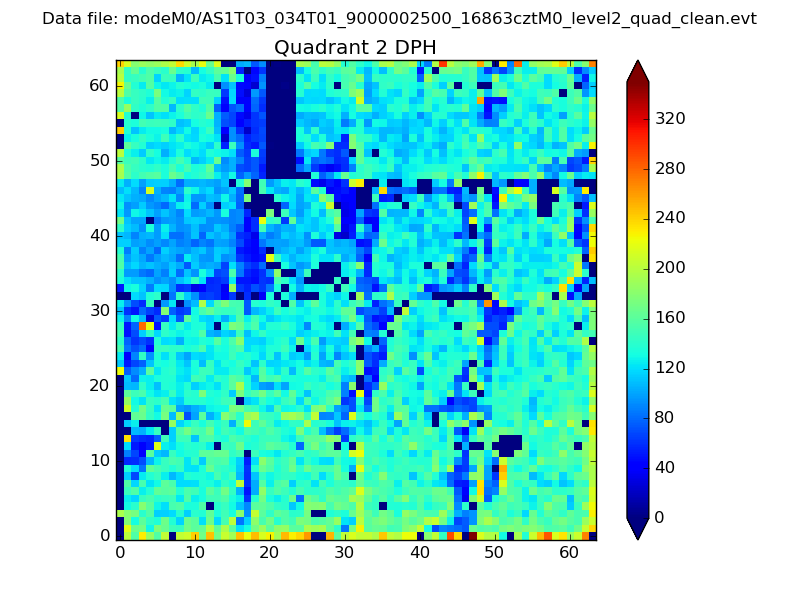 |
Quadrant C |
| Plot type | Count rate plots | Images |
|---|---|---|
| Comparison with Poisson distribution Blue bars denote a histogram of data divided into 1 sec bins. Red curve is a Poisson curve with rate = median count rate of data. |
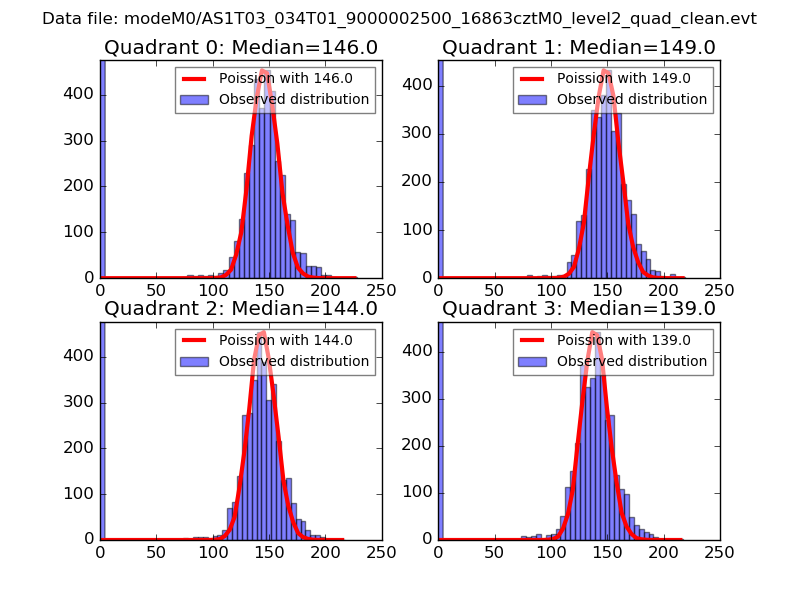 |
 |
| Quadrant-wise count rates Data is divided into 100 sec bins |
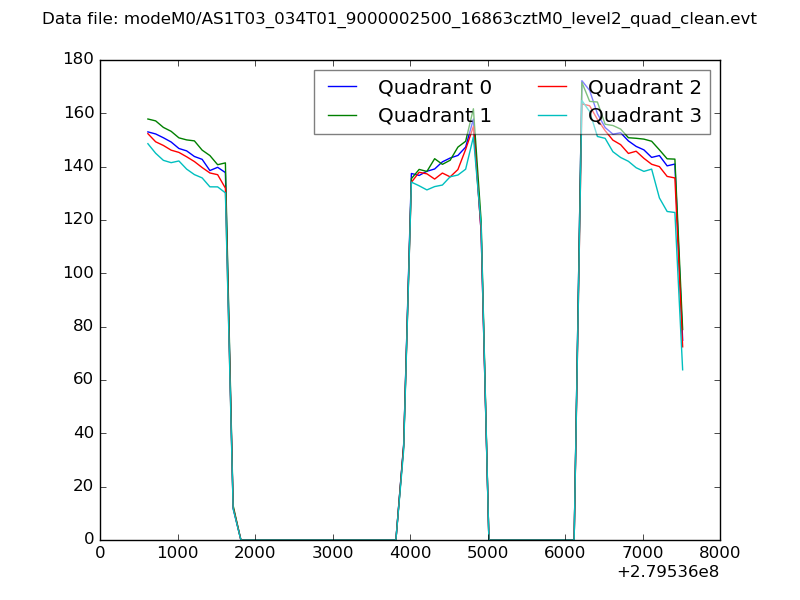 |
|
| Module-wise count rates for Quadrant A Data is divided into 100 sec bins |
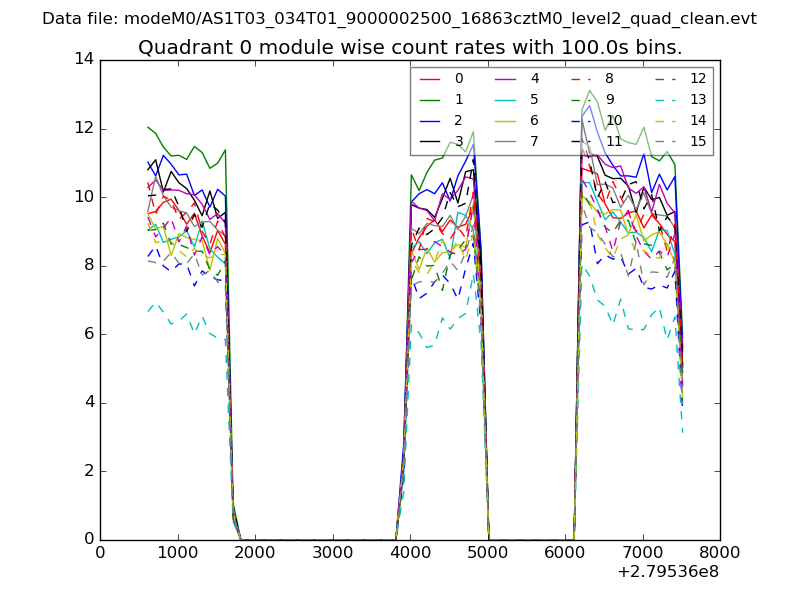 |
 |
| Module-wise count rates for Quadrant B Data is divided into 100 sec bins |
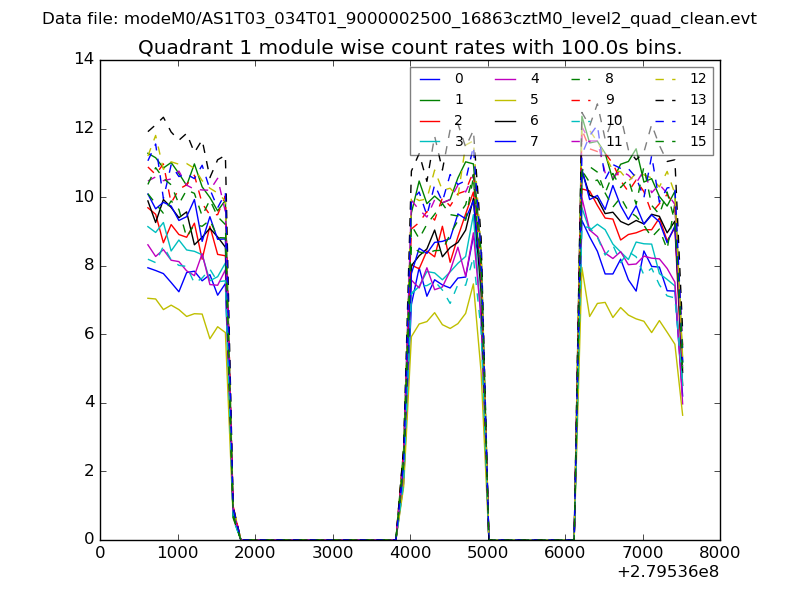 |
 |
| Module-wise count rates for Quadrant C Data is divided into 100 sec bins |
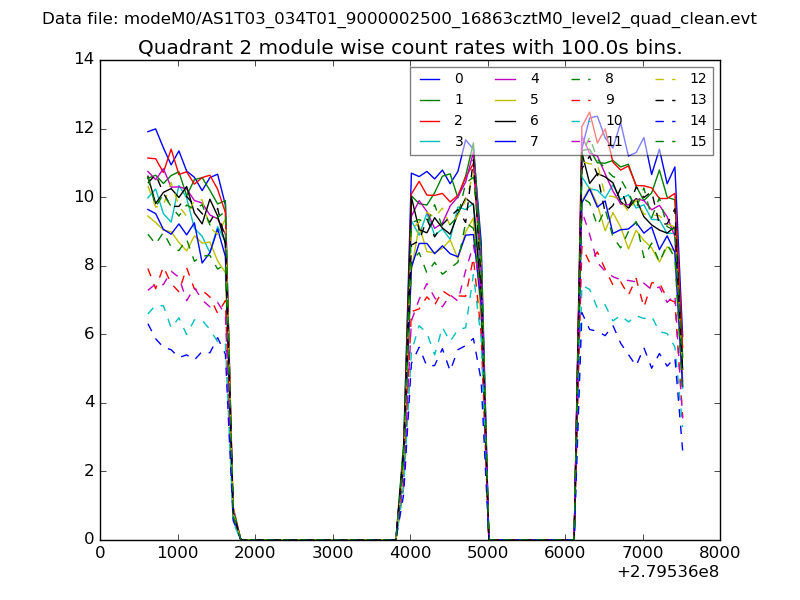 |
 |
| Module-wise count rates for Quadrant D Data is divided into 100 sec bins |
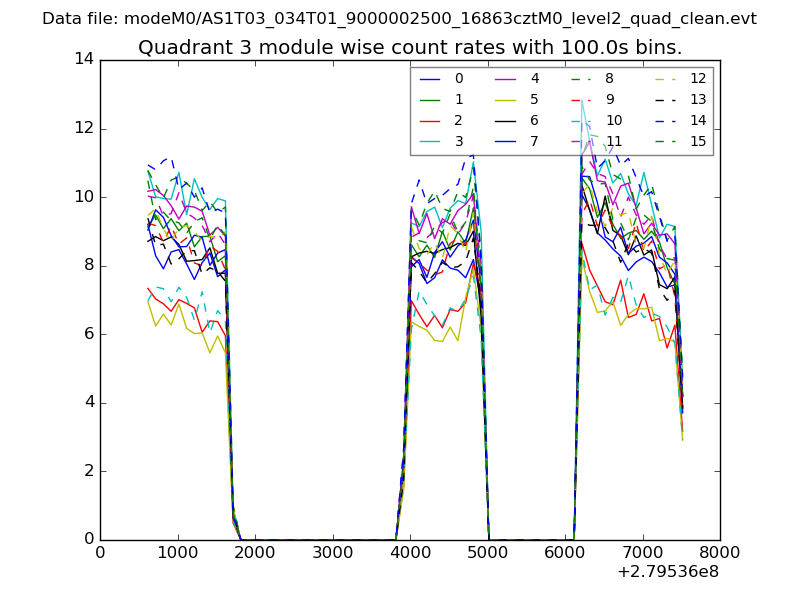 |
 |
| Parameter | Plot |
|---|---|
| CZT HV Monitor | 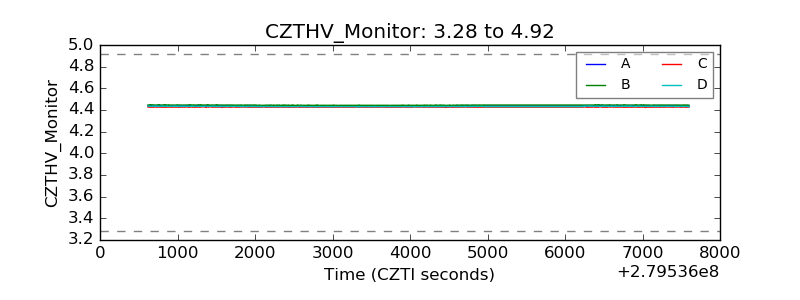 |
| D_VDD | 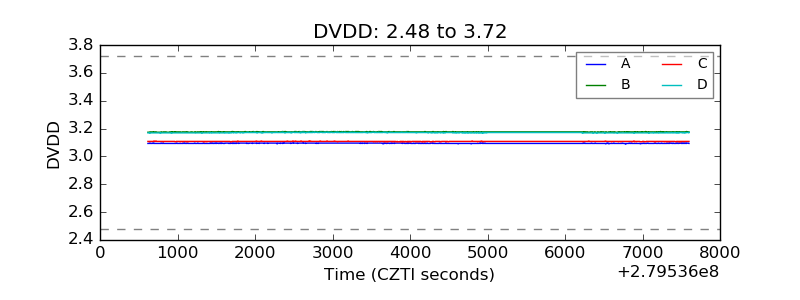 |
| Temperature 1 | 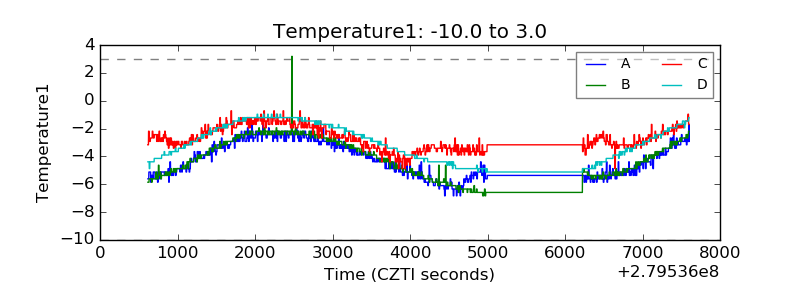 |
| Veto HV Monitor | 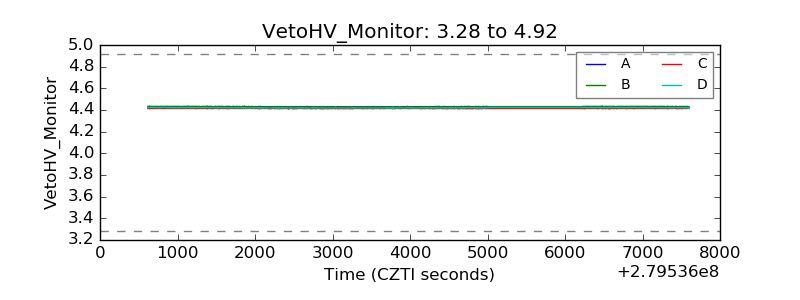 |
| Veto LLD | 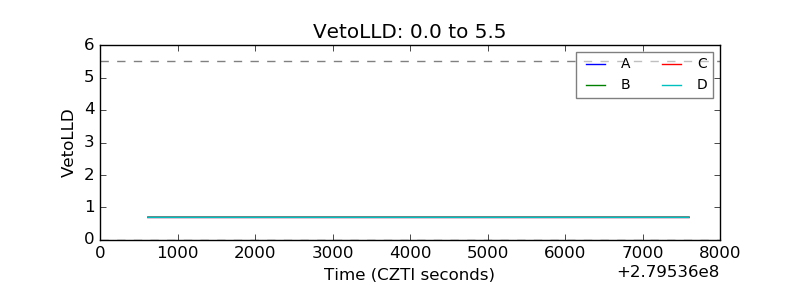 |
| Alpha Counter | 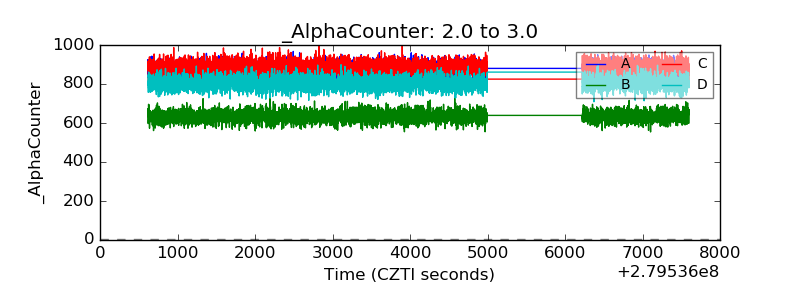 |
| _CPM_Rate | 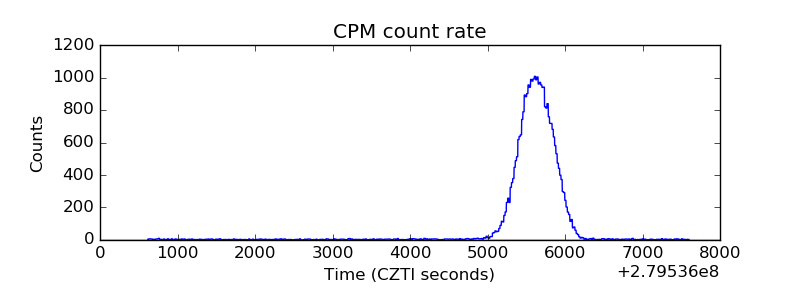 |
| CZT Counter | 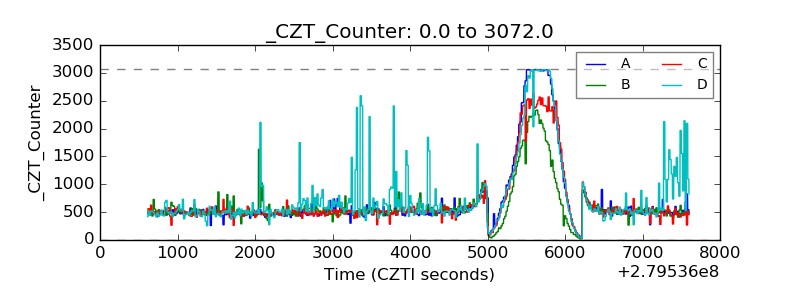 |
| +2.5 Volts monitor |  |
| +5 Volts monitor |  |
| _ROLL_ROT | 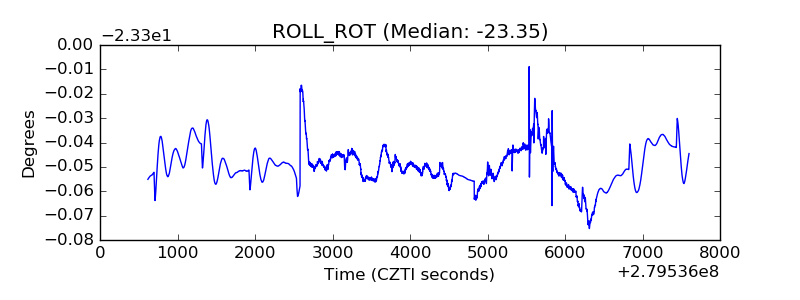 |
| _Roll_DEC | 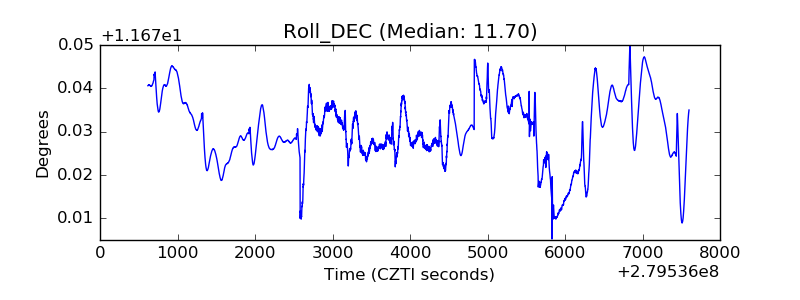 |
| _Roll_RA | 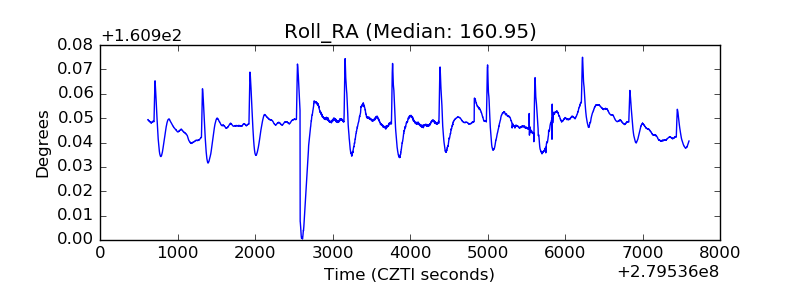 |
| Veto Counter | 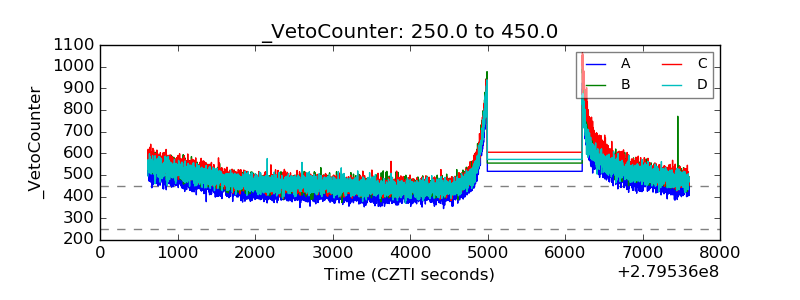 |