| Param | Original file | Final file |
|---|---|---|
| Filename | modeM0/AS1T03_034T01_9000002500_16864cztM0_level2.evt | modeM0/AS1T03_034T01_9000002500_16864cztM0_level2_quad_clean.evt |
| Size (bytes) | 585,069,120 | 83,891,520 |
| Size | 558.0 MB | 80.0 MB |
| Events in quadrant A | 3,444,319 | 539,332 |
| Events in quadrant B | 3,598,825 | 547,541 |
| Events in quadrant C | 3,246,706 | 530,443 |
| Events in quadrant D | 6,994,226 | 475,455 |
| Mode M9 | |||
|---|---|---|---|
| Quadrant | BADHDUFLAG | Total packets | Discarded packets |
| A | 0 | 11 | 0 |
| B | 0 | 11 | 0 |
| C | 0 | 11 | 0 |
| D | 0 | 12 | 0 |
| Mode M0 | |||
|---|---|---|---|
| Quadrant | BADHDUFLAG | Total packets | Discarded packets |
| A | 0 | 14003 | 3 |
| B | 0 | 14407 | 2 |
| C | 0 | 13286 | 2 |
| D | 0 | 25208 | 2 |
| Mode SS | |||
|---|---|---|---|
| Quadrant | BADHDUFLAG | Total packets | Discarded packets |
| A | 0 | 132 | 0 |
| B | 0 | 132 | 0 |
| C | 0 | 132 | 0 |
| D | 0 | 132 | 0 |
| Quadrant | Total seconds | Saturated seconds | Saturation percentage |
|---|---|---|---|
| A | 6406 | 109 | 1.701530% |
| B | 6406 | 78 | 1.217608% |
| C | 6406 | 85 | 1.326881% |
| D | 6406 | 1596 | 24.914143% |
Noise dominated data is calculated using 1-second bins in cleaned event files. If a bin has >2000 counts, and if more than 50% of those come from <1% of pixels, then it is considered to be noise-dominated and hence unusable.
| Quadrant | # 1 sec bins | Bins with >0 counts | Bins with >2000 counts | High rate bins dominated by noise | Noise dominated (total time) | Noise dominated (detector-on time) | Marked lightcurve |
|---|---|---|---|---|---|---|---|
| A | 7577 | 6408 | 19 | 19 | 0.25% | 0.30% | 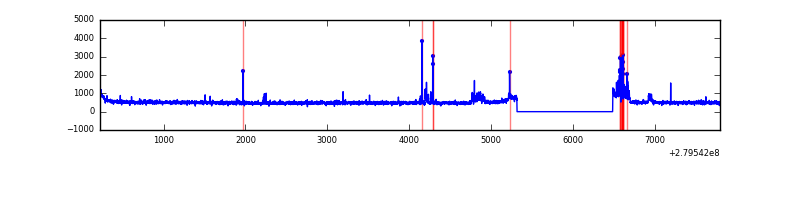 |
| B | 7577 | 6408 | 3 | 3 | 0.04% | 0.05% | 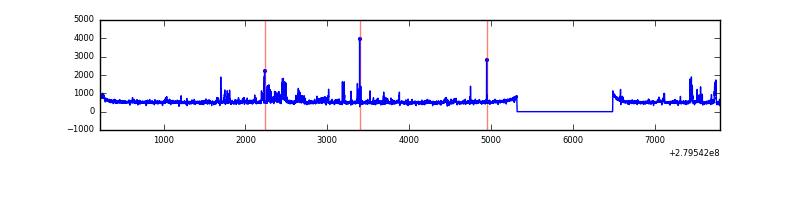 |
| C | 7577 | 6408 | 2 | 2 | 0.03% | 0.03% |  |
| D | 7577 | 6408 | 481 | 481 | 6.35% | 7.51% | 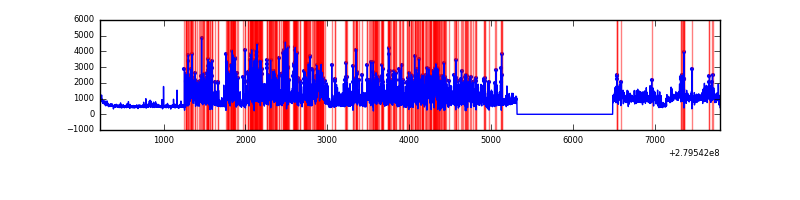 |
Top three noisy pixels from each quadrant. If the there are fewer than three noisy pixels in the level2.evt file, extra rows are filled as -1
| Pixel properties | Quadrant properties | ||||||
|---|---|---|---|---|---|---|---|
| Quadrant | DetID | PixID | Counts | Sigma | Mean | Median | Sigma |
| A | 0 | 23 | 186955 | 1106.12 | 831 | 813 | 168.3 |
| A | 9 | 143 | 30971 | 179.21 | 831 | 813 | 168.3 |
| A | 0 | 226 | 18507 | 105.14 | 831 | 813 | 168.3 |
| B | 15 | 35 | 208572 | 1341.51 | 821 | 802 | 154.9 |
| B | 4 | 216 | 51496 | 327.32 | 821 | 802 | 154.9 |
| B | 0 | 189 | 37621 | 237.73 | 821 | 802 | 154.9 |
| C | 14 | 238 | 124885 | 665.65 | 798 | 805 | 186.4 |
| C | 0 | 207 | 9507 | 46.68 | 798 | 805 | 186.4 |
| C | 13 | 61 | 5622 | 25.84 | 798 | 805 | 186.4 |
| D | 1 | 52 | 4029557 | 21927.43 | 751 | 730 | 183.7 |
| D | 10 | 70 | 83978 | 453.09 | 751 | 730 | 183.7 |
| D | 2 | 234 | 25966 | 137.35 | 751 | 730 | 183.7 |
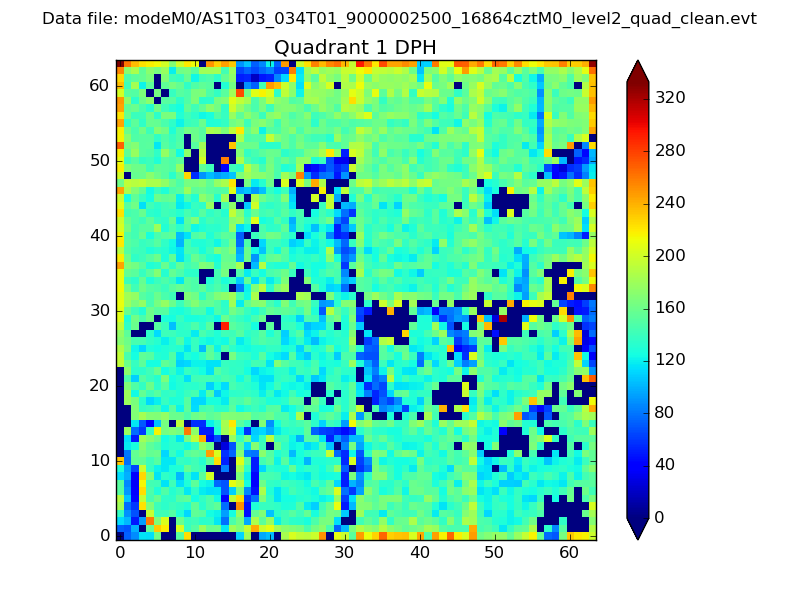
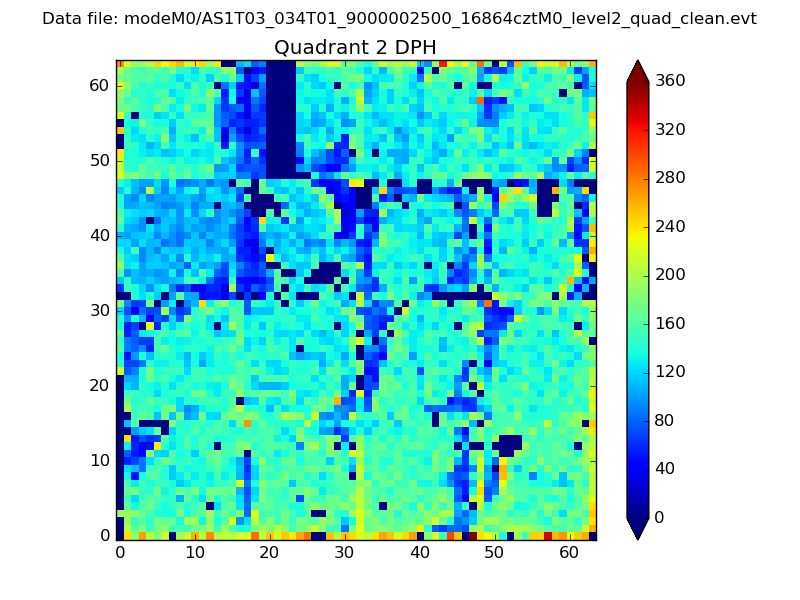
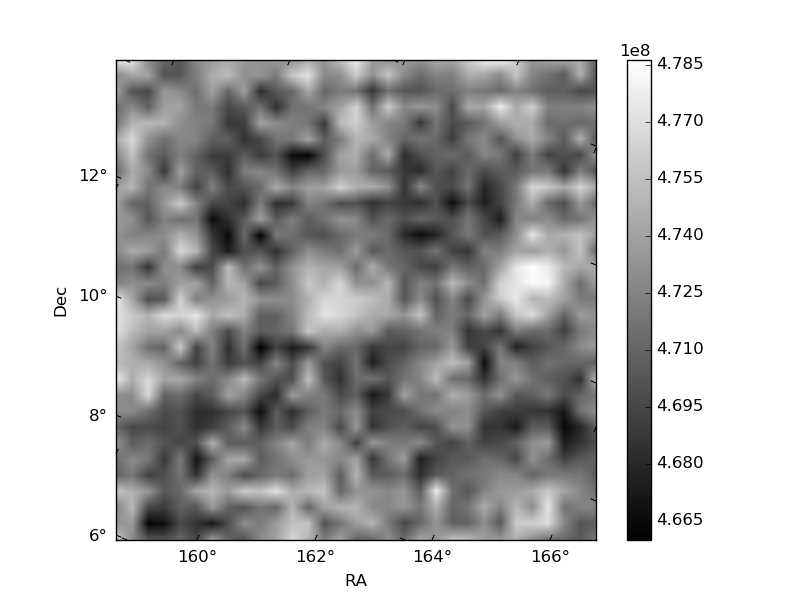
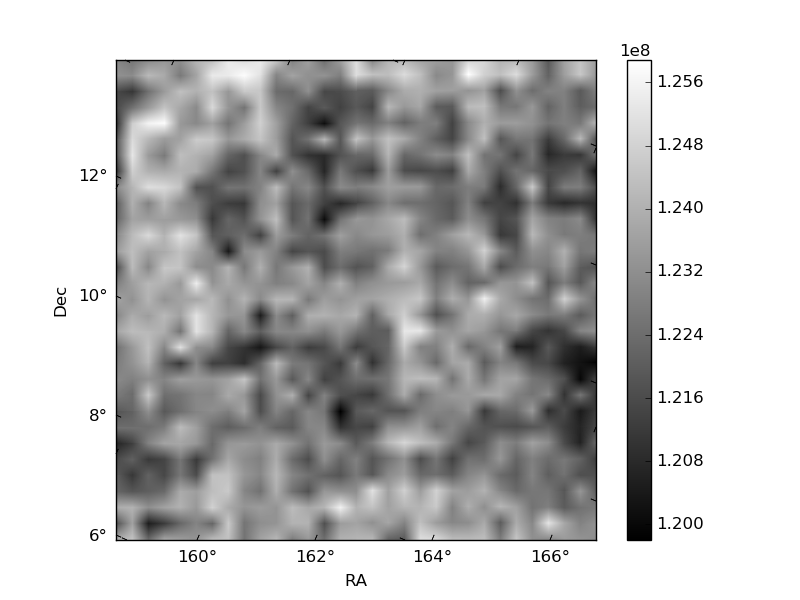
Histogram calculated using DETX and DETY for each event in the final _common_clean file
| Quadrant A | 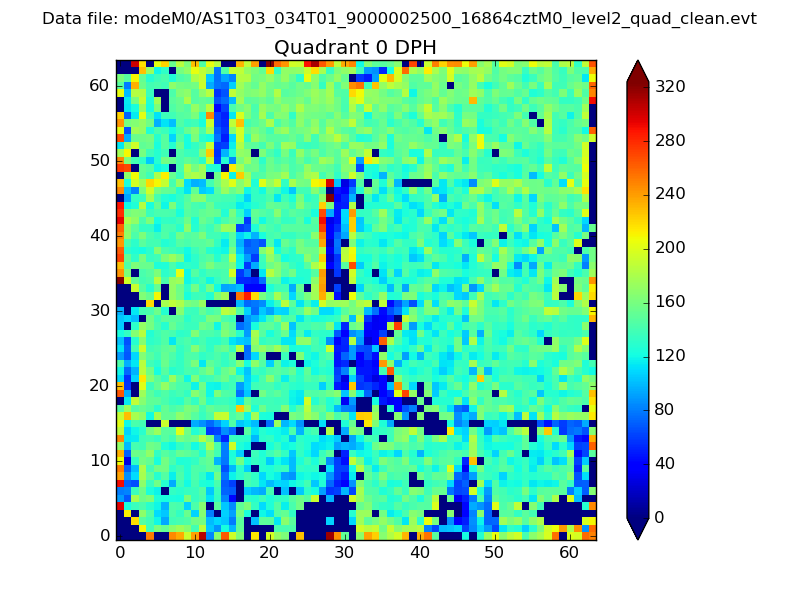 |
 |
Quadrant B |
|---|---|---|---|
| Quadrant D | 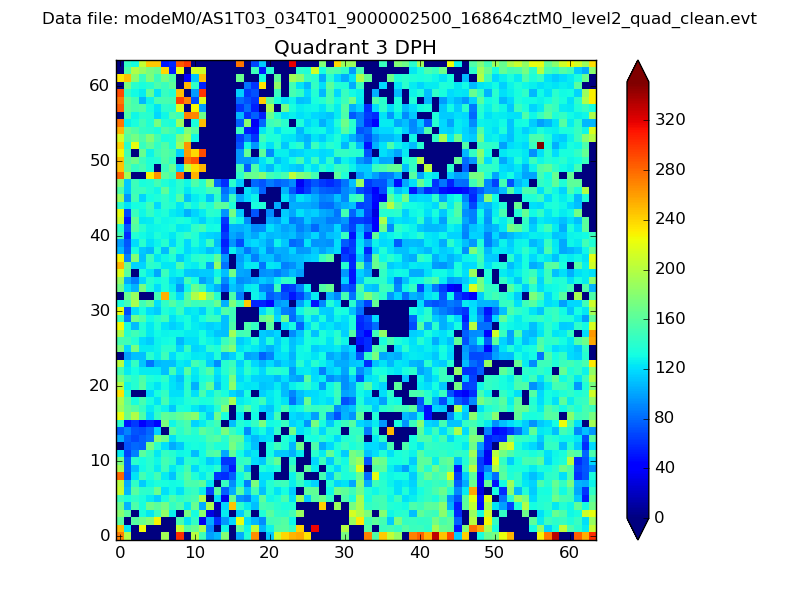 |
 |
Quadrant C |
| Plot type | Count rate plots | Images |
|---|---|---|
| Comparison with Poisson distribution Blue bars denote a histogram of data divided into 1 sec bins. Red curve is a Poisson curve with rate = median count rate of data. |
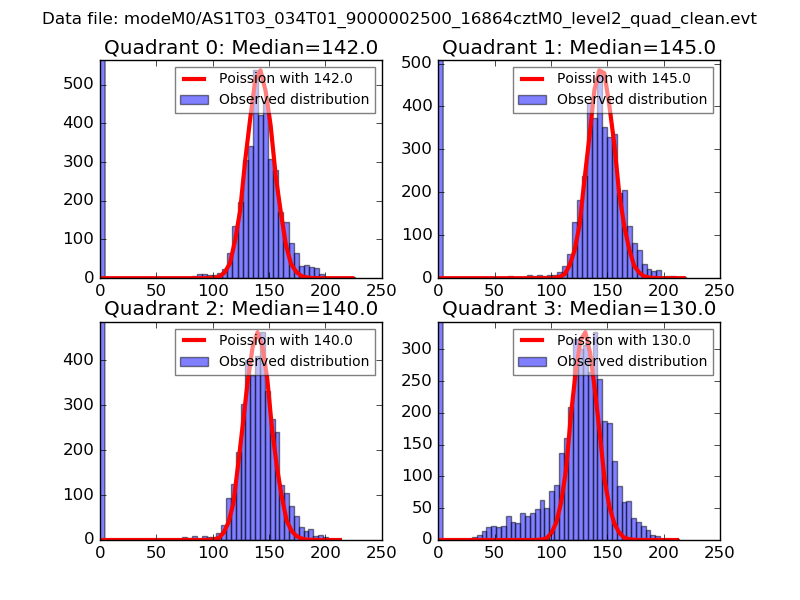 |
 |
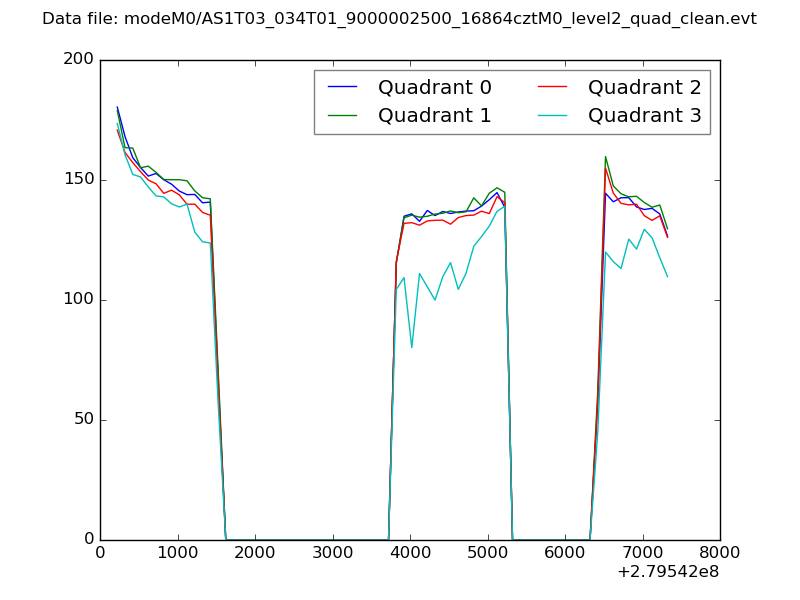
| Quadrant-wise count rates Data is divided into 100 sec bins |
 |
|
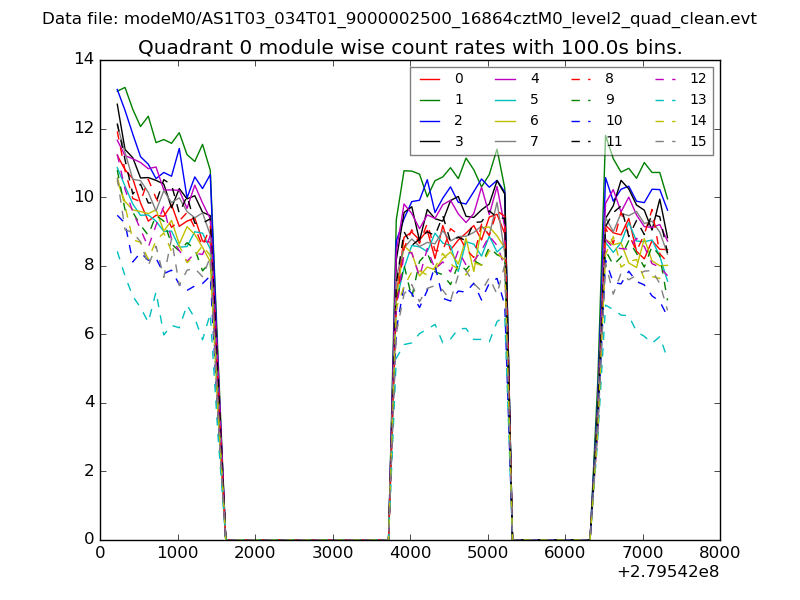
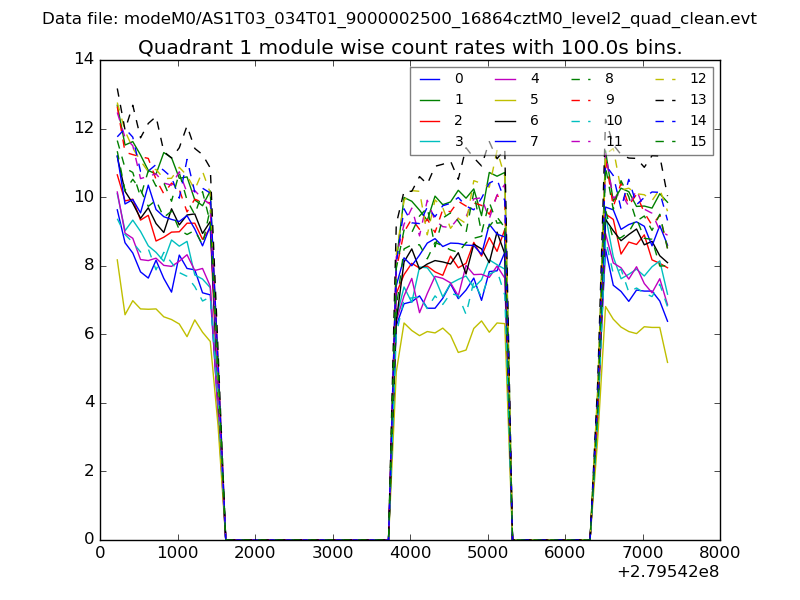
| Module-wise count rates for Quadrant A Data is divided into 100 sec bins |
 |
 |
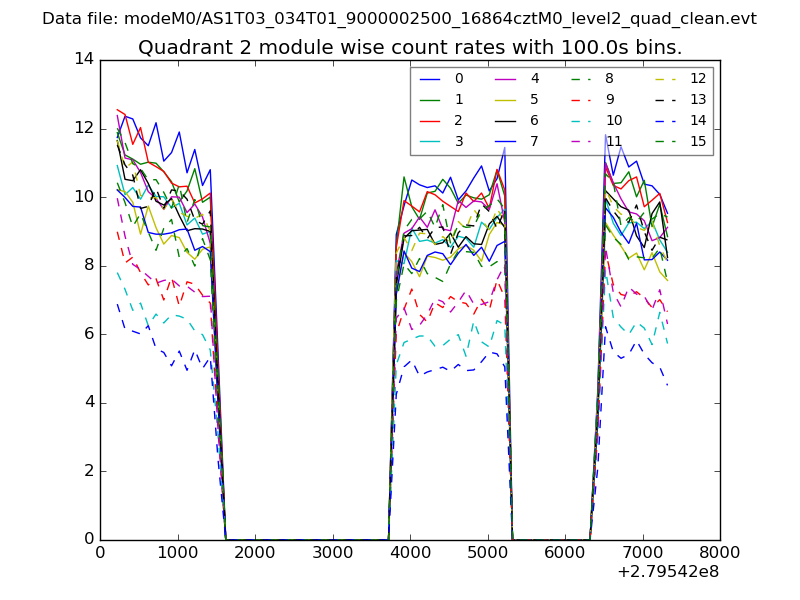
| Module-wise count rates for Quadrant B Data is divided into 100 sec bins |
 |
 |
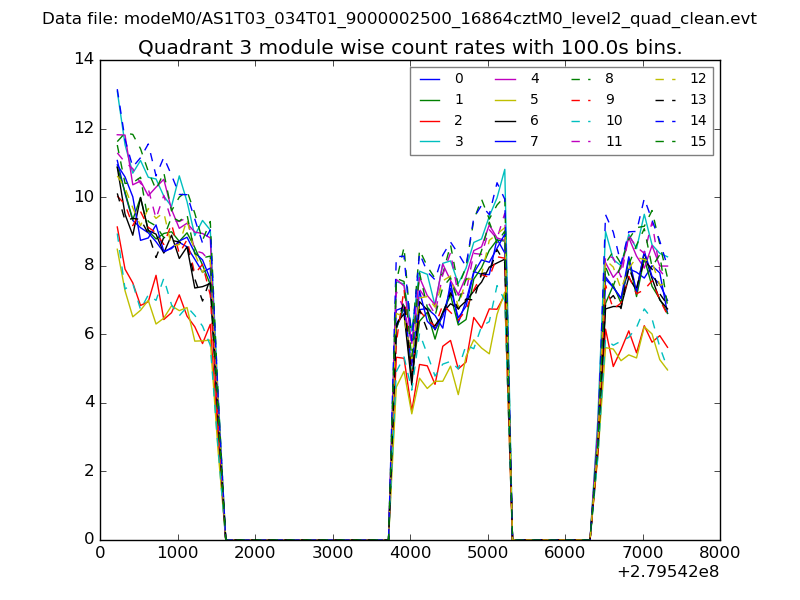
| Module-wise count rates for Quadrant C Data is divided into 100 sec bins |
 |
 |
| Module-wise count rates for Quadrant D Data is divided into 100 sec bins |
 |
 |
| Parameter | Plot |
|---|---|
| CZT HV Monitor | 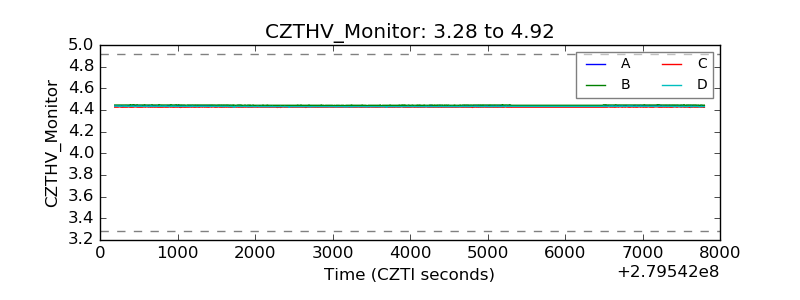 |
| D_VDD | 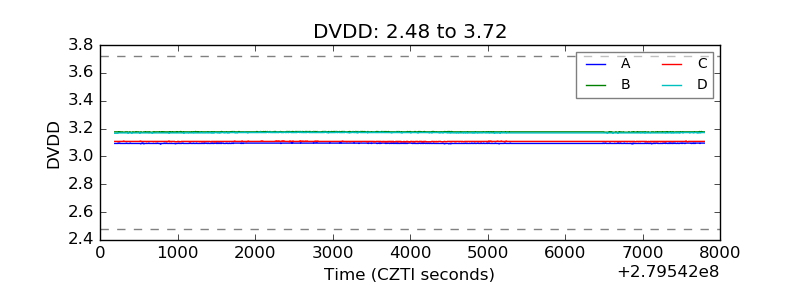 |
| Temperature 1 |  |
| Veto HV Monitor | 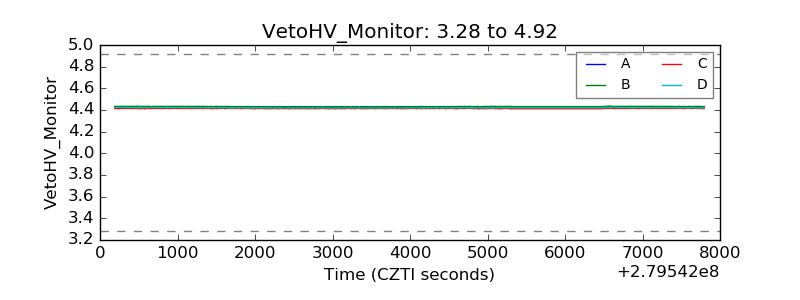 |
| Veto LLD | 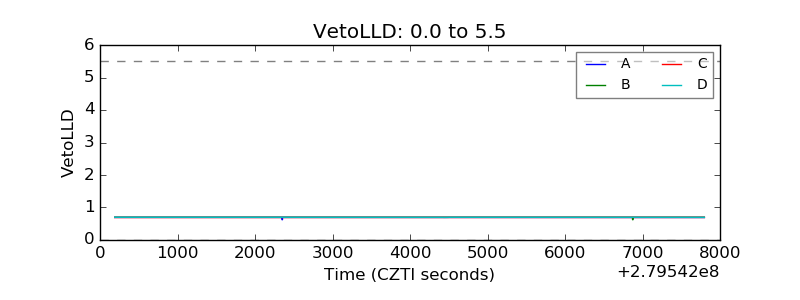 |
| Alpha Counter | 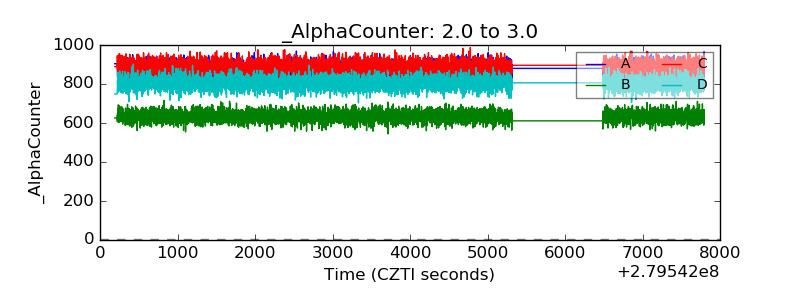 |
| _CPM_Rate | 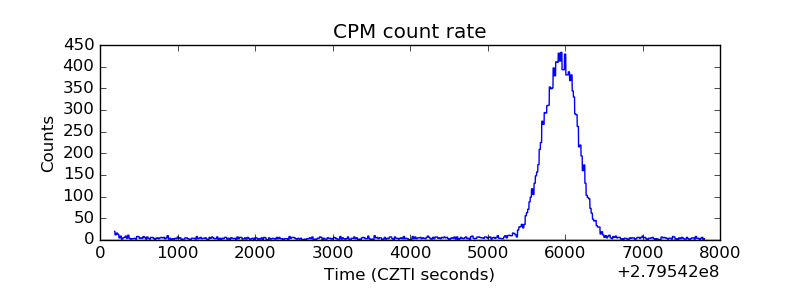 |
| CZT Counter | 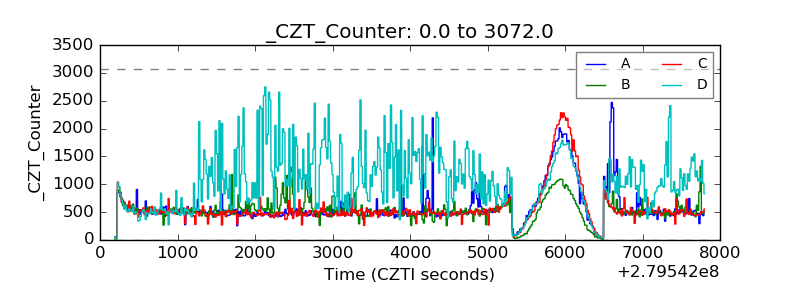 |
| +2.5 Volts monitor | 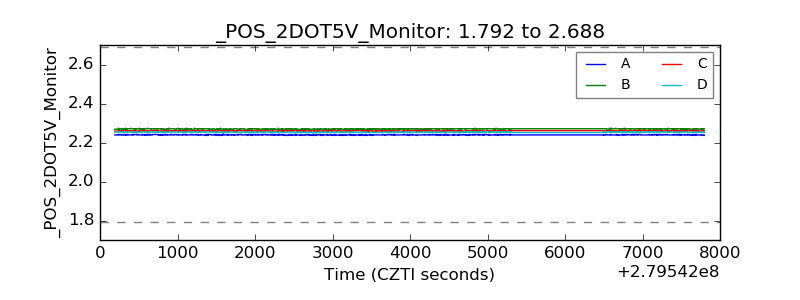 |
| +5 Volts monitor |  |
| _ROLL_ROT | 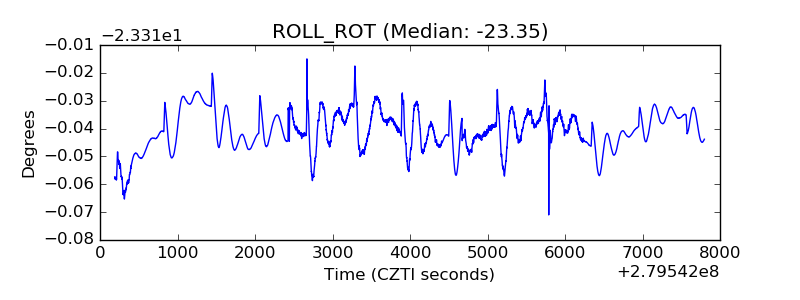 |
| _Roll_DEC | 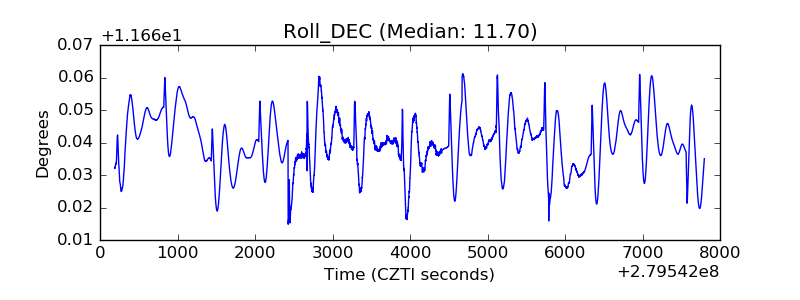 |
| _Roll_RA | 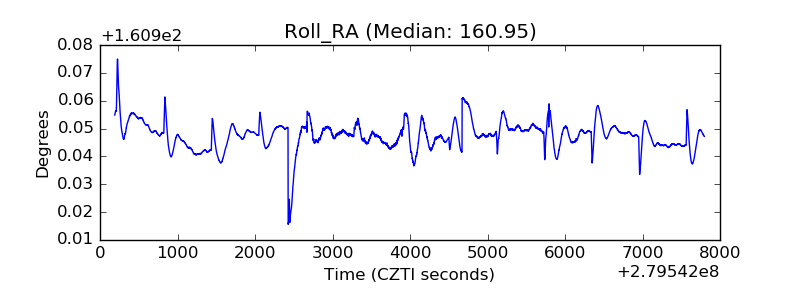 |
| Veto Counter | 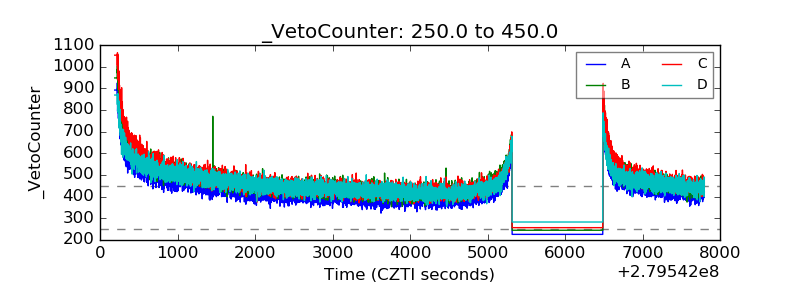 |