| Param | Original file | Final file |
|---|---|---|
| Filename | modeM0/AS1T03_034T01_9000002500_16866cztM0_level2.evt | modeM0/AS1T03_034T01_9000002500_16866cztM0_level2_quad_clean.evt |
| Size (bytes) | 650,393,280 | 67,979,520 |
| Size | 620.3 MB | 64.8 MB |
| Events in quadrant A | 3,377,467 | 414,687 |
| Events in quadrant B | 3,447,589 | 418,972 |
| Events in quadrant C | 3,238,799 | 407,773 |
| Events in quadrant D | 9,178,774 | 348,471 |
| Mode M9 | |||
|---|---|---|---|
| Quadrant | BADHDUFLAG | Total packets | Discarded packets |
| A | 0 | 5 | 0 |
| B | 0 | 5 | 0 |
| C | 0 | 5 | 0 |
| D | 0 | 5 | 0 |
| Mode M0 | |||
|---|---|---|---|
| Quadrant | BADHDUFLAG | Total packets | Discarded packets |
| A | 0 | 14383 | 2 |
| B | 0 | 14322 | 1 |
| C | 0 | 13822 | 1 |
| D | 0 | 31991 | 1 |
| Mode SS | |||
|---|---|---|---|
| Quadrant | BADHDUFLAG | Total packets | Discarded packets |
| A | 0 | 136 | 0 |
| B | 0 | 136 | 0 |
| C | 0 | 136 | 0 |
| D | 0 | 136 | 0 |
| Quadrant | Total seconds | Saturated seconds | Saturation percentage |
|---|---|---|---|
| A | 6715 | 97 | 1.444527% |
| B | 6715 | 106 | 1.578555% |
| C | 6715 | 123 | 1.831720% |
| D | 6715 | 1837 | 27.356664% |
Noise dominated data is calculated using 1-second bins in cleaned event files. If a bin has >2000 counts, and if more than 50% of those come from <1% of pixels, then it is considered to be noise-dominated and hence unusable.
| Quadrant | # 1 sec bins | Bins with >0 counts | Bins with >2000 counts | High rate bins dominated by noise | Noise dominated (total time) | Noise dominated (detector-on time) | Marked lightcurve |
|---|---|---|---|---|---|---|---|
| A | 7221 | 6717 | 5 | 5 | 0.07% | 0.07% | 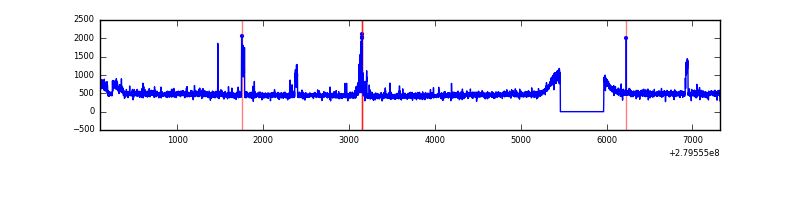 |
| B | 7221 | 6717 | 0 | 0 | 0.00% | 0.00% | 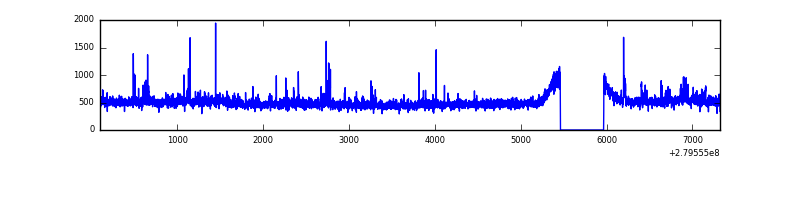 |
| C | 7221 | 6717 | 1 | 1 | 0.01% | 0.01% | 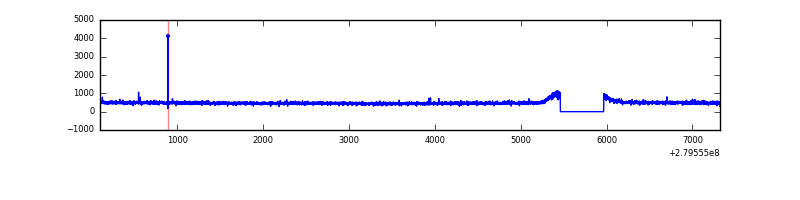 |
| D | 7221 | 6717 | 1306 | 1306 | 18.09% | 19.44% | 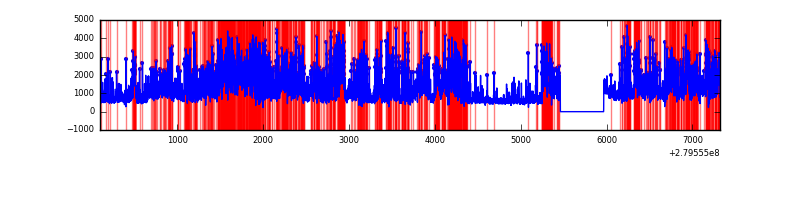 |
Top three noisy pixels from each quadrant. If the there are fewer than three noisy pixels in the level2.evt file, extra rows are filled as -1
| Pixel properties | Quadrant properties | ||||||
|---|---|---|---|---|---|---|---|
| Quadrant | DetID | PixID | Counts | Sigma | Mean | Median | Sigma |
| A | 0 | 23 | 125476 | 738.85 | 829 | 811 | 168.7 |
| A | 15 | 174 | 54399 | 317.6 | 829 | 811 | 168.7 |
| A | 0 | 226 | 14835 | 83.11 | 829 | 811 | 168.7 |
| B | 15 | 35 | 61032 | 376.22 | 825 | 803 | 160.1 |
| B | 0 | 229 | 56965 | 350.82 | 825 | 803 | 160.1 |
| B | 4 | 216 | 31399 | 191.12 | 825 | 803 | 160.1 |
| C | 14 | 238 | 120998 | 635.72 | 798 | 805 | 189.1 |
| C | 13 | 61 | 5612 | 25.42 | 798 | 805 | 189.1 |
| C | 7 | 247 | 5375 | 24.17 | 798 | 805 | 189.1 |
| D | 1 | 52 | 6275964 | 35430.54 | 721 | 698 | 177.1 |
| D | 10 | 70 | 113180 | 635.08 | 721 | 698 | 177.1 |
| D | 2 | 234 | 29535 | 162.82 | 721 | 698 | 177.1 |
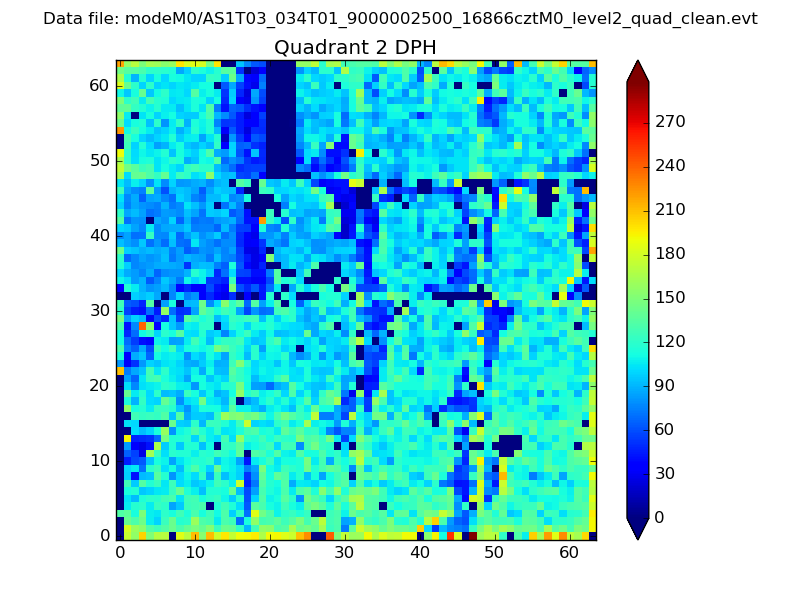
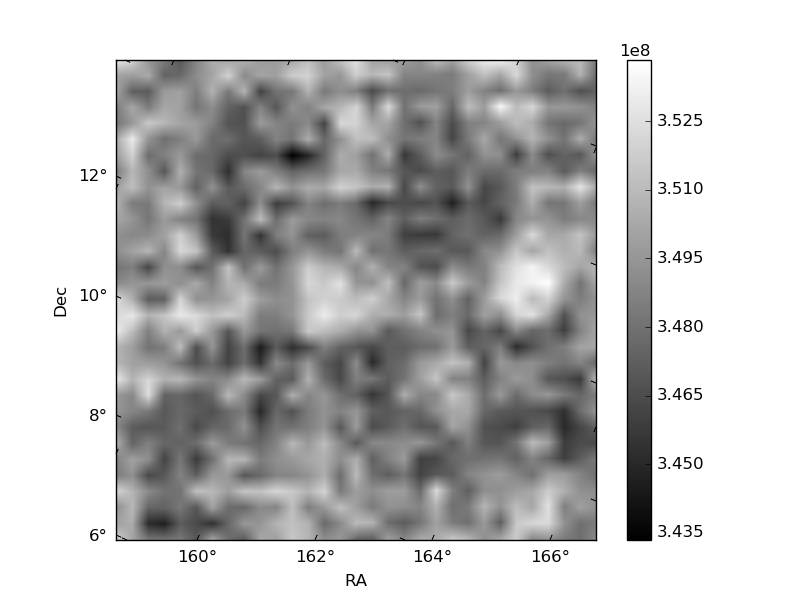
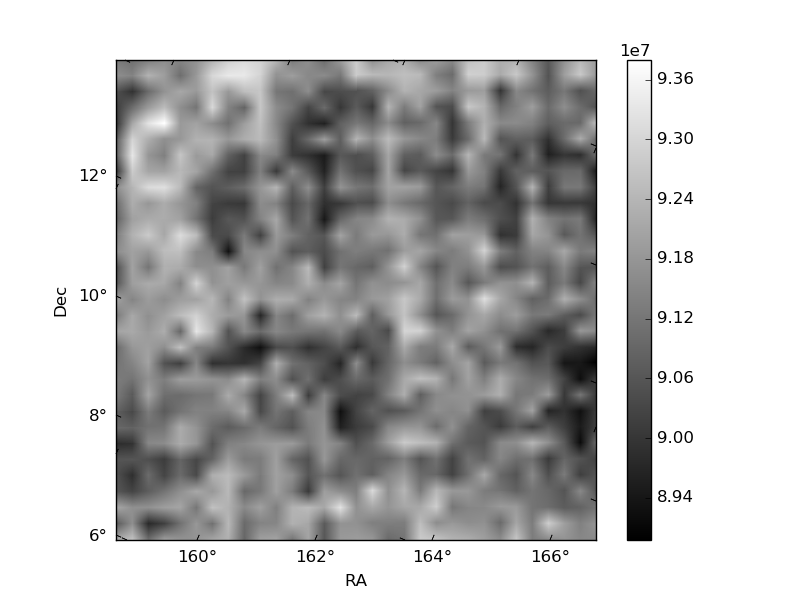
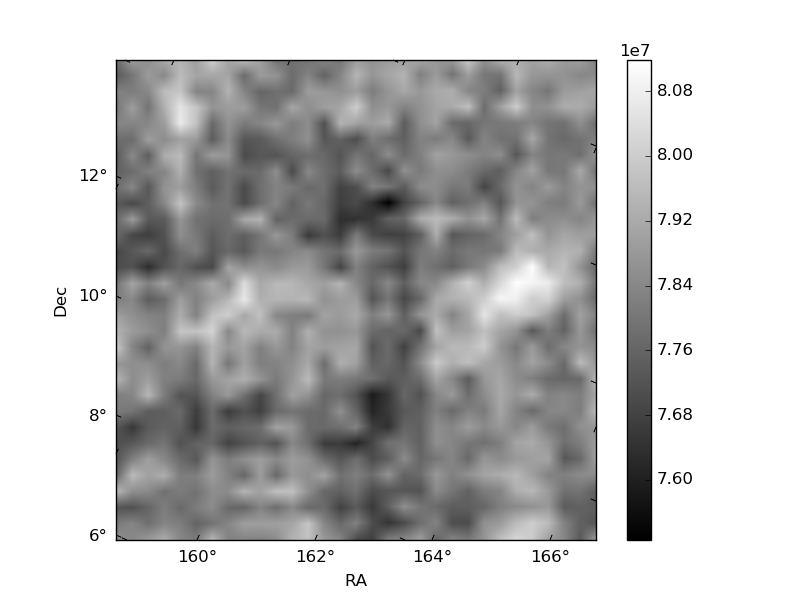
Histogram calculated using DETX and DETY for each event in the final _common_clean file
| Quadrant A | 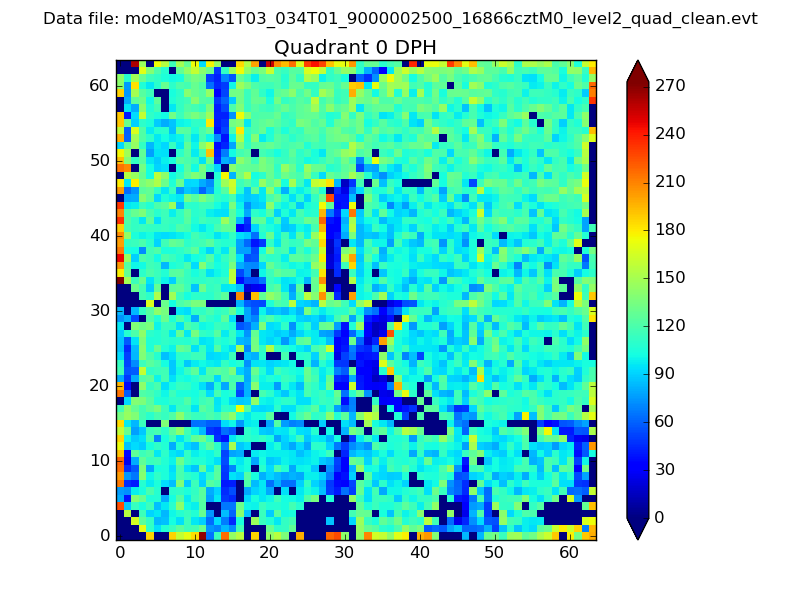 |
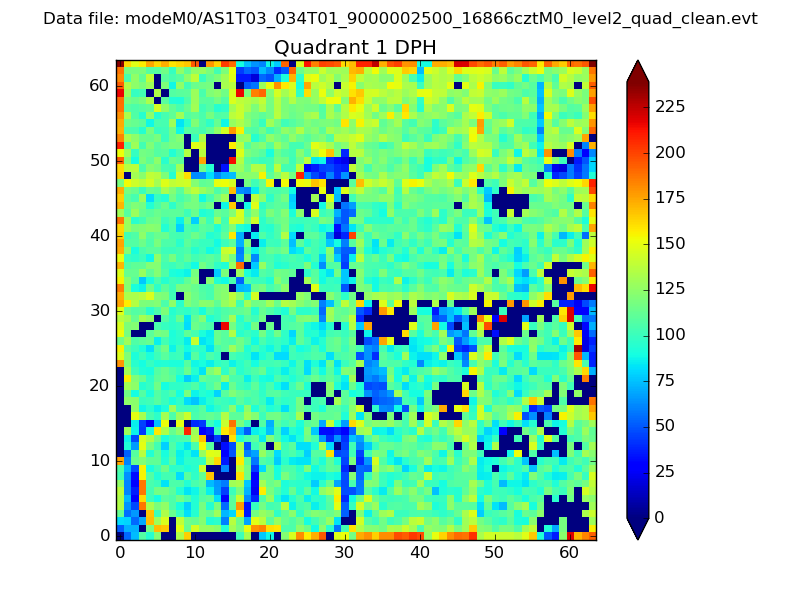 |
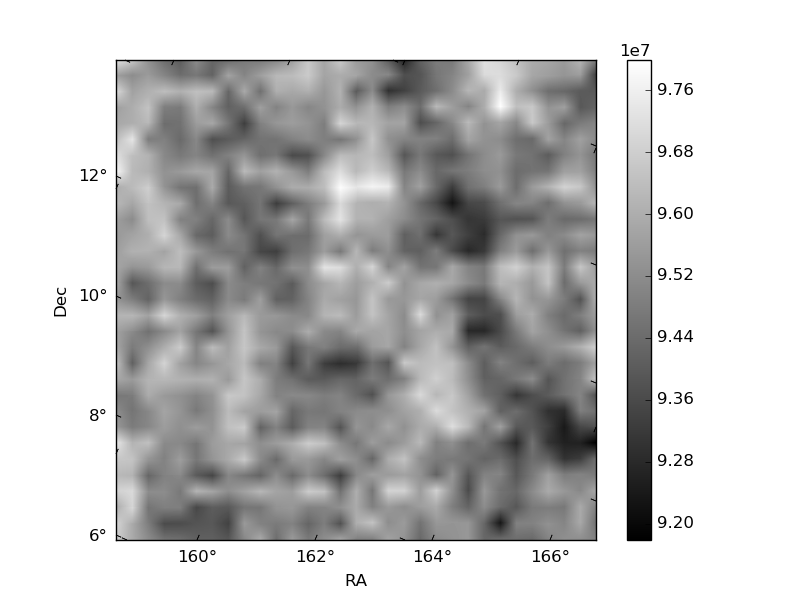
Quadrant B |
|---|---|---|---|
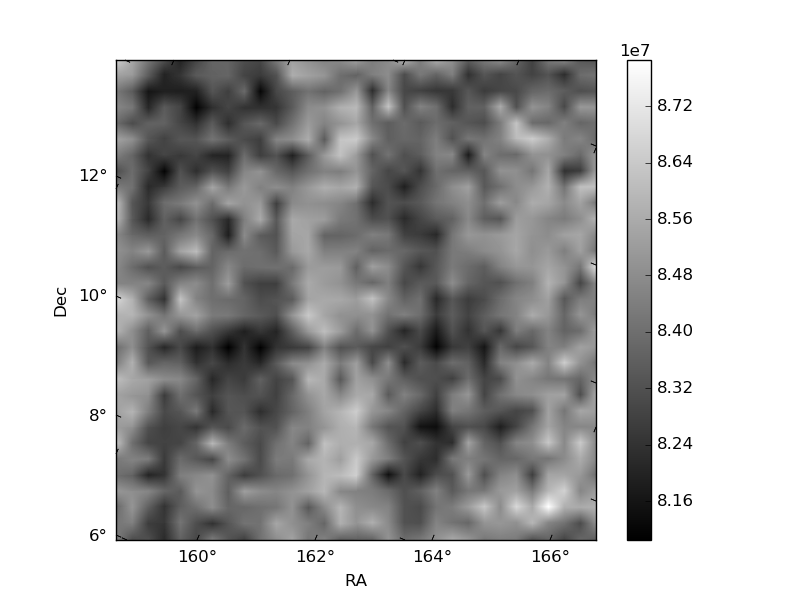
| Quadrant D | 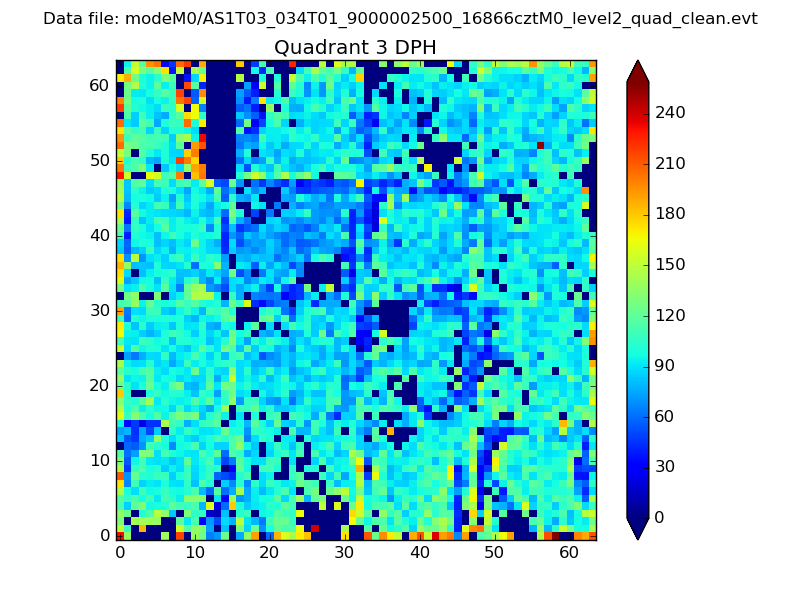 |
 |
Quadrant C |
| Plot type | Count rate plots | Images |
|---|---|---|
| Comparison with Poisson distribution Blue bars denote a histogram of data divided into 1 sec bins. Red curve is a Poisson curve with rate = median count rate of data. |
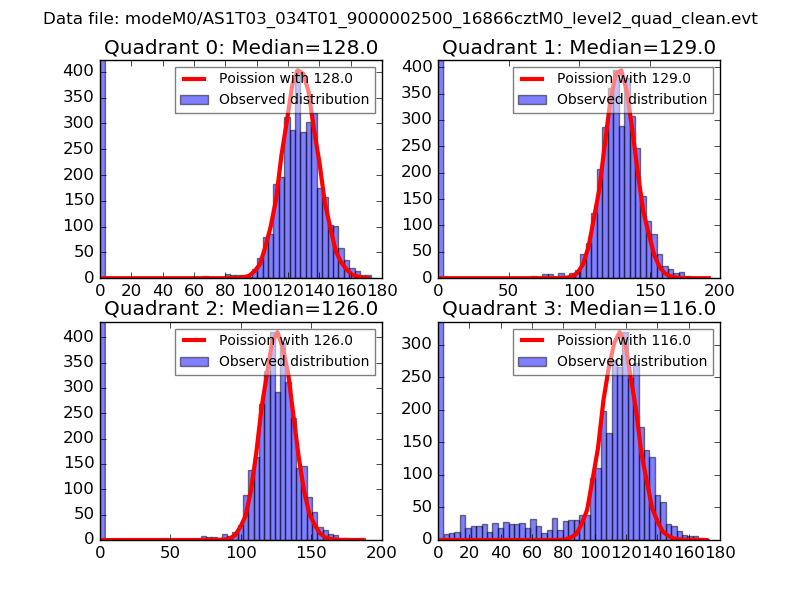 |
 |
| Quadrant-wise count rates Data is divided into 100 sec bins |
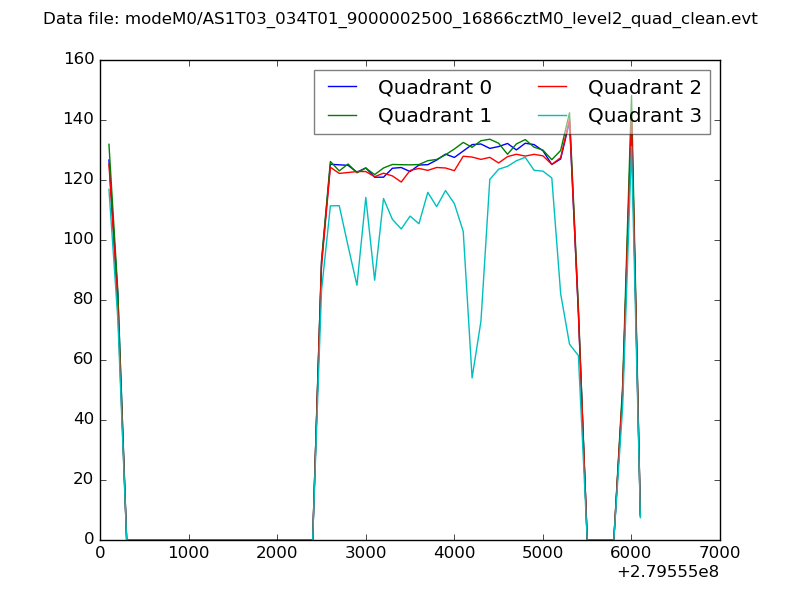 |
|
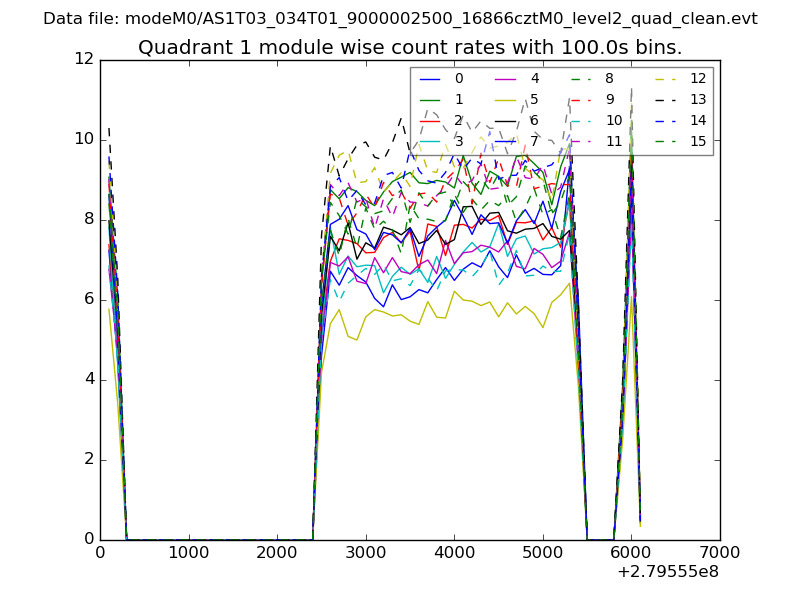
| Module-wise count rates for Quadrant A Data is divided into 100 sec bins |
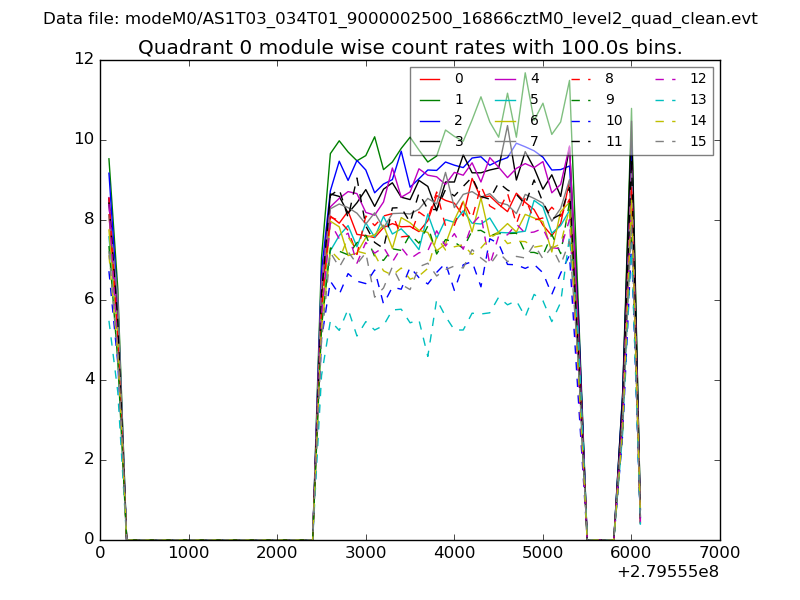 |
 |
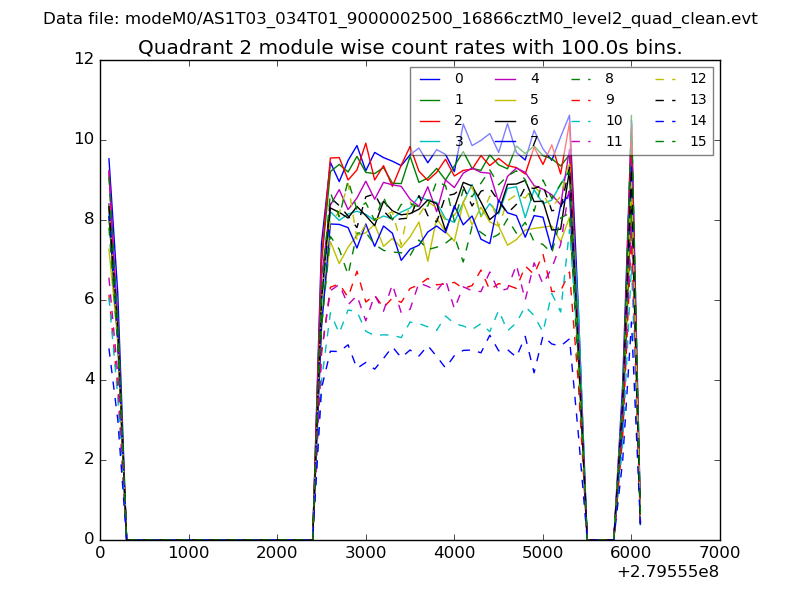
| Module-wise count rates for Quadrant B Data is divided into 100 sec bins |
 |
 |
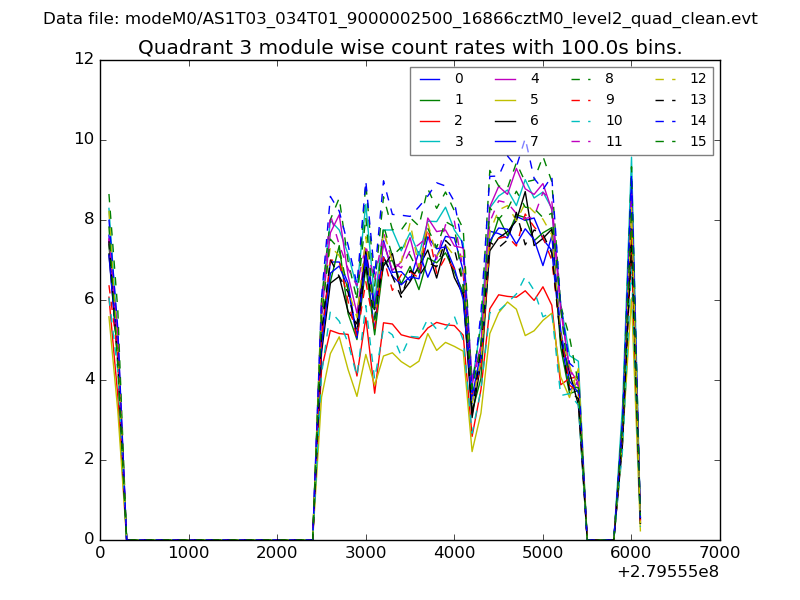
| Module-wise count rates for Quadrant C Data is divided into 100 sec bins |
 |
 |
| Module-wise count rates for Quadrant D Data is divided into 100 sec bins |
 |
 |
| Parameter | Plot |
|---|---|
| CZT HV Monitor | 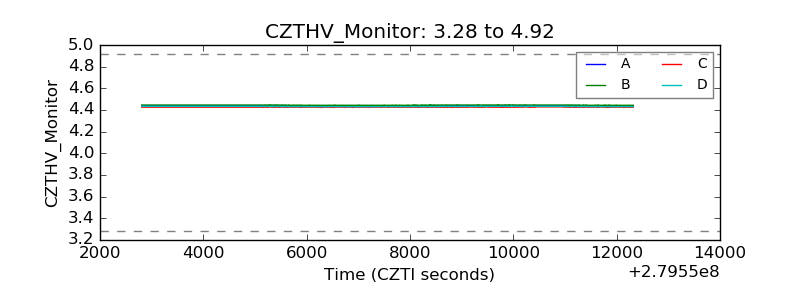 |
| D_VDD | 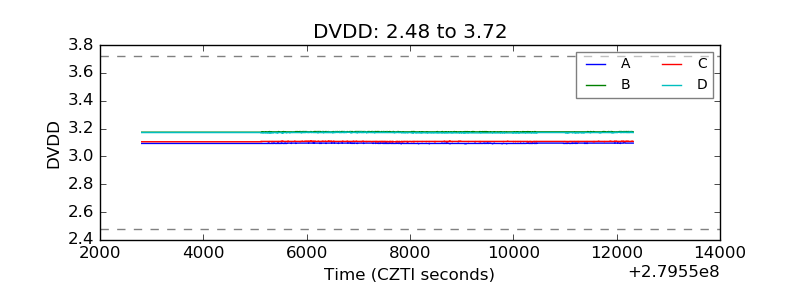 |
| Temperature 1 | 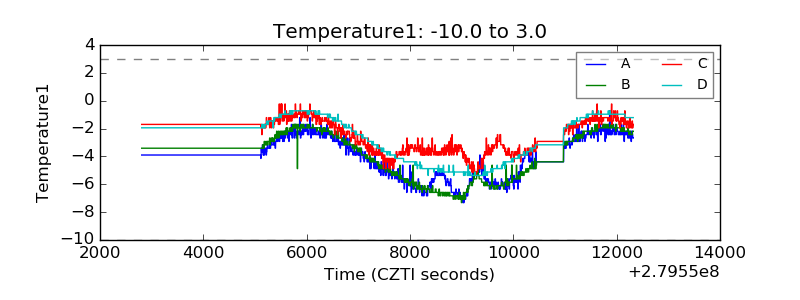 |
| Veto HV Monitor | 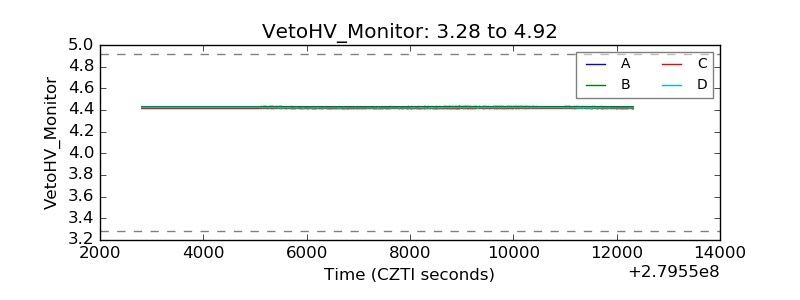 |
| Veto LLD | 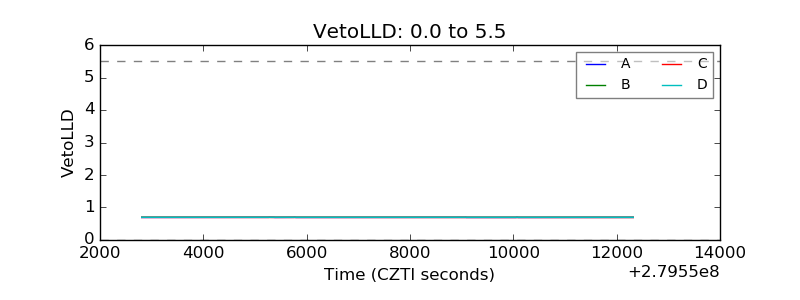 |
| Alpha Counter | 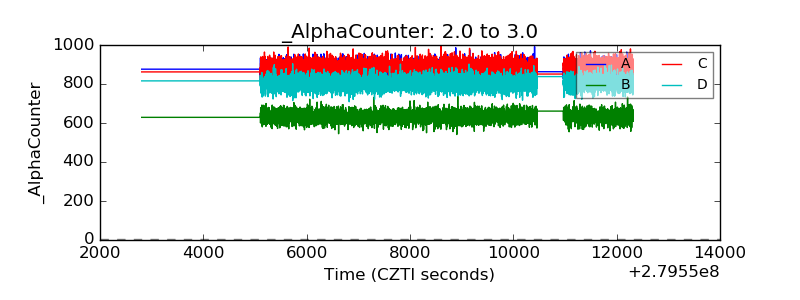 |
| _CPM_Rate | 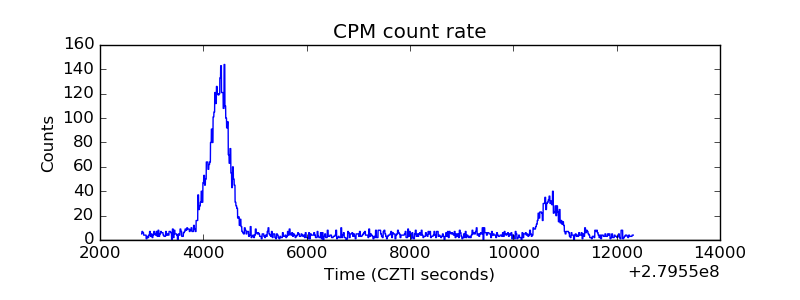 |
| CZT Counter | 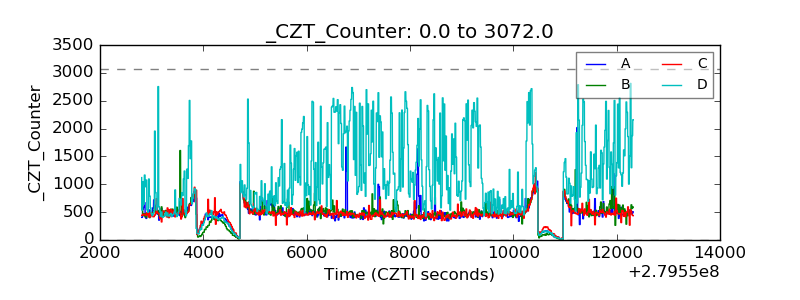 |
| +2.5 Volts monitor | 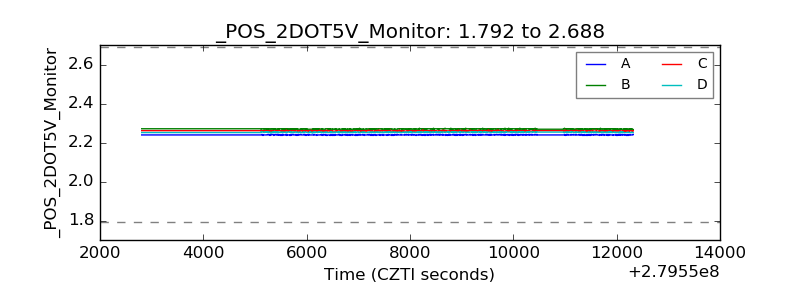 |
| +5 Volts monitor | 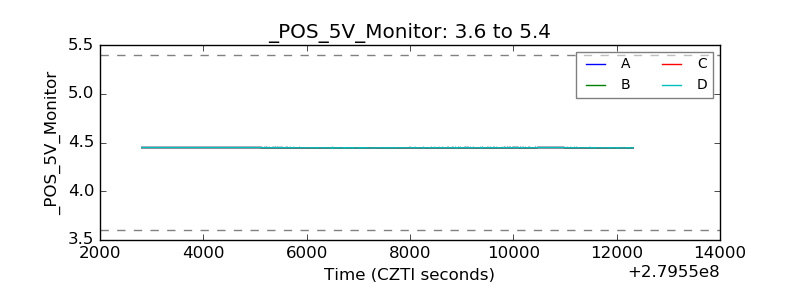 |
| _ROLL_ROT | 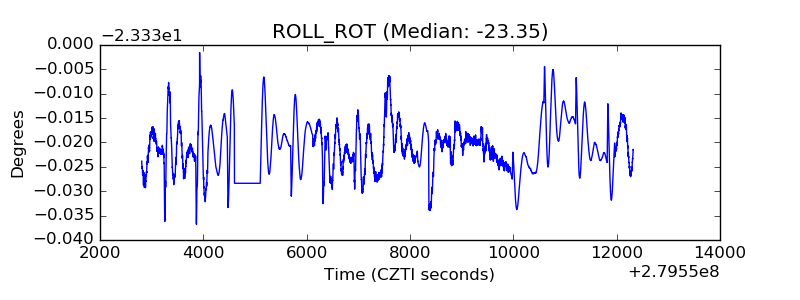 |
| _Roll_DEC | 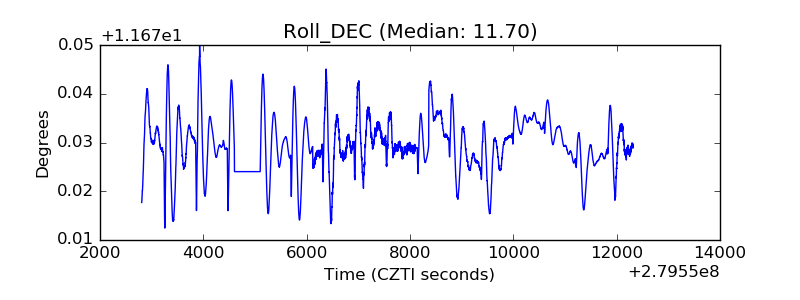 |
| _Roll_RA | 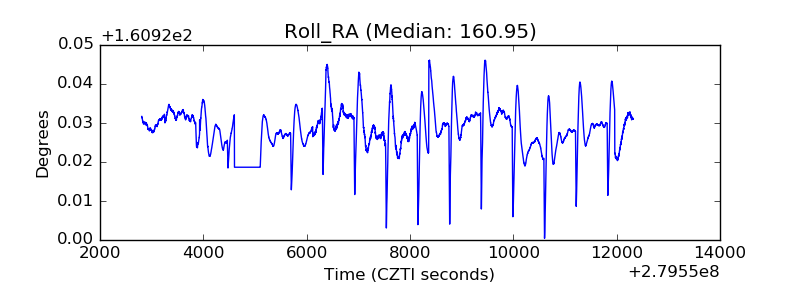 |
| Veto Counter | 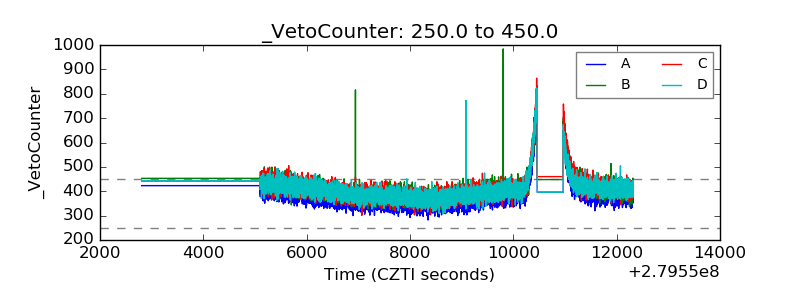 |