| Param | Original file | Final file |
|---|---|---|
| Filename | modeM0/AS1T03_034T01_9000002500_16867cztM0_level2.evt | modeM0/AS1T03_034T01_9000002500_16867cztM0_level2_quad_clean.evt |
| Size (bytes) | 697,478,400 | 66,712,320 |
| Size | 665.2 MB | 63.6 MB |
| Events in quadrant A | 3,889,567 | 383,736 |
| Events in quadrant B | 4,066,107 | 385,702 |
| Events in quadrant C | 3,630,196 | 374,908 |
| Events in quadrant D | 9,031,904 | 355,488 |
| Mode M9 | |||
|---|---|---|---|
| Quadrant | BADHDUFLAG | Total packets | Discarded packets |
| A | 0 | 2 | 0 |
| B | 0 | 2 | 0 |
| C | 0 | 2 | 0 |
| D | 0 | 2 | 0 |
| Mode M0 | |||
|---|---|---|---|
| Quadrant | BADHDUFLAG | Total packets | Discarded packets |
| A | 0 | 16422 | 3 |
| B | 0 | 16631 | 2 |
| C | 0 | 15530 | 2 |
| D | 0 | 32045 | 2 |
| Mode SS | |||
|---|---|---|---|
| Quadrant | BADHDUFLAG | Total packets | Discarded packets |
| A | 0 | 152 | 0 |
| B | 0 | 152 | 0 |
| C | 0 | 152 | 0 |
| D | 0 | 152 | 0 |
| Quadrant | Total seconds | Saturated seconds | Saturation percentage |
|---|---|---|---|
| A | 7468 | 143 | 1.914837% |
| B | 7468 | 178 | 2.383503% |
| C | 7468 | 175 | 2.343332% |
| D | 7469 | 1491 | 19.962512% |
Noise dominated data is calculated using 1-second bins in cleaned event files. If a bin has >2000 counts, and if more than 50% of those come from <1% of pixels, then it is considered to be noise-dominated and hence unusable.
| Quadrant | # 1 sec bins | Bins with >0 counts | Bins with >2000 counts | High rate bins dominated by noise | Noise dominated (total time) | Noise dominated (detector-on time) | Marked lightcurve |
|---|---|---|---|---|---|---|---|
| A | 7719 | 7470 | 6 | 6 | 0.08% | 0.08% | 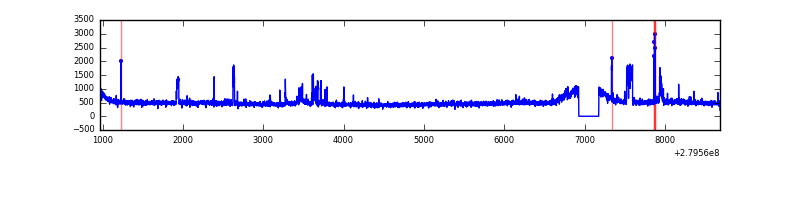 |
| B | 7719 | 7470 | 20 | 20 | 0.26% | 0.27% | 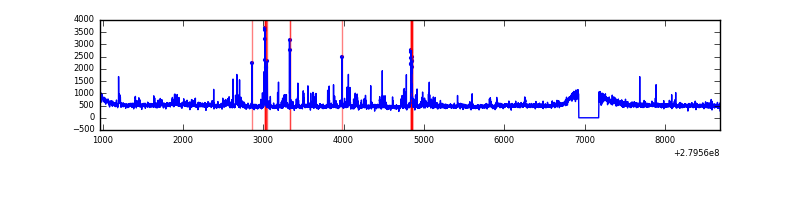 |
| C | 7719 | 7470 | 0 | 0 | 0.00% | 0.00% | 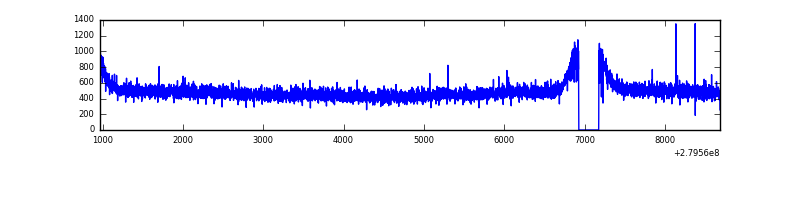 |
| D | 7720 | 7471 | 970 | 970 | 12.56% | 12.98% | 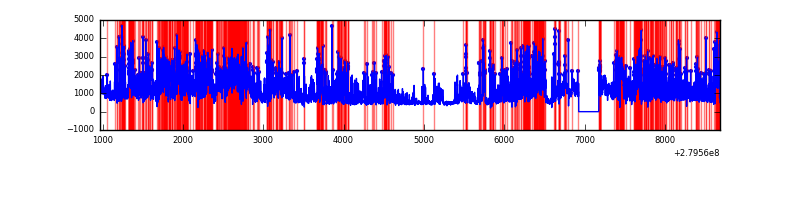 |
Top three noisy pixels from each quadrant. If the there are fewer than three noisy pixels in the level2.evt file, extra rows are filled as -1
| Pixel properties | Quadrant properties | ||||||
|---|---|---|---|---|---|---|---|
| Quadrant | DetID | PixID | Counts | Sigma | Mean | Median | Sigma |
| A | 0 | 23 | 153072 | 796.13 | 933 | 912 | 191.1 |
| A | 15 | 174 | 135103 | 702.11 | 933 | 912 | 191.1 |
| A | 0 | 226 | 17387 | 86.2 | 933 | 912 | 191.1 |
| B | 10 | 16 | 184188 | 1016.82 | 928 | 903 | 180.3 |
| B | 15 | 35 | 82424 | 452.26 | 928 | 903 | 180.3 |
| B | 0 | 229 | 44702 | 242.99 | 928 | 903 | 180.3 |
| C | 14 | 238 | 135194 | 634.06 | 895 | 902 | 211.8 |
| C | 13 | 61 | 6353 | 25.74 | 895 | 902 | 211.8 |
| C | 7 | 247 | 3730 | 13.35 | 895 | 902 | 211.8 |
| D | 1 | 52 | 5579883 | 26549.88 | 851 | 827 | 210.1 |
| D | 10 | 70 | 114770 | 542.24 | 851 | 827 | 210.1 |
| D | 2 | 234 | 36644 | 170.45 | 851 | 827 | 210.1 |
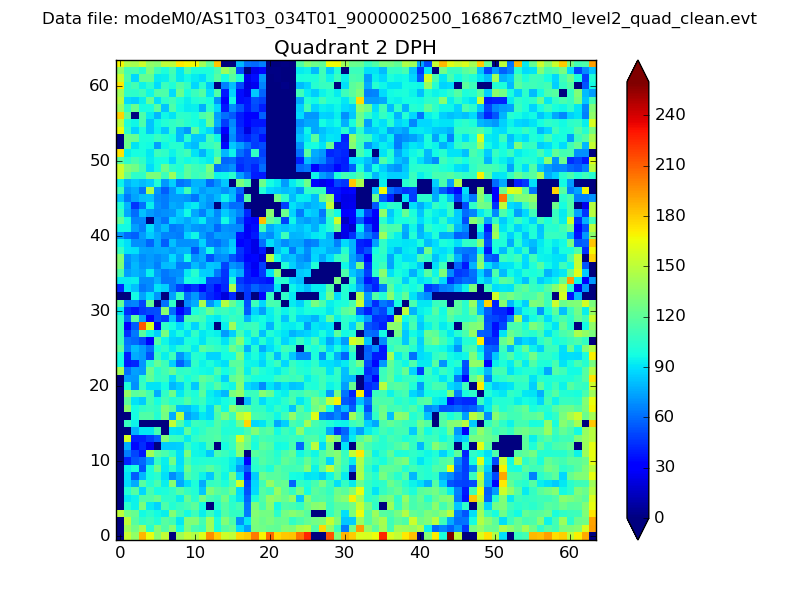
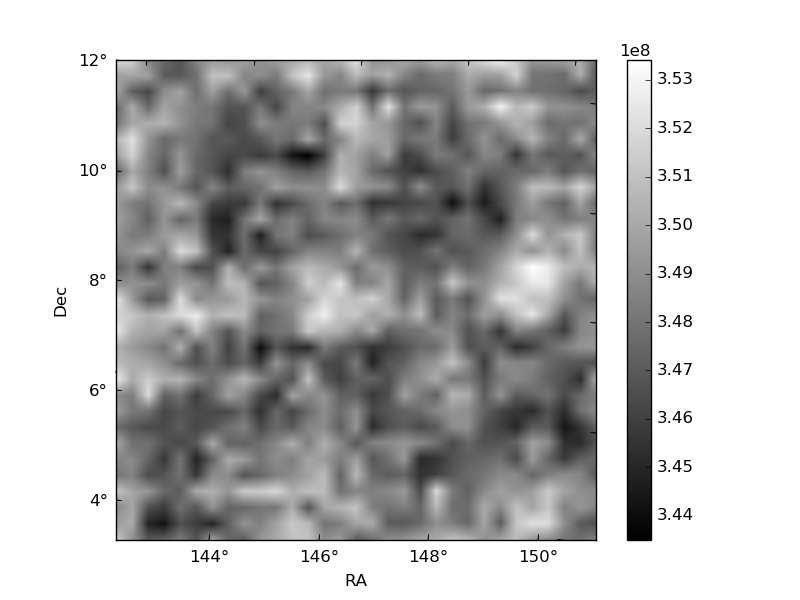
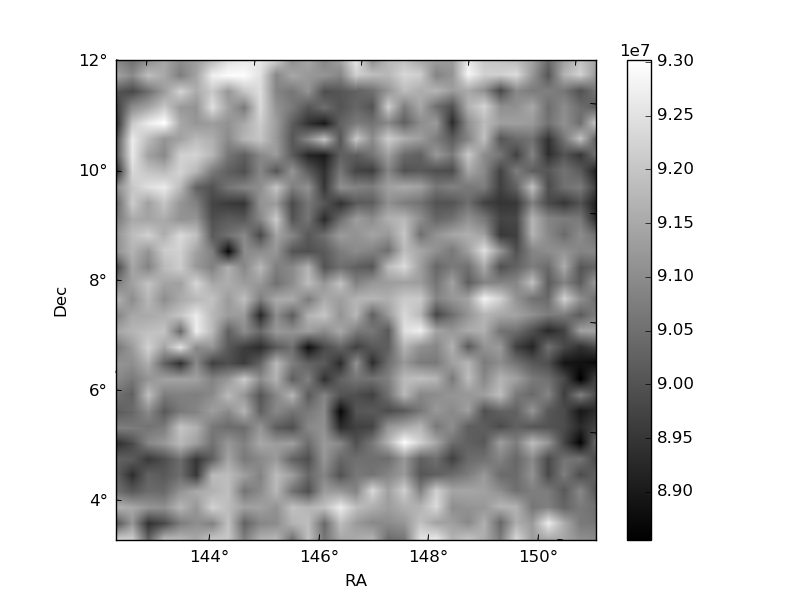
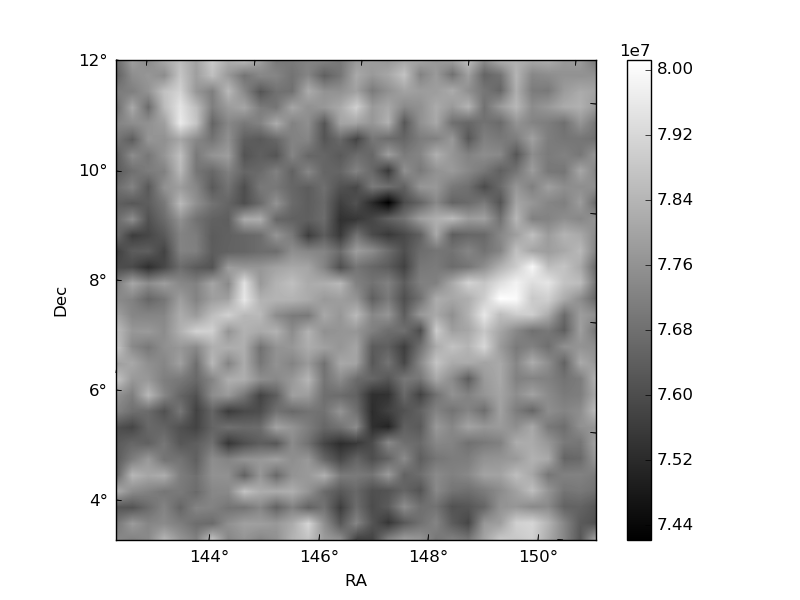
Histogram calculated using DETX and DETY for each event in the final _common_clean file
| Quadrant A | 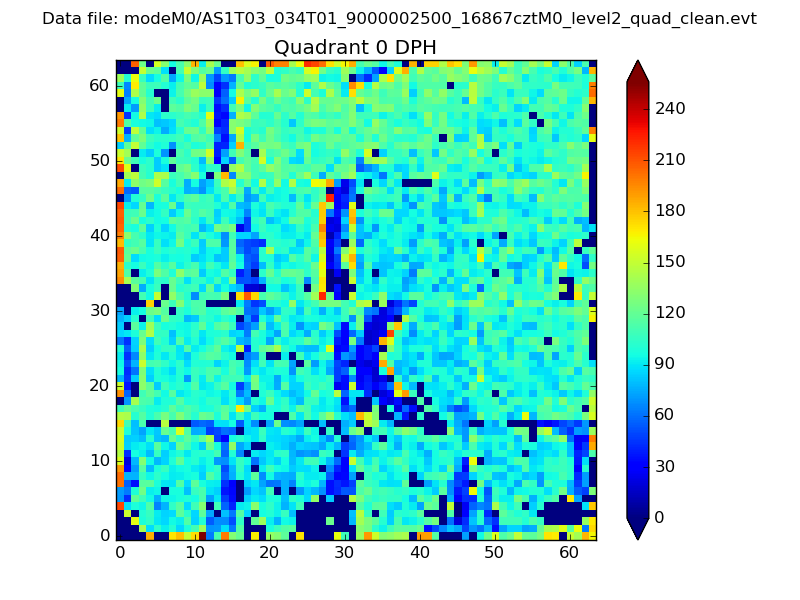 |
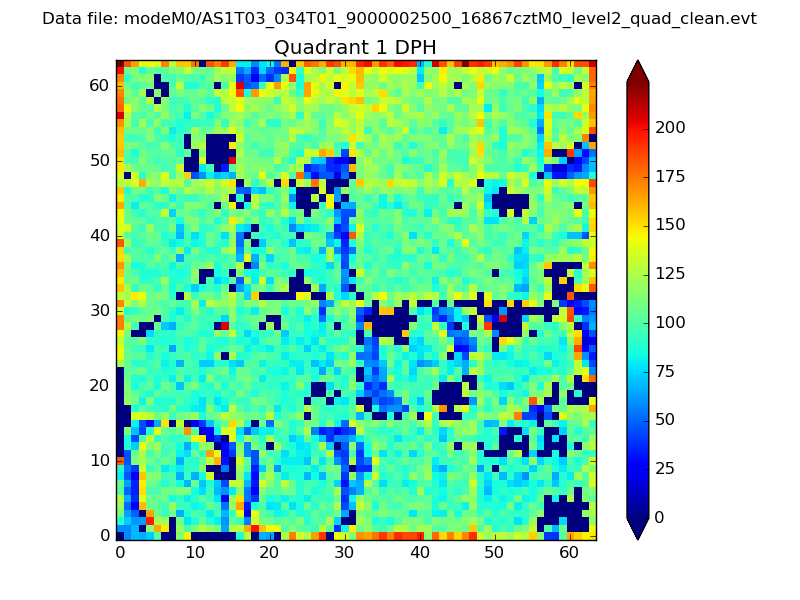 |
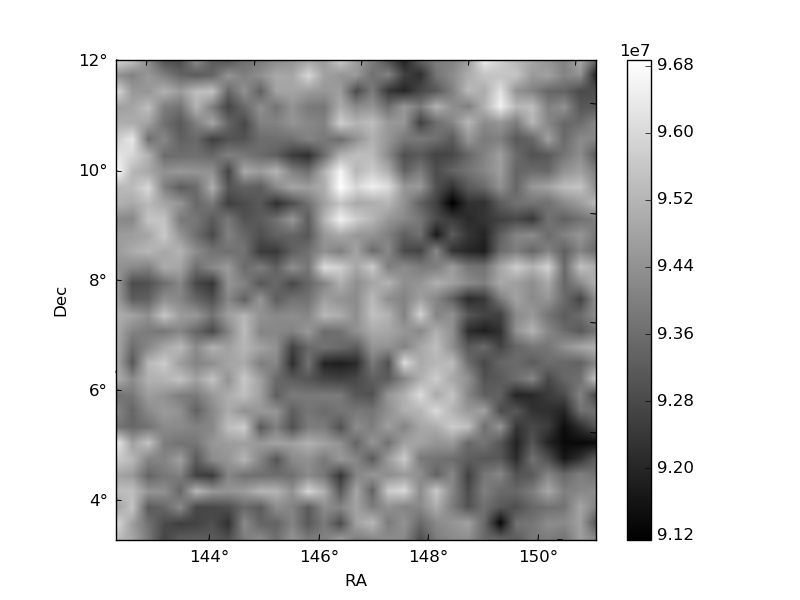
Quadrant B |
|---|---|---|---|
| Quadrant D | 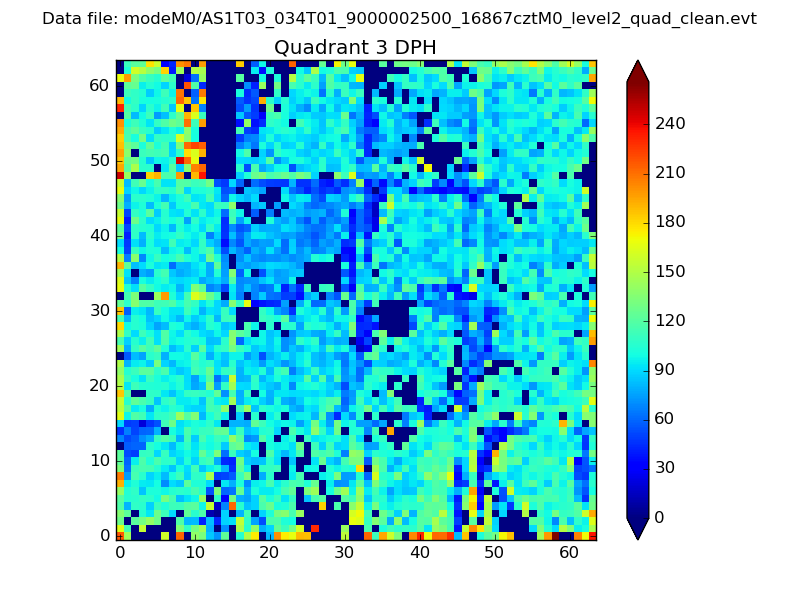 |
 |
Quadrant C |
| Plot type | Count rate plots | Images |
|---|---|---|
| Comparison with Poisson distribution Blue bars denote a histogram of data divided into 1 sec bins. Red curve is a Poisson curve with rate = median count rate of data. |
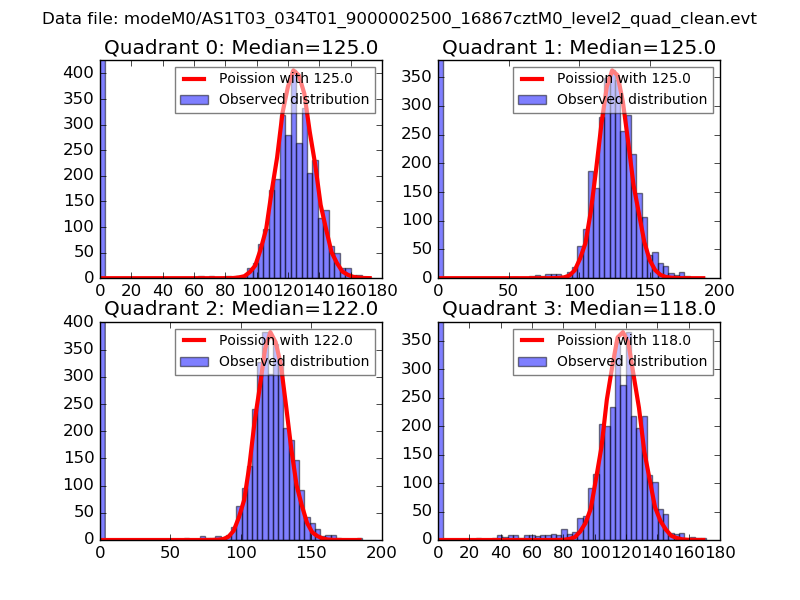 |
 |
| Quadrant-wise count rates Data is divided into 100 sec bins |
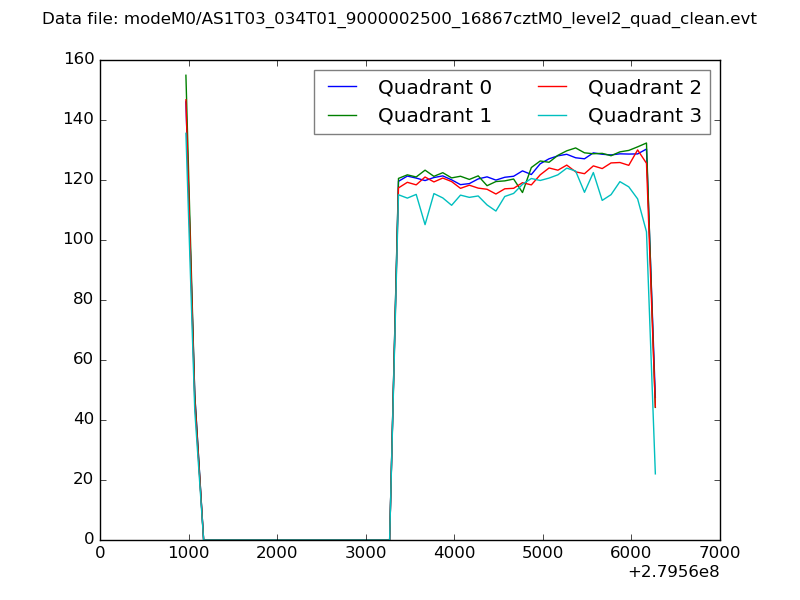 |
|
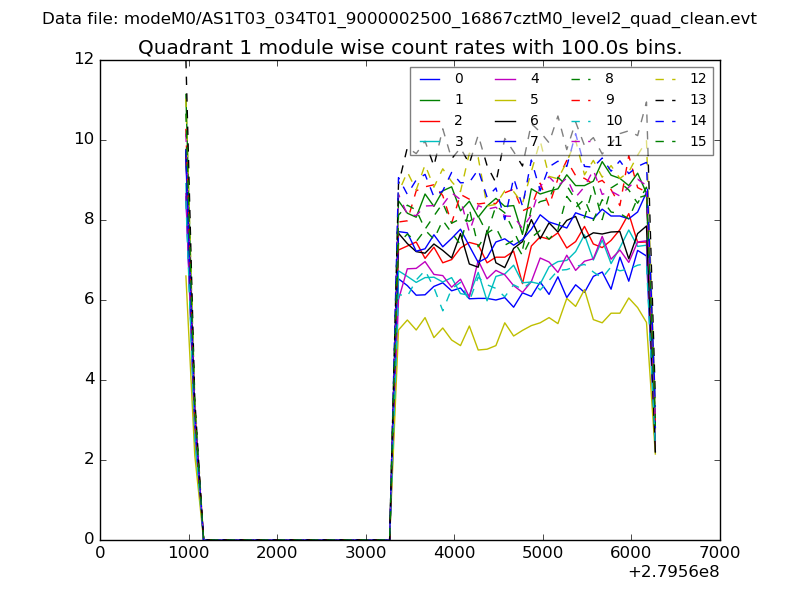
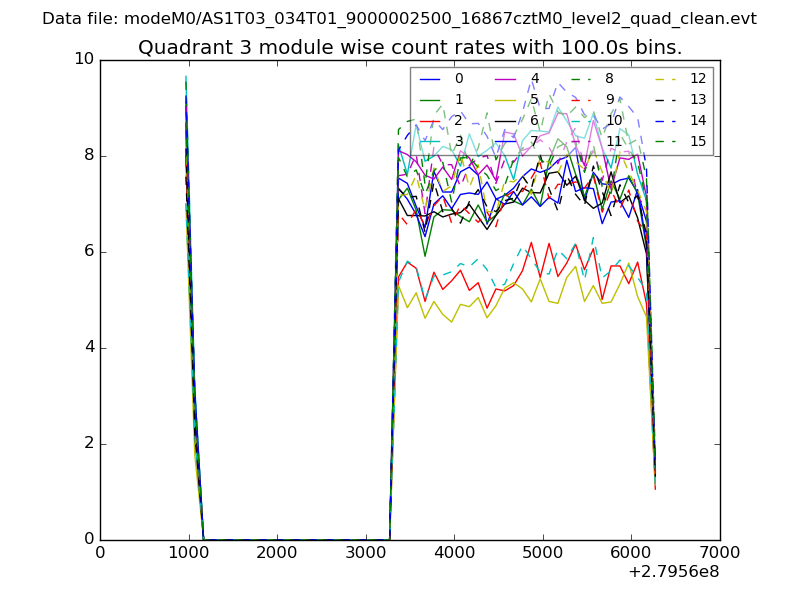
| Module-wise count rates for Quadrant A Data is divided into 100 sec bins |
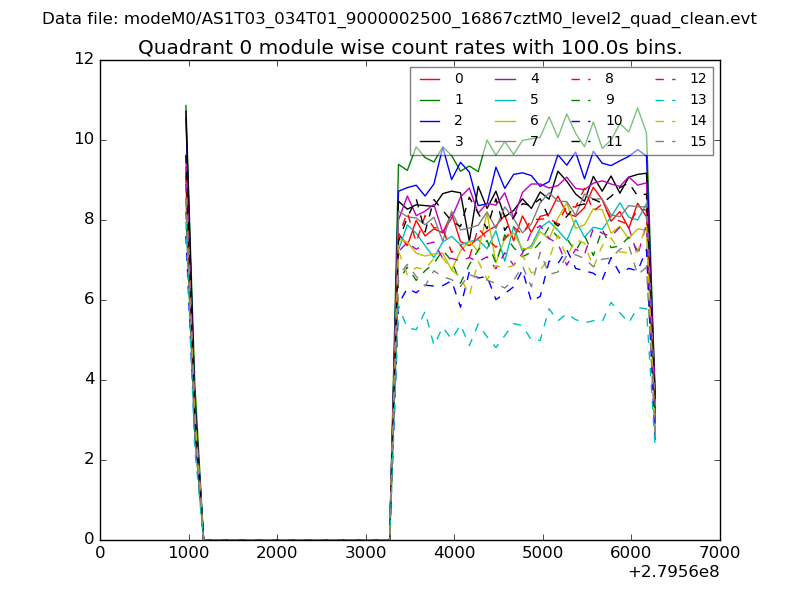 |
 |
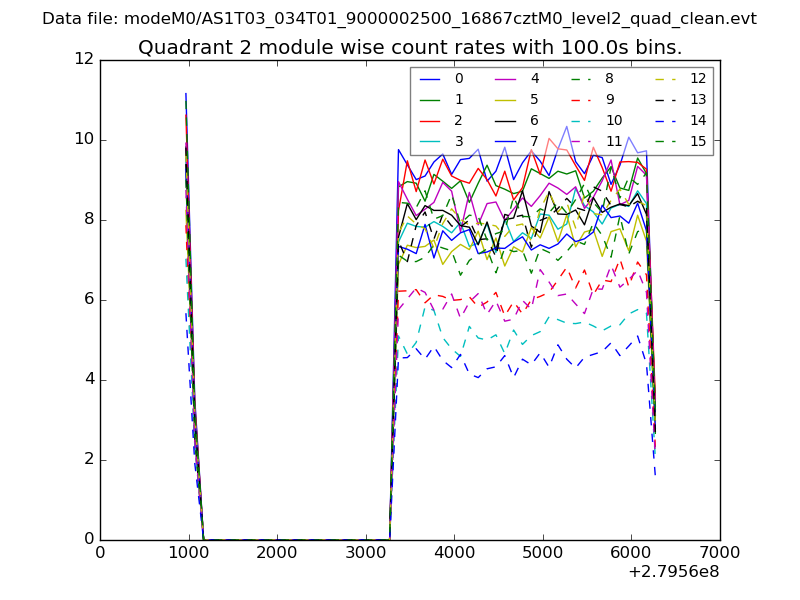
| Module-wise count rates for Quadrant B Data is divided into 100 sec bins |
 |
 |
| Module-wise count rates for Quadrant C Data is divided into 100 sec bins |
 |
 |
| Module-wise count rates for Quadrant D Data is divided into 100 sec bins |
 |
 |
| Parameter | Plot |
|---|---|
| CZT HV Monitor | 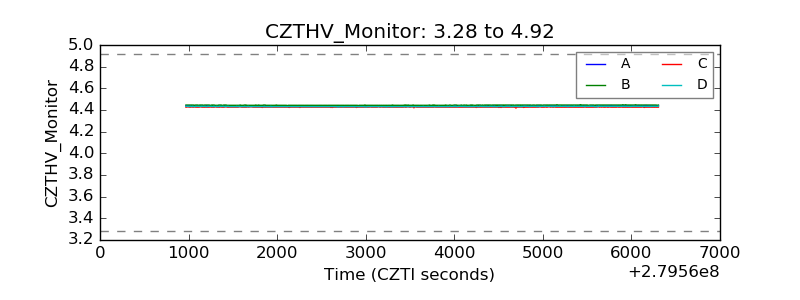 |
| D_VDD | 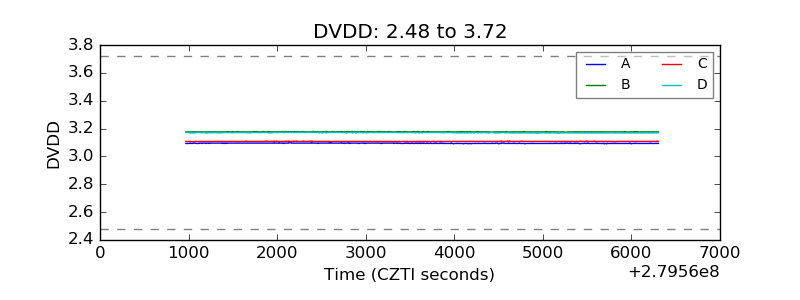 |
| Temperature 1 | 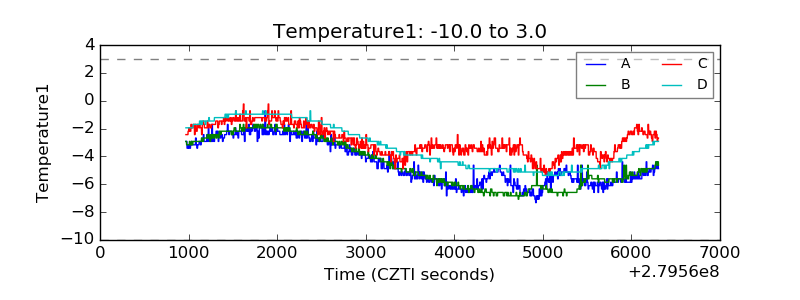 |
| Veto HV Monitor | 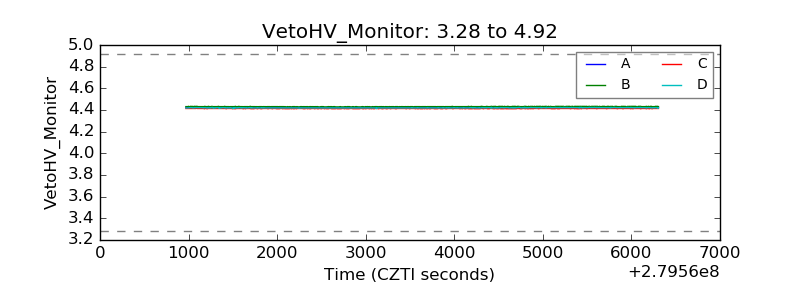 |
| Veto LLD | 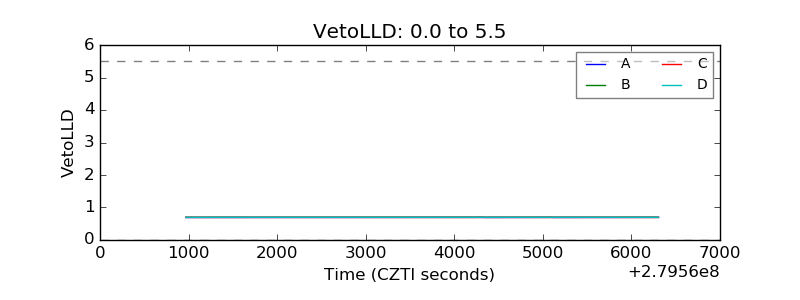 |
| Alpha Counter | 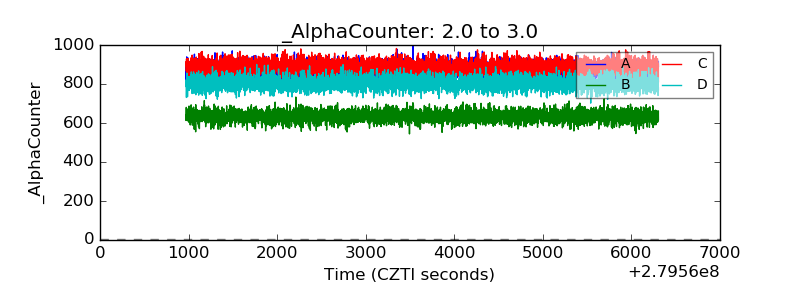 |
| _CPM_Rate | 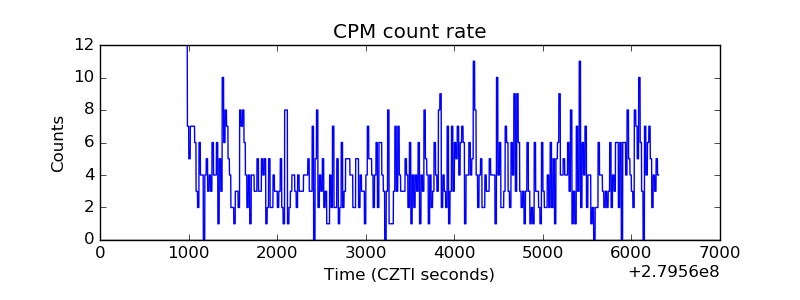 |
| CZT Counter | 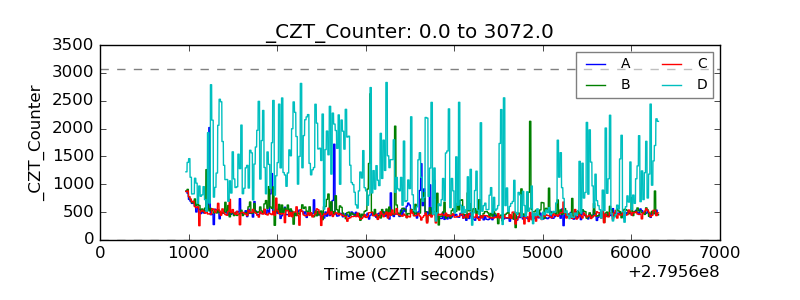 |
| +2.5 Volts monitor |  |
| +5 Volts monitor | 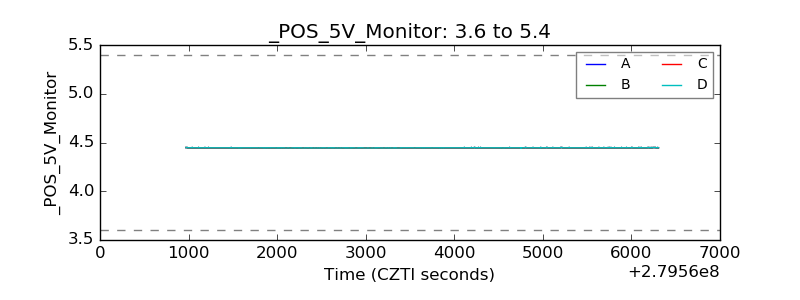 |
| _ROLL_ROT | 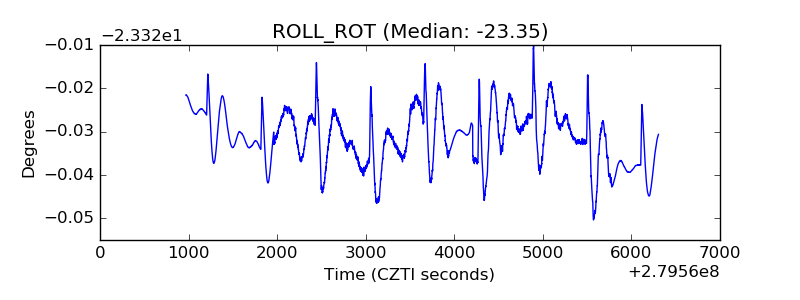 |
| _Roll_DEC | 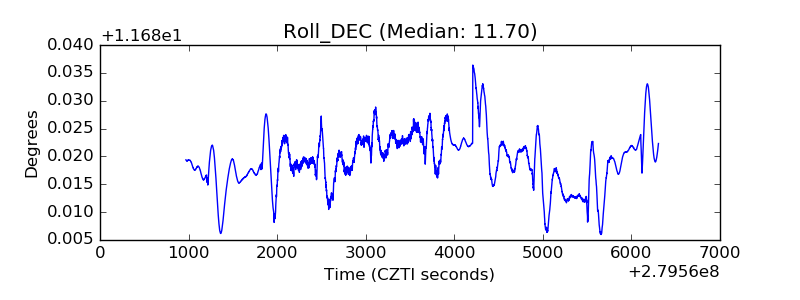 |
| _Roll_RA | 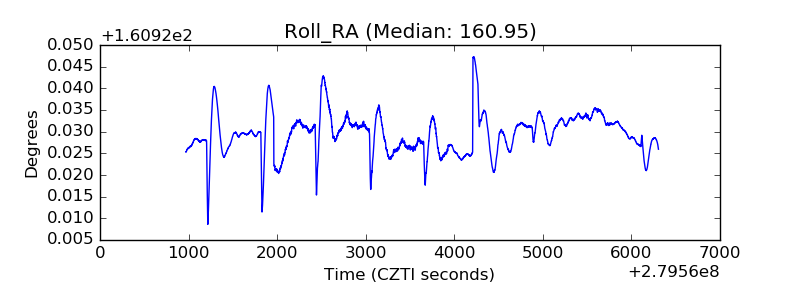 |
| Veto Counter | 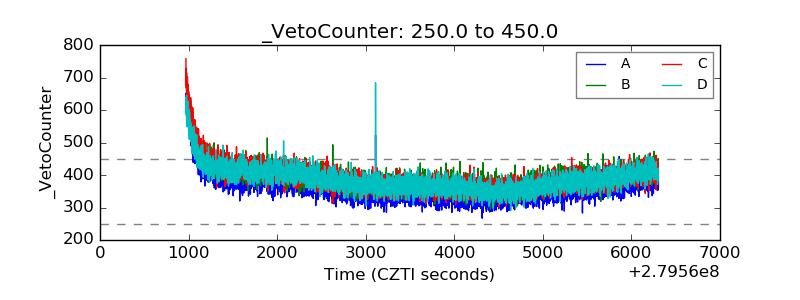 |