| Param | Original file | Final file |
|---|---|---|
| Filename | modeM0/AS1A05_004T06_9000002506_16881cztM0_level2.evt | modeM0/AS1A05_004T06_9000002506_16881cztM0_level2_quad_clean.evt |
| Size (bytes) | 632,370,240 | 94,754,880 |
| Size | 603.1 MB | 90.4 MB |
| Events in quadrant A | 3,845,060 | 614,153 |
| Events in quadrant B | 3,864,526 | 618,277 |
| Events in quadrant C | 3,347,571 | 601,641 |
| Events in quadrant D | 7,618,784 | 545,930 |
| Mode M9 | |||
|---|---|---|---|
| Quadrant | BADHDUFLAG | Total packets | Discarded packets |
| A | 0 | 3 | 0 |
| B | 0 | 3 | 0 |
| C | 0 | 3 | 0 |
| D | 0 | 3 | 0 |
| Mode SS | |||
|---|---|---|---|
| Quadrant | BADHDUFLAG | Total packets | Discarded packets |
| A | 0 | 144 | 0 |
| B | 0 | 144 | 0 |
| C | 0 | 144 | 0 |
| D | 0 | 144 | 0 |
| Mode M0 | |||
|---|---|---|---|
| Quadrant | BADHDUFLAG | Total packets | Discarded packets |
| A | 0 | 16072 | 2 |
| B | 0 | 15952 | 1 |
| C | 0 | 14573 | 1 |
| D | 0 | 27516 | 1 |
| Quadrant | Total seconds | Saturated seconds | Saturation percentage |
|---|---|---|---|
| A | 7024 | 171 | 2.434510% |
| B | 7024 | 188 | 2.676538% |
| C | 7024 | 143 | 2.035877% |
| D | 7024 | 1022 | 14.550114% |
Noise dominated data is calculated using 1-second bins in cleaned event files. If a bin has >2000 counts, and if more than 50% of those come from <1% of pixels, then it is considered to be noise-dominated and hence unusable.
| Quadrant | # 1 sec bins | Bins with >0 counts | Bins with >2000 counts | High rate bins dominated by noise | Noise dominated (total time) | Noise dominated (detector-on time) | Marked lightcurve |
|---|---|---|---|---|---|---|---|
| A | 7310 | 7027 | 66 | 66 | 0.90% | 0.94% | 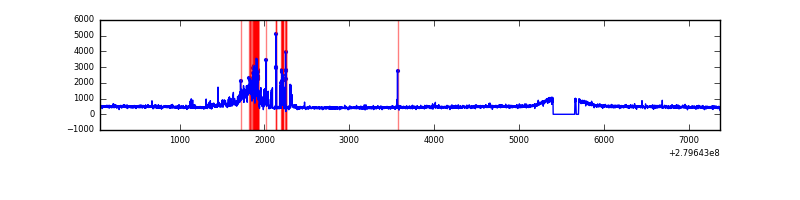 |
| B | 7310 | 7027 | 47 | 47 | 0.64% | 0.67% | 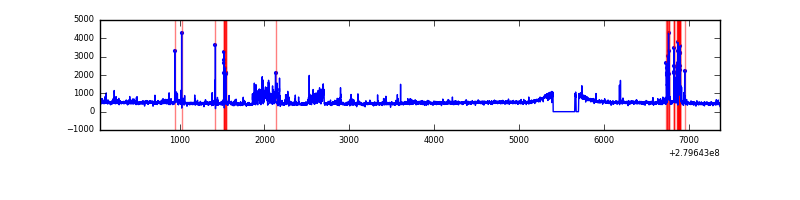 |
| C | 7310 | 7027 | 1 | 1 | 0.01% | 0.01% | 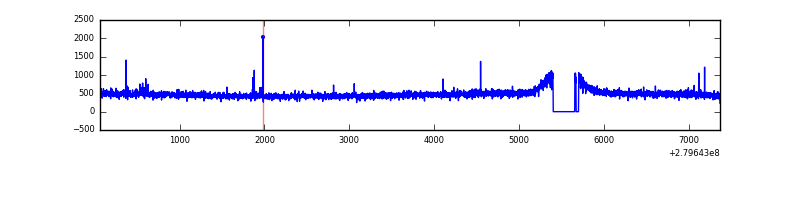 |
| D | 7310 | 7027 | 771 | 771 | 10.55% | 10.97% |  |
Top three noisy pixels from each quadrant. If the there are fewer than three noisy pixels in the level2.evt file, extra rows are filled as -1
| Pixel properties | Quadrant properties | ||||||
|---|---|---|---|---|---|---|---|
| Quadrant | DetID | PixID | Counts | Sigma | Mean | Median | Sigma |
| A | 15 | 174 | 554422 | 3188.95 | 850 | 831 | 173.6 |
| A | 9 | 143 | 11454 | 61.19 | 850 | 831 | 173.6 |
| A | 0 | 226 | 7601 | 39.0 | 850 | 831 | 173.6 |
| B | 15 | 35 | 254650 | 1558.09 | 842 | 819 | 162.9 |
| B | 10 | 16 | 177797 | 1086.35 | 842 | 819 | 162.9 |
| B | 7 | 220 | 36399 | 218.4 | 842 | 819 | 162.9 |
| C | 14 | 238 | 123389 | 634.46 | 818 | 822 | 193.2 |
| C | 3 | 233 | 16727 | 82.33 | 818 | 822 | 193.2 |
| C | 5 | 112 | 15261 | 74.74 | 818 | 822 | 193.2 |
| D | 1 | 52 | 4349312 | 22176.16 | 795 | 772 | 196.1 |
| D | 10 | 70 | 176768 | 897.52 | 795 | 772 | 196.1 |
| D | 2 | 234 | 35120 | 175.16 | 795 | 772 | 196.1 |
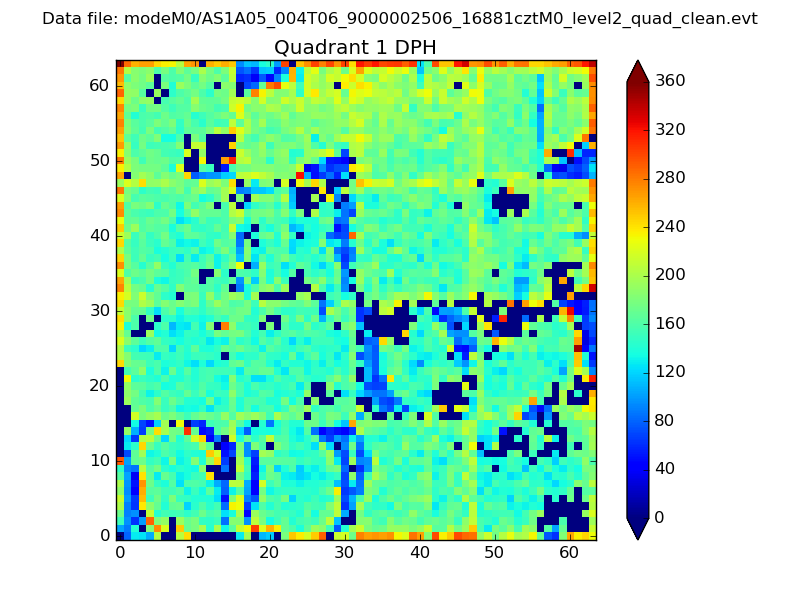
Histogram calculated using DETX and DETY for each event in the final _common_clean file
| Quadrant A | 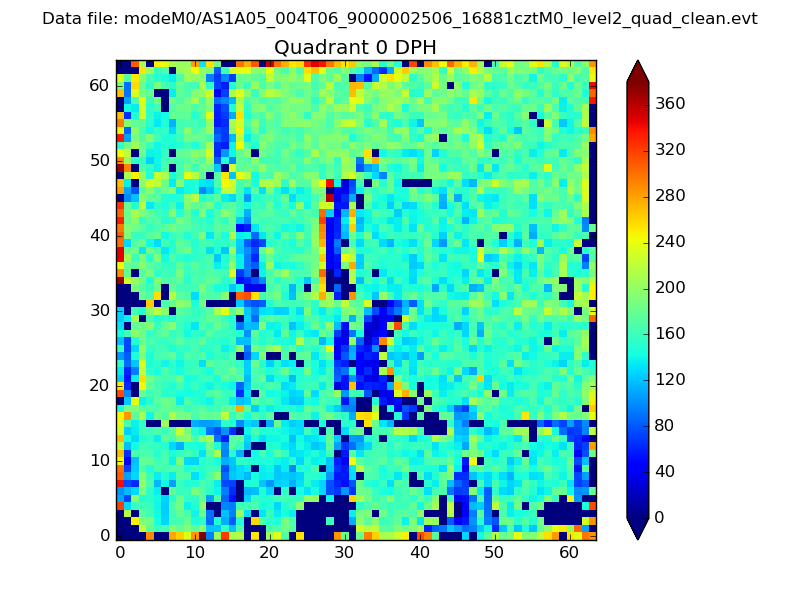 |
 |
Quadrant B |
|---|---|---|---|
| Quadrant D | 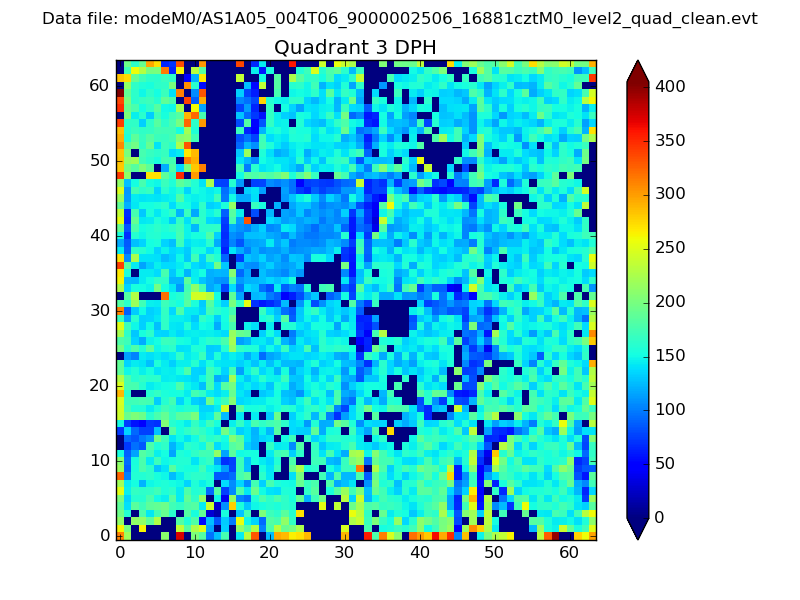 |
 |
Quadrant C |
| Plot type | Count rate plots | Images |
|---|---|---|
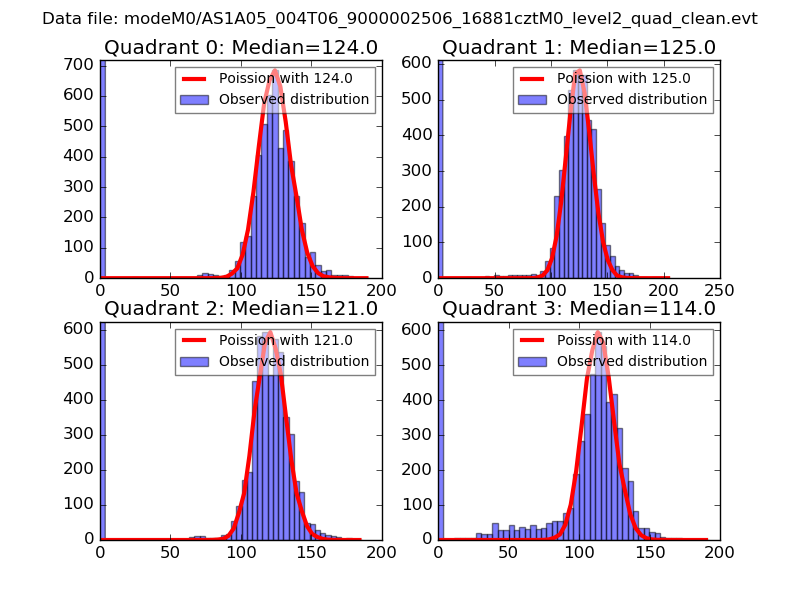
| Comparison with Poisson distribution Blue bars denote a histogram of data divided into 1 sec bins. Red curve is a Poisson curve with rate = median count rate of data. |
 |
 |
| Quadrant-wise count rates Data is divided into 100 sec bins |
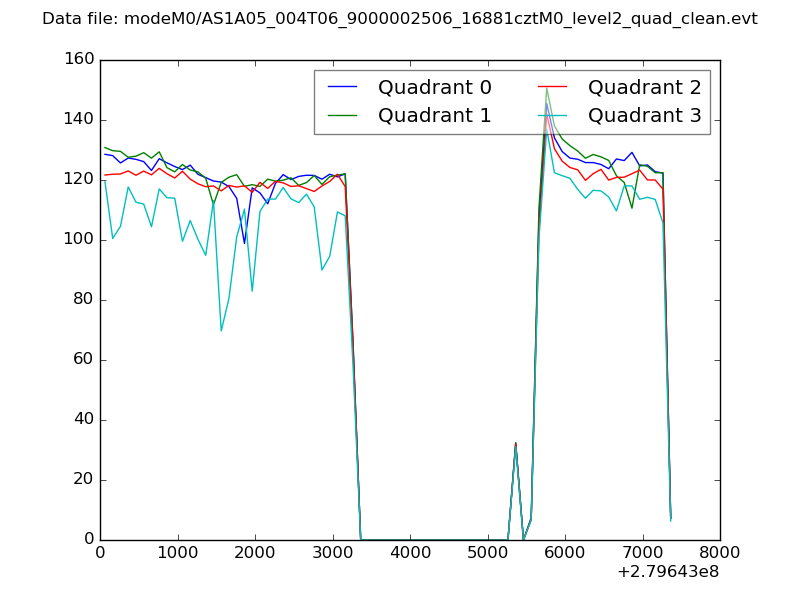 |
|
| Module-wise count rates for Quadrant A Data is divided into 100 sec bins |
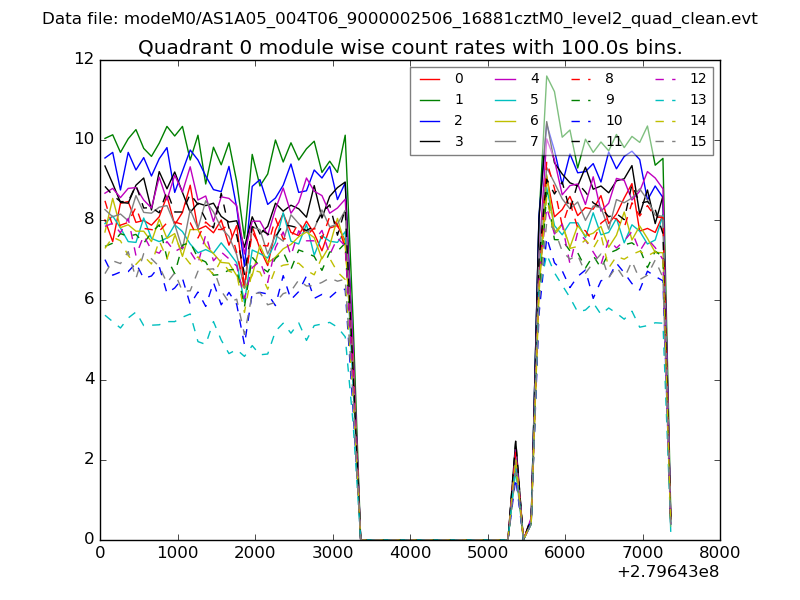 |
 |
| Module-wise count rates for Quadrant B Data is divided into 100 sec bins |
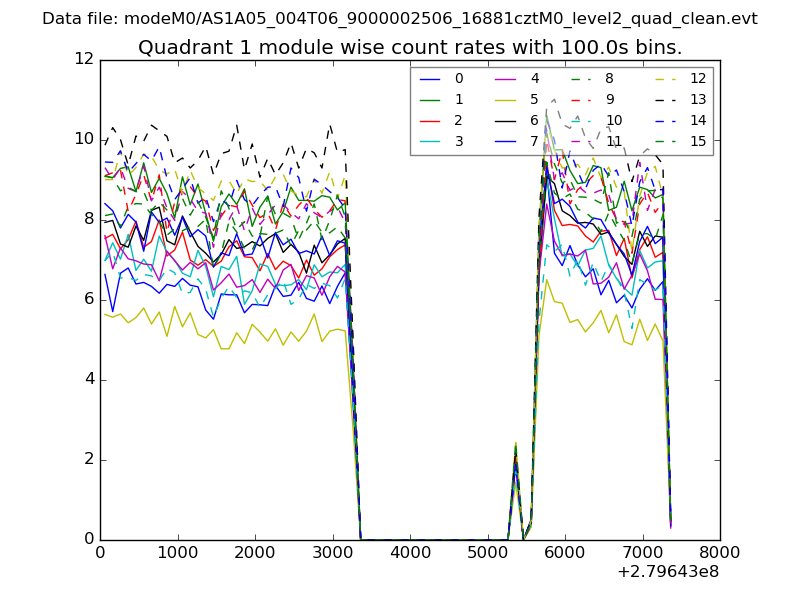 |
 |
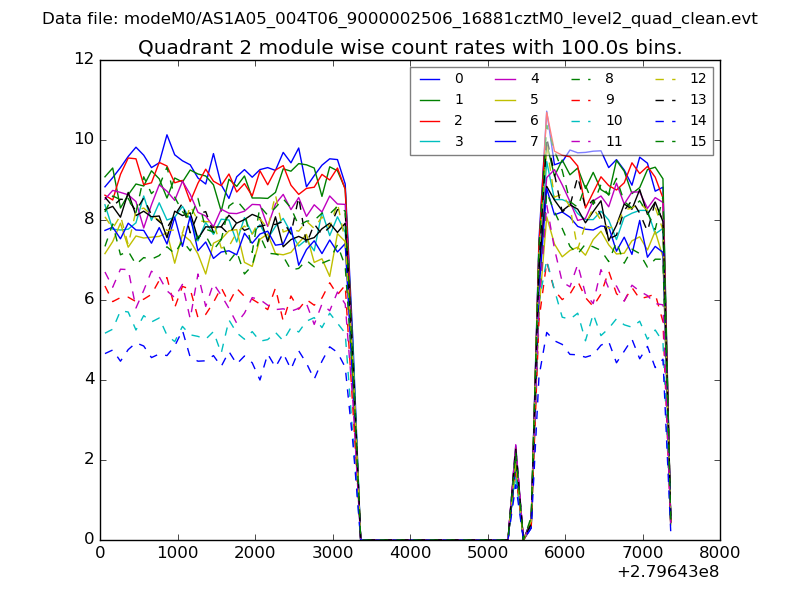
| Module-wise count rates for Quadrant C Data is divided into 100 sec bins |
 |
 |
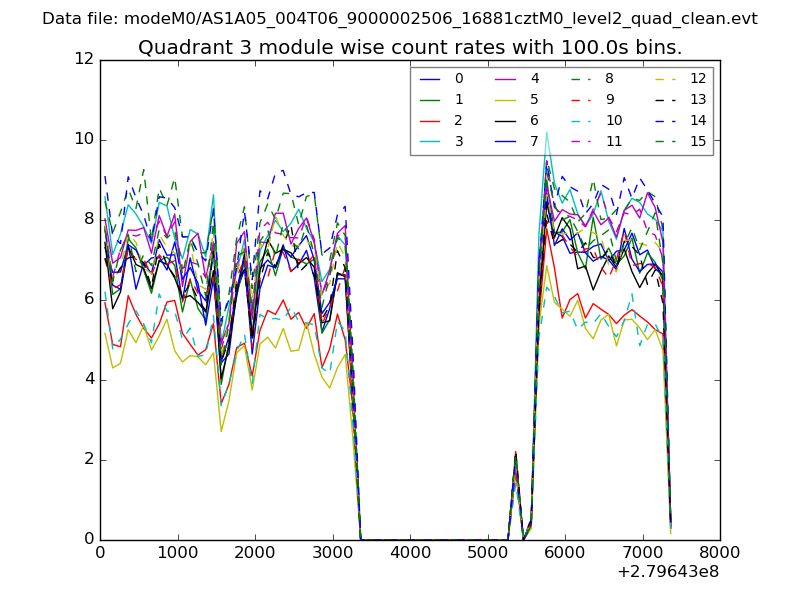
| Module-wise count rates for Quadrant D Data is divided into 100 sec bins |
 |
 |
| Parameter | Plot |
|---|---|
| CZT HV Monitor | 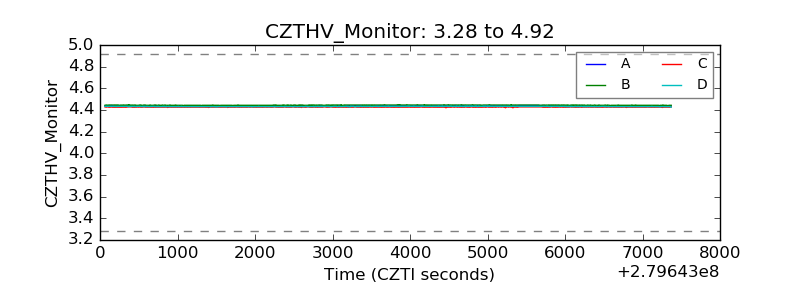 |
| D_VDD |  |
| Temperature 1 | 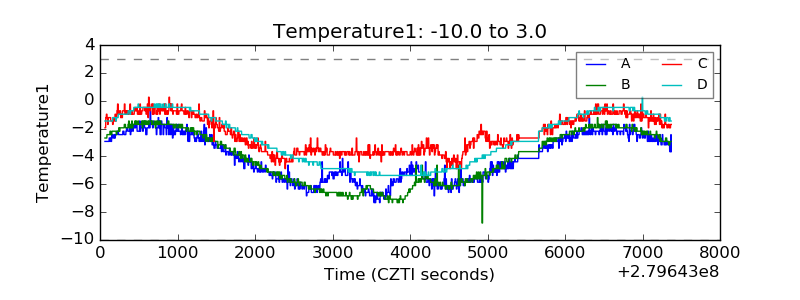 |
| Veto HV Monitor |  |
| Veto LLD | 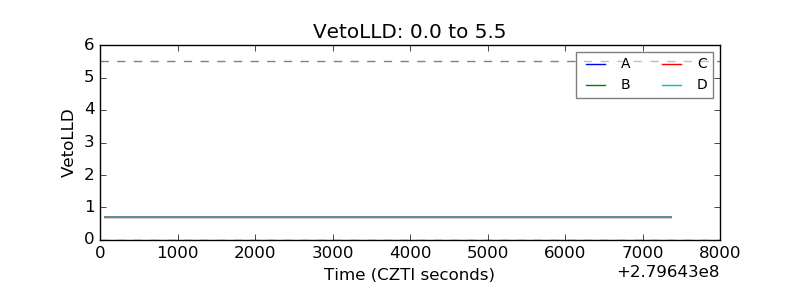 |
| Alpha Counter | 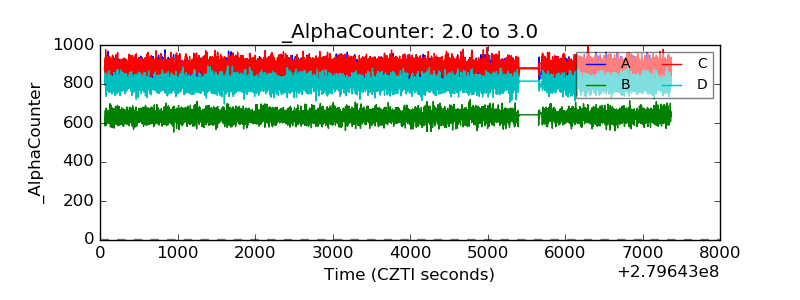 |
| _CPM_Rate | 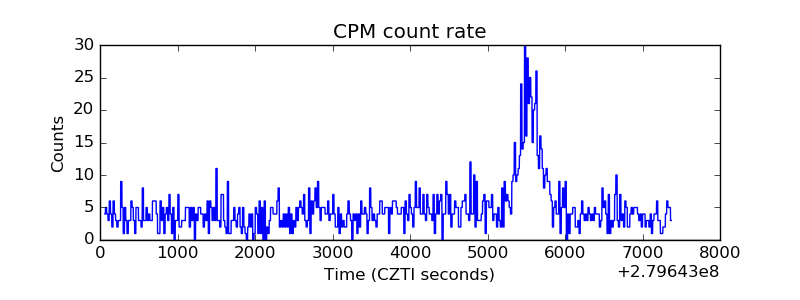 |
| CZT Counter | 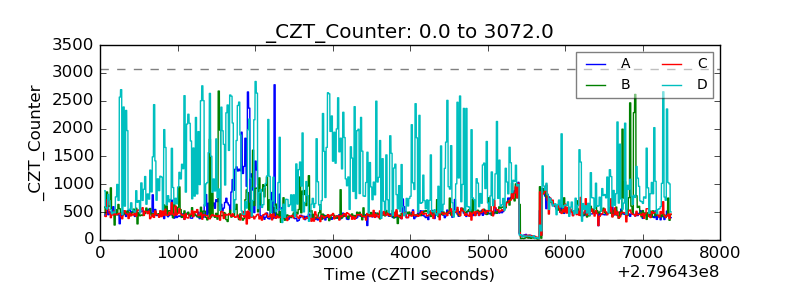 |
| +2.5 Volts monitor |  |
| +5 Volts monitor |  |
| _ROLL_ROT | 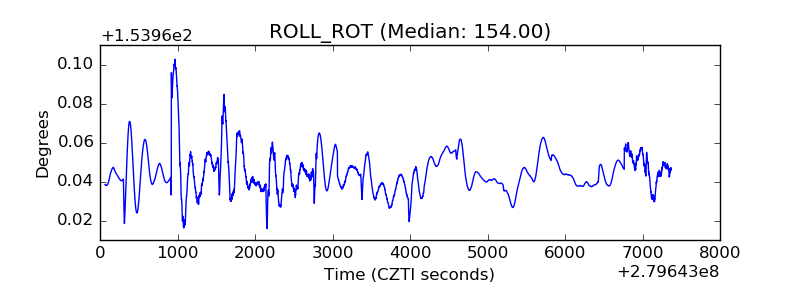 |
| _Roll_DEC | 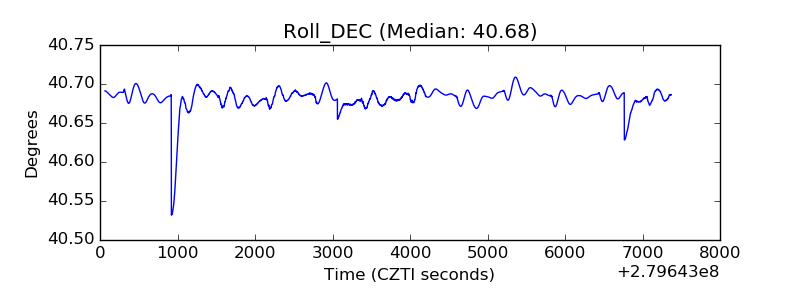 |
| _Roll_RA |  |
| Veto Counter | 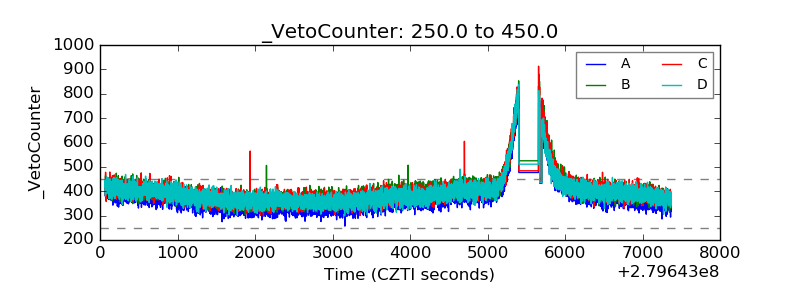 |