| Param | Original file | Final file |
|---|---|---|
| Filename | modeM0/AS1A05_004T06_9000002506_16882cztM0_level2.evt | modeM0/AS1A05_004T06_9000002506_16882cztM0_level2_quad_clean.evt |
| Size (bytes) | 624,697,920 | 96,010,560 |
| Size | 595.8 MB | 91.6 MB |
| Events in quadrant A | 3,349,127 | 627,169 |
| Events in quadrant B | 3,739,078 | 628,043 |
| Events in quadrant C | 3,350,633 | 609,586 |
| Events in quadrant D | 7,998,132 | 546,600 |
| Mode M9 | |||
|---|---|---|---|
| Quadrant | BADHDUFLAG | Total packets | Discarded packets |
| A | 0 | 2 | 0 |
| B | 0 | 2 | 0 |
| C | 0 | 2 | 0 |
| D | 0 | 2 | 0 |
| Mode SS | |||
|---|---|---|---|
| Quadrant | BADHDUFLAG | Total packets | Discarded packets |
| A | 0 | 146 | 0 |
| B | 0 | 146 | 0 |
| C | 0 | 146 | 0 |
| D | 0 | 146 | 0 |
| Mode M0 | |||
|---|---|---|---|
| Quadrant | BADHDUFLAG | Total packets | Discarded packets |
| A | 0 | 14782 | 3 |
| B | 0 | 15667 | 2 |
| C | 0 | 14677 | 2 |
| D | 0 | 28716 | 2 |
| Quadrant | Total seconds | Saturated seconds | Saturation percentage |
|---|---|---|---|
| A | 7110 | 81 | 1.139241% |
| B | 7110 | 142 | 1.997187% |
| C | 7110 | 122 | 1.715893% |
| D | 7110 | 1088 | 15.302391% |
Noise dominated data is calculated using 1-second bins in cleaned event files. If a bin has >2000 counts, and if more than 50% of those come from <1% of pixels, then it is considered to be noise-dominated and hence unusable.
| Quadrant | # 1 sec bins | Bins with >0 counts | Bins with >2000 counts | High rate bins dominated by noise | Noise dominated (total time) | Noise dominated (detector-on time) | Marked lightcurve |
|---|---|---|---|---|---|---|---|
| A | 7391 | 7113 | 5 | 5 | 0.07% | 0.07% | 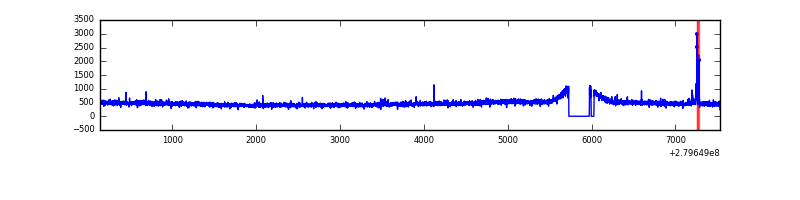 |
| B | 7391 | 7113 | 36 | 36 | 0.49% | 0.51% | 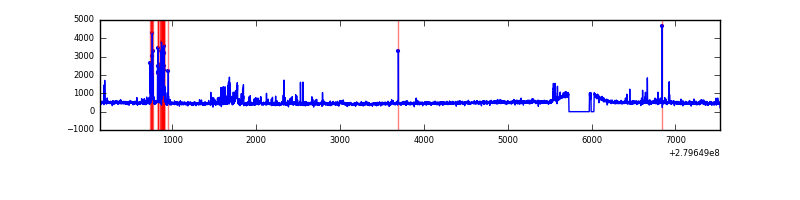 |
| C | 7391 | 7113 | 0 | 0 | 0.00% | 0.00% | 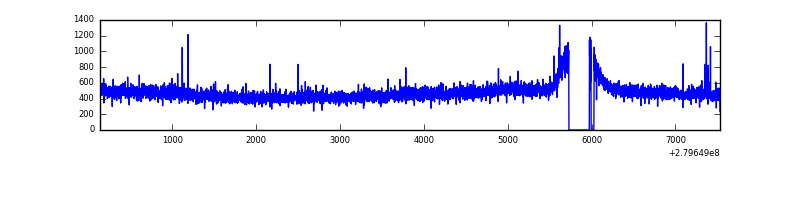 |
| D | 7391 | 7113 | 736 | 736 | 9.96% | 10.35% | 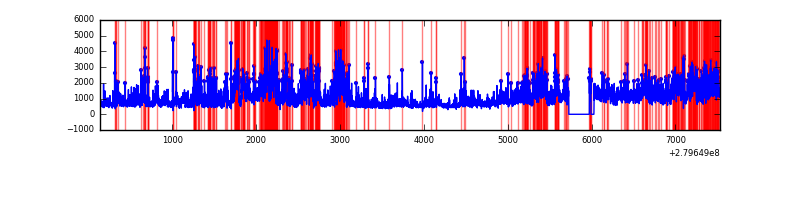 |
Top three noisy pixels from each quadrant. If the there are fewer than three noisy pixels in the level2.evt file, extra rows are filled as -1
| Pixel properties | Quadrant properties | ||||||
|---|---|---|---|---|---|---|---|
| Quadrant | DetID | PixID | Counts | Sigma | Mean | Median | Sigma |
| A | 15 | 174 | 36566 | 203.3 | 852 | 832 | 175.8 |
| A | 0 | 23 | 30383 | 168.12 | 852 | 832 | 175.8 |
| A | 0 | 226 | 9306 | 48.21 | 852 | 832 | 175.8 |
| B | 10 | 16 | 244506 | 1514.89 | 844 | 823 | 160.9 |
| B | 15 | 35 | 96809 | 596.71 | 844 | 823 | 160.9 |
| B | 0 | 229 | 29505 | 178.31 | 844 | 823 | 160.9 |
| C | 14 | 238 | 127524 | 655.11 | 819 | 825 | 193.4 |
| C | 3 | 233 | 12087 | 58.23 | 819 | 825 | 193.4 |
| C | 0 | 207 | 9894 | 46.89 | 819 | 825 | 193.4 |
| D | 1 | 52 | 4526533 | 23222.02 | 794 | 771 | 194.9 |
| D | 10 | 70 | 374656 | 1918.43 | 794 | 771 | 194.9 |
| D | 2 | 234 | 38927 | 195.78 | 794 | 771 | 194.9 |
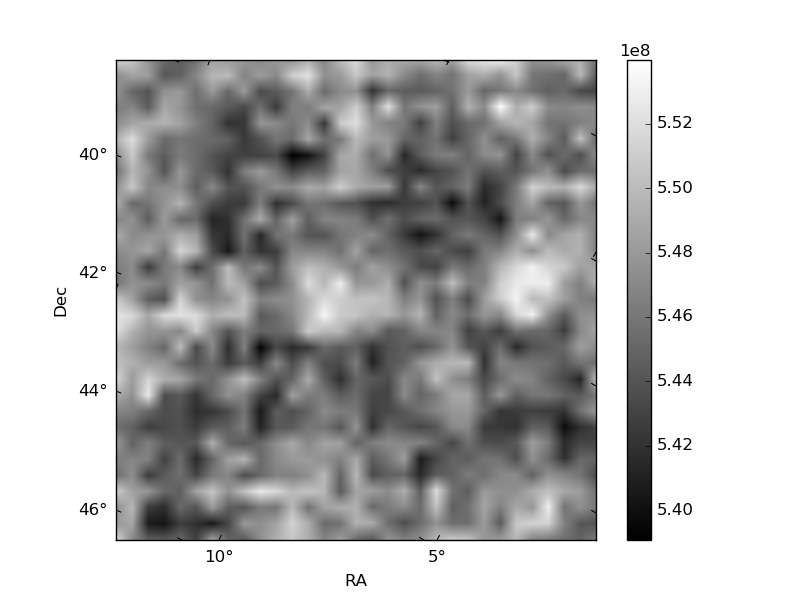
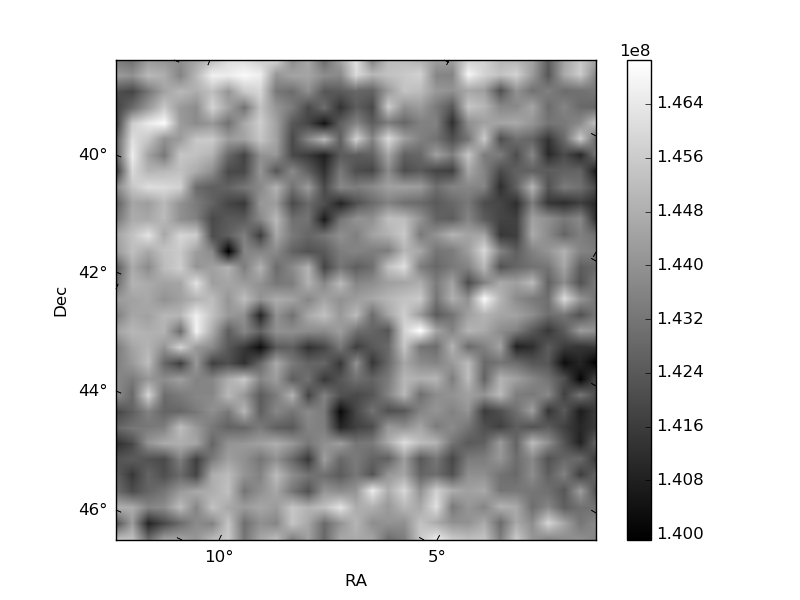
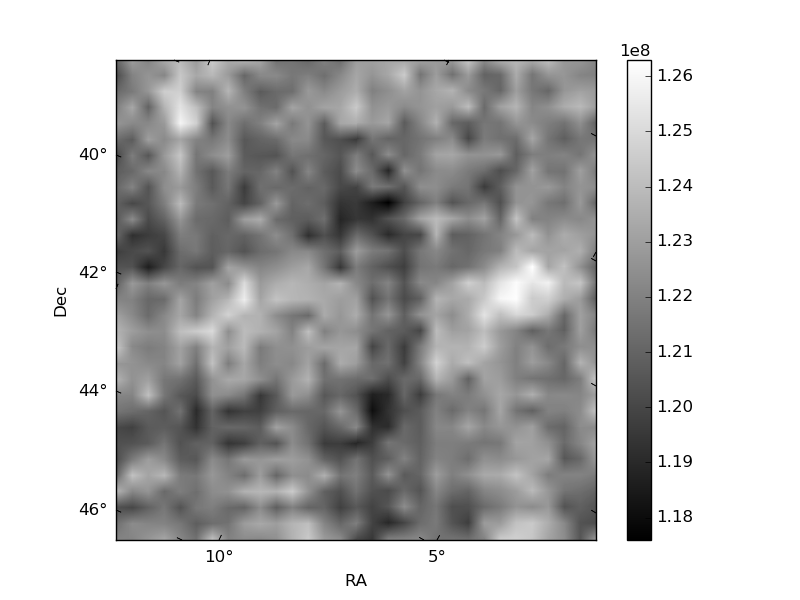
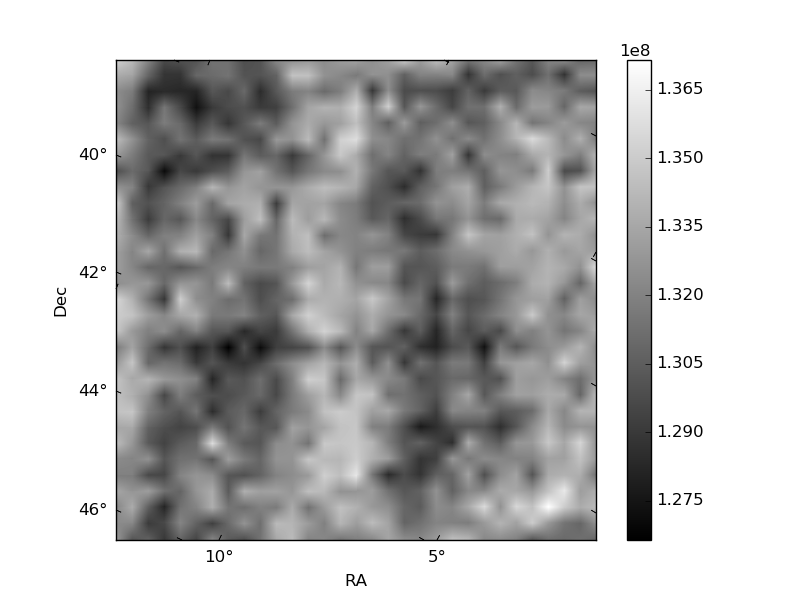
Histogram calculated using DETX and DETY for each event in the final _common_clean file
| Quadrant A | 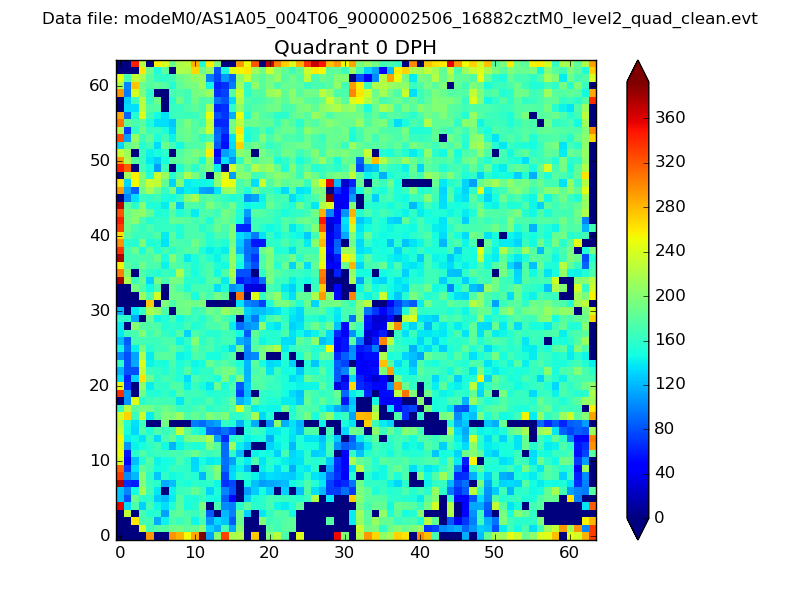 |
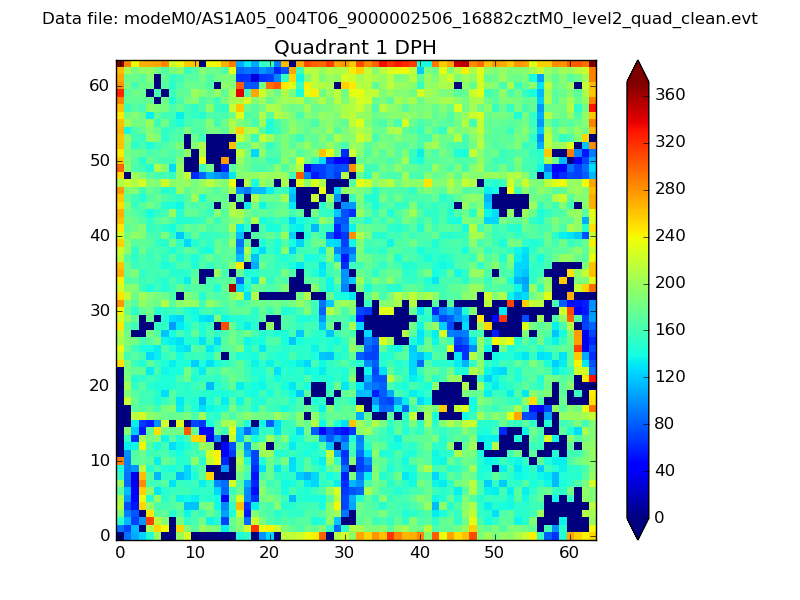 |
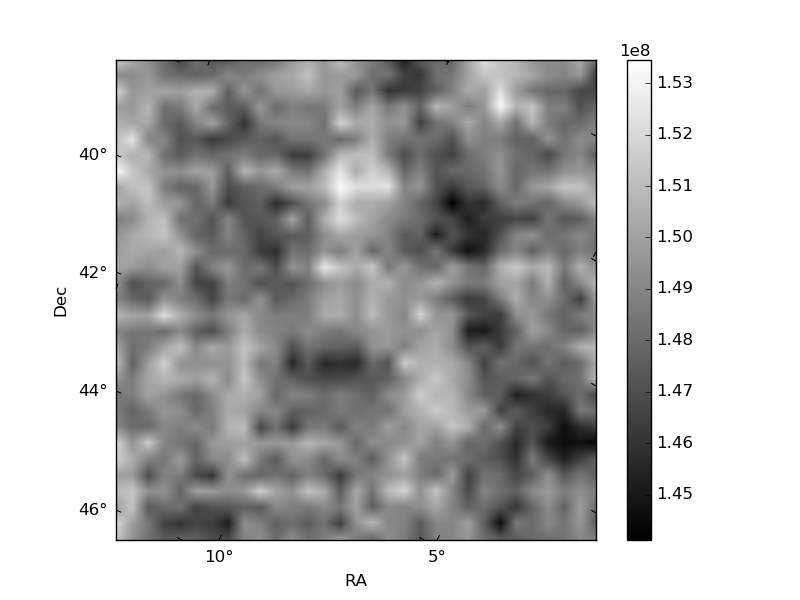
Quadrant B |
|---|---|---|---|
| Quadrant D | 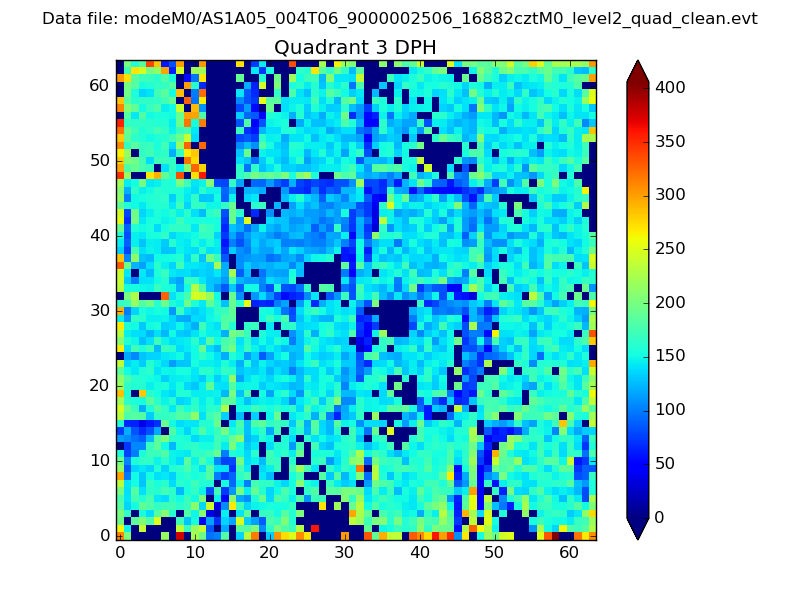 |
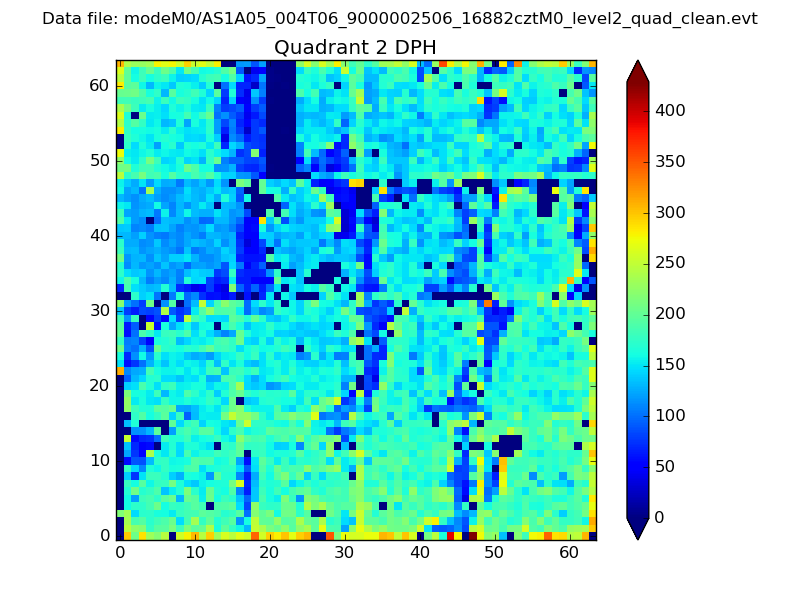 |
Quadrant C |
| Plot type | Count rate plots | Images |
|---|---|---|
| Comparison with Poisson distribution Blue bars denote a histogram of data divided into 1 sec bins. Red curve is a Poisson curve with rate = median count rate of data. |
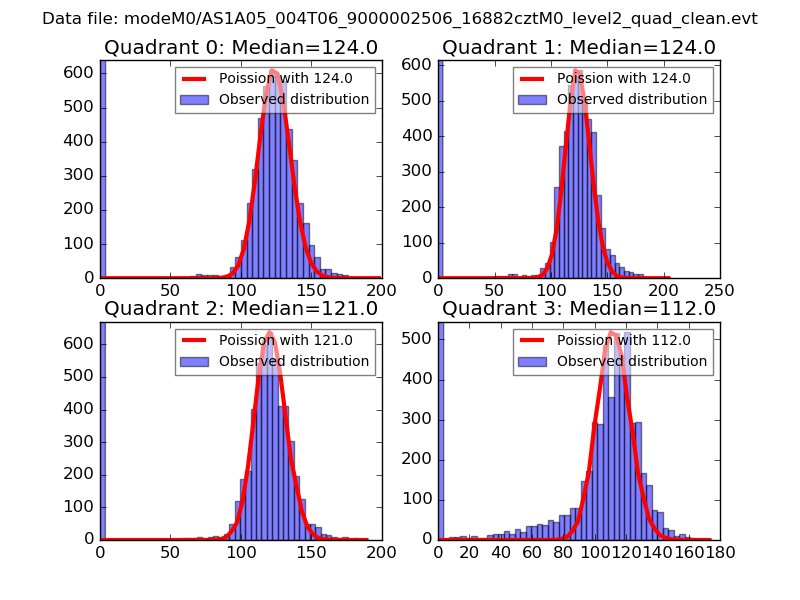 |
 |
| Quadrant-wise count rates Data is divided into 100 sec bins |
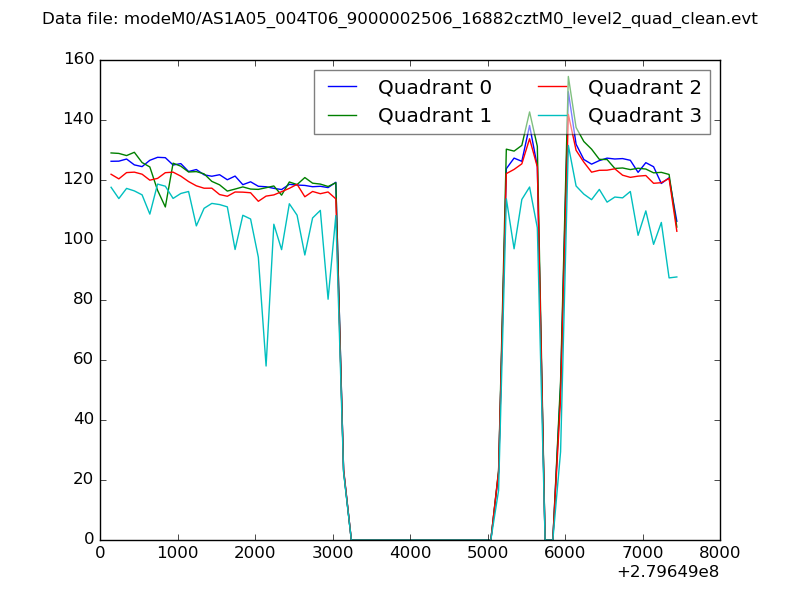 |
|
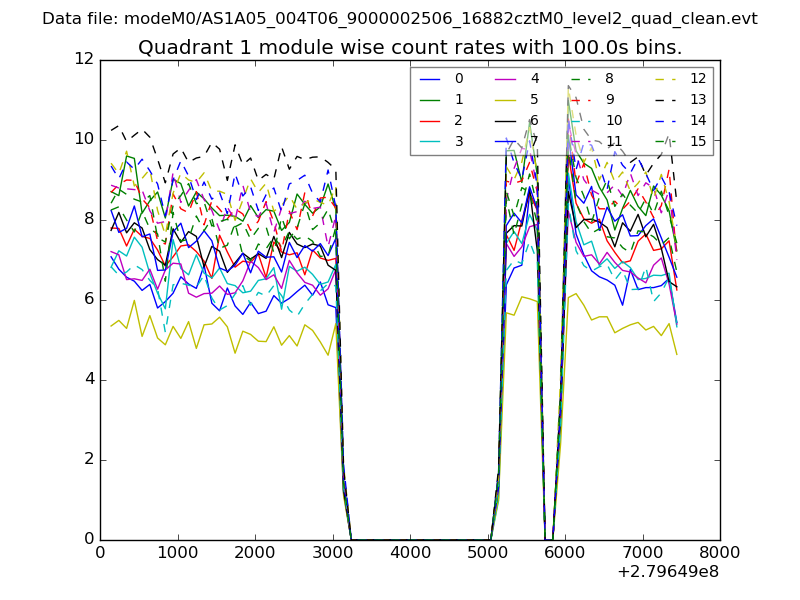
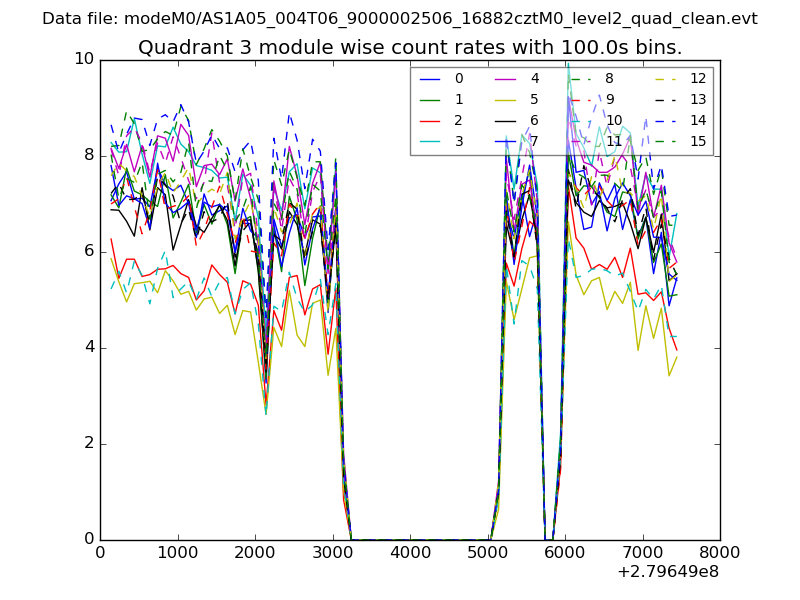
| Module-wise count rates for Quadrant A Data is divided into 100 sec bins |
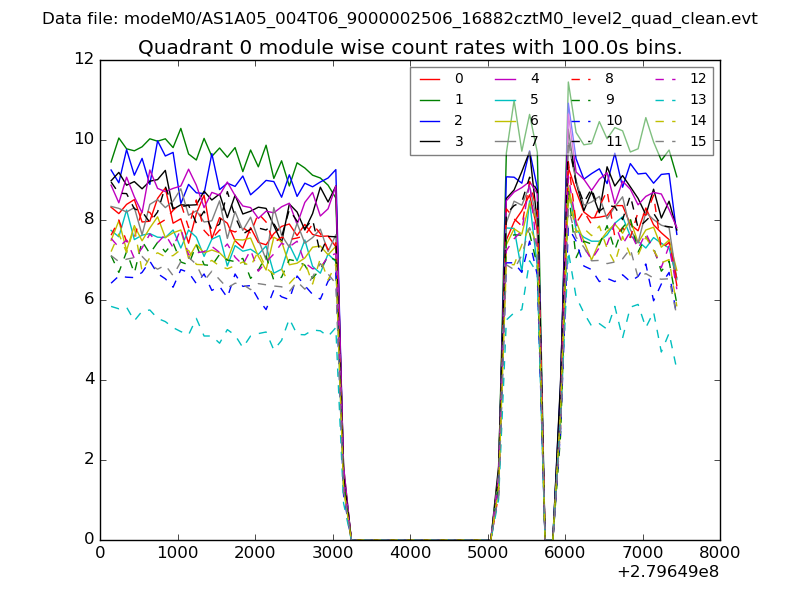 |
 |
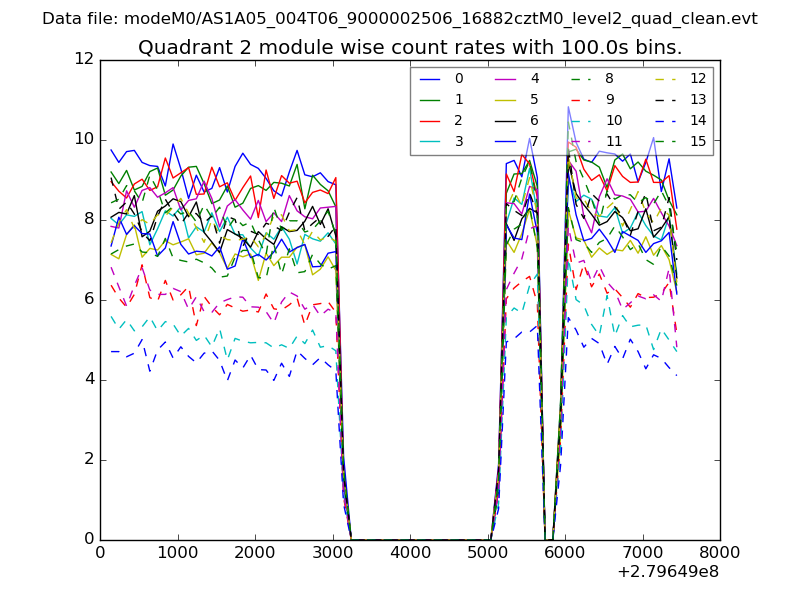
| Module-wise count rates for Quadrant B Data is divided into 100 sec bins |
 |
 |
| Module-wise count rates for Quadrant C Data is divided into 100 sec bins |
 |
 |
| Module-wise count rates for Quadrant D Data is divided into 100 sec bins |
 |
 |
| Parameter | Plot |
|---|---|
| CZT HV Monitor | 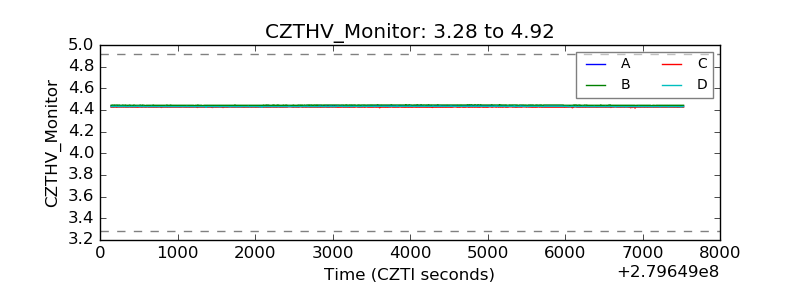 |
| D_VDD |  |
| Temperature 1 | 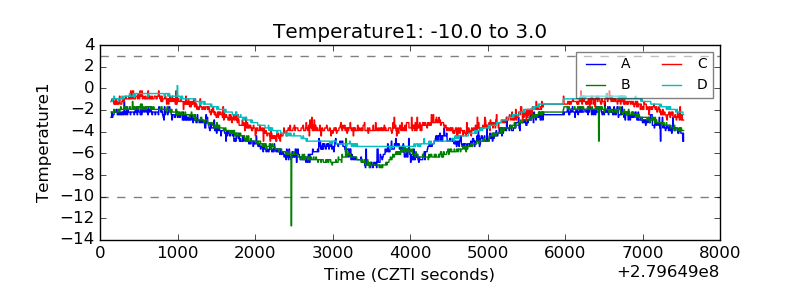 |
| Veto HV Monitor | 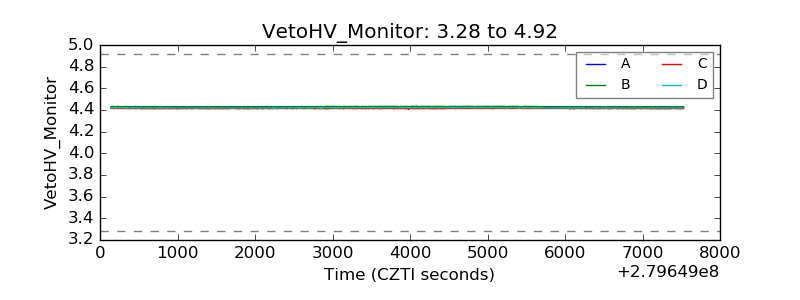 |
| Veto LLD | 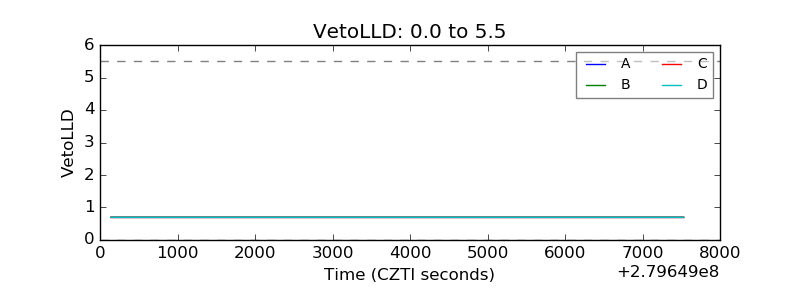 |
| Alpha Counter | 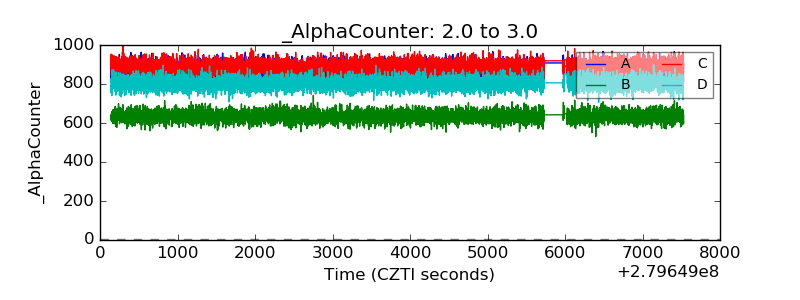 |
| _CPM_Rate | 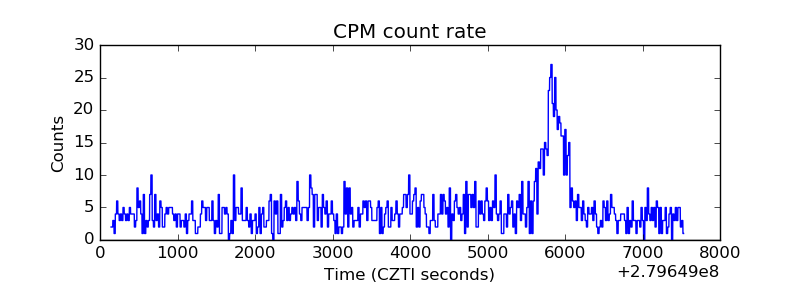 |
| CZT Counter | 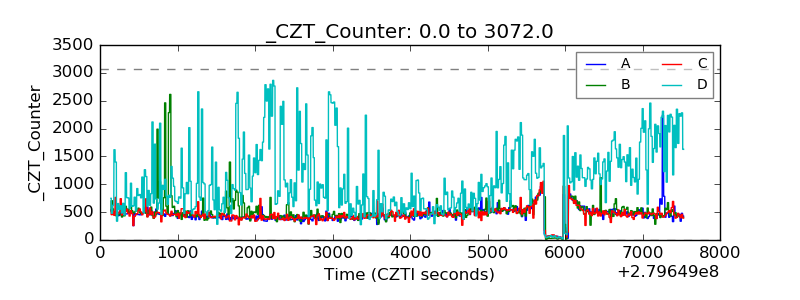 |
| +2.5 Volts monitor |  |
| +5 Volts monitor |  |
| _ROLL_ROT | 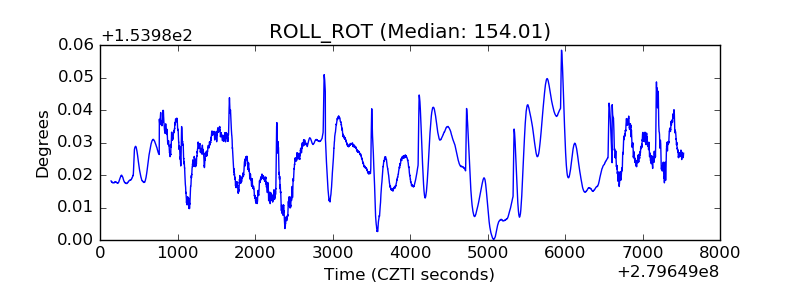 |
| _Roll_DEC | 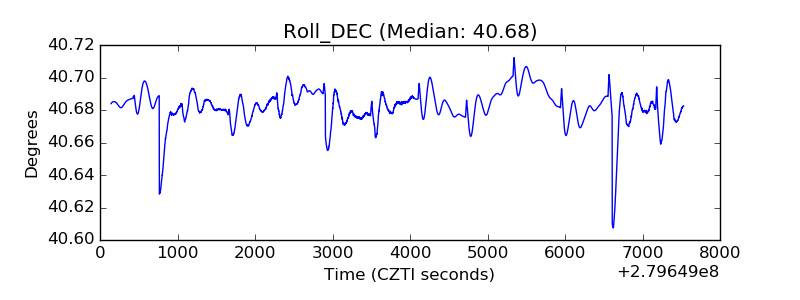 |
| _Roll_RA | 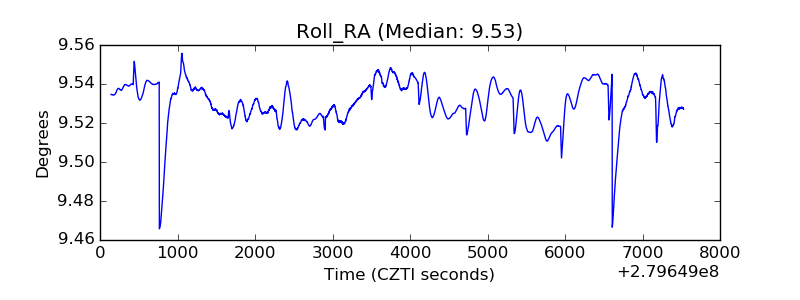 |
| Veto Counter | 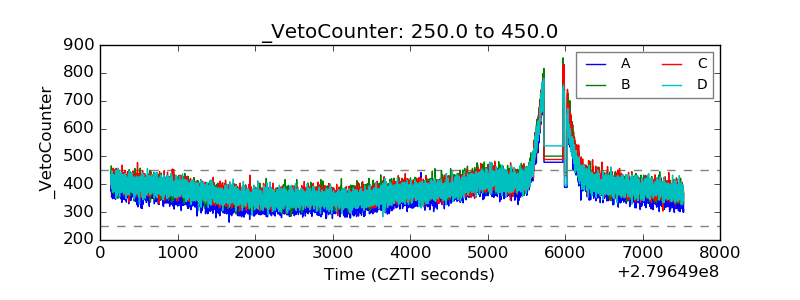 |