| Param | Original file | Final file |
|---|---|---|
| Filename | modeM0/AS1A05_004T06_9000002506_16886cztM0_level2.evt | modeM0/AS1A05_004T06_9000002506_16886cztM0_level2_quad_clean.evt |
| Size (bytes) | 2,627,101,440 | 294,874,560 |
| Size | 2.4 GB | 281.2 MB |
| Events in quadrant A | 12,722,407 | 1,956,678 |
| Events in quadrant B | 12,389,335 | 1,983,910 |
| Events in quadrant C | 11,274,448 | 1,921,115 |
| Events in quadrant D | 41,546,024 | 1,399,504 |
| Mode M9 | |||
|---|---|---|---|
| Quadrant | BADHDUFLAG | Total packets | Discarded packets |
| A | 0 | 28 | 0 |
| B | 0 | 28 | 0 |
| C | 0 | 28 | 0 |
| D | 0 | 28 | 0 |
| Mode SS | |||
|---|---|---|---|
| Quadrant | BADHDUFLAG | Total packets | Discarded packets |
| A | 0 | 500 | 0 |
| B | 0 | 500 | 0 |
| C | 0 | 500 | 0 |
| D | 0 | 500 | 0 |
| Mode M0 | |||
|---|---|---|---|
| Quadrant | BADHDUFLAG | Total packets | Discarded packets |
| A | 0 | 54392 | 8 |
| B | 0 | 52956 | 6 |
| C | 0 | 49718 | 6 |
| D | 0 | 140137 | 6 |
| Quadrant | Total seconds | Saturated seconds | Saturation percentage |
|---|---|---|---|
| A | 24199 | 614 | 2.537295% |
| B | 24199 | 381 | 1.574445% |
| C | 24199 | 304 | 1.256250% |
| D | 24199 | 11132 | 46.001901% |
Noise dominated data is calculated using 1-second bins in cleaned event files. If a bin has >2000 counts, and if more than 50% of those come from <1% of pixels, then it is considered to be noise-dominated and hence unusable.
| Quadrant | # 1 sec bins | Bins with >0 counts | Bins with >2000 counts | High rate bins dominated by noise | Noise dominated (total time) | Noise dominated (detector-on time) | Marked lightcurve |
|---|---|---|---|---|---|---|---|
| A | 27252 | 24207 | 315 | 315 | 1.16% | 1.30% | 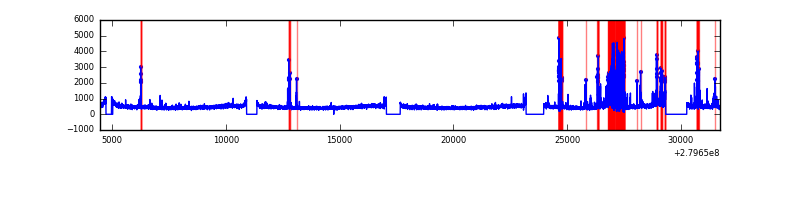 |
| B | 27252 | 24207 | 101 | 101 | 0.37% | 0.42% | 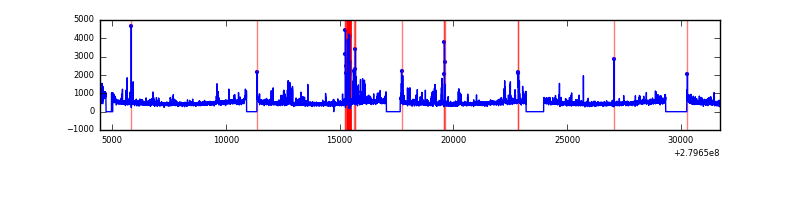 |
| C | 27252 | 24207 | 3 | 3 | 0.01% | 0.01% | 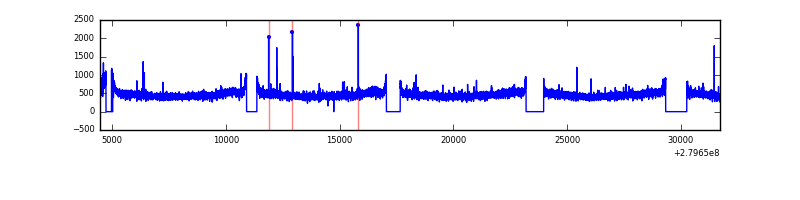 |
| D | 27251 | 24204 | 8914 | 8914 | 32.71% | 36.83% | 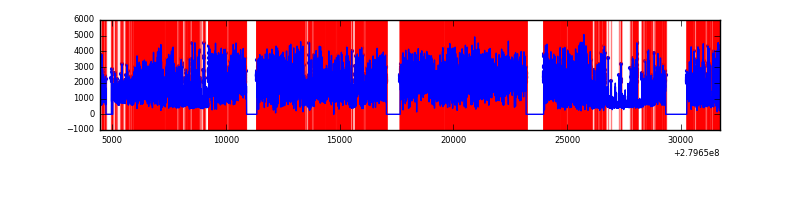 |
Top three noisy pixels from each quadrant. If the there are fewer than three noisy pixels in the level2.evt file, extra rows are filled as -1
| Pixel properties | Quadrant properties | ||||||
|---|---|---|---|---|---|---|---|
| Quadrant | DetID | PixID | Counts | Sigma | Mean | Median | Sigma |
| A | 15 | 174 | 1704726 | 2986.02 | 2841 | 2777 | 570.0 |
| A | 0 | 23 | 58255 | 97.33 | 2841 | 2777 | 570.0 |
| A | 9 | 143 | 36382 | 58.96 | 2841 | 2777 | 570.0 |
| B | 10 | 16 | 510479 | 933.82 | 2843 | 2765 | 543.7 |
| B | 15 | 35 | 493206 | 902.05 | 2843 | 2765 | 543.7 |
| B | 0 | 229 | 87012 | 154.95 | 2843 | 2765 | 543.7 |
| C | 14 | 238 | 423465 | 656.42 | 2753 | 2772 | 640.9 |
| C | 3 | 233 | 72708 | 109.12 | 2753 | 2772 | 640.9 |
| C | 5 | 112 | 34474 | 49.47 | 2753 | 2772 | 640.9 |
| D | 1 | 52 | 32833615 | 61905.57 | 2185 | 2122 | 530.3 |
| D | 10 | 70 | 304745 | 570.61 | 2185 | 2122 | 530.3 |
| D | 2 | 234 | 92976 | 171.31 | 2185 | 2122 | 530.3 |
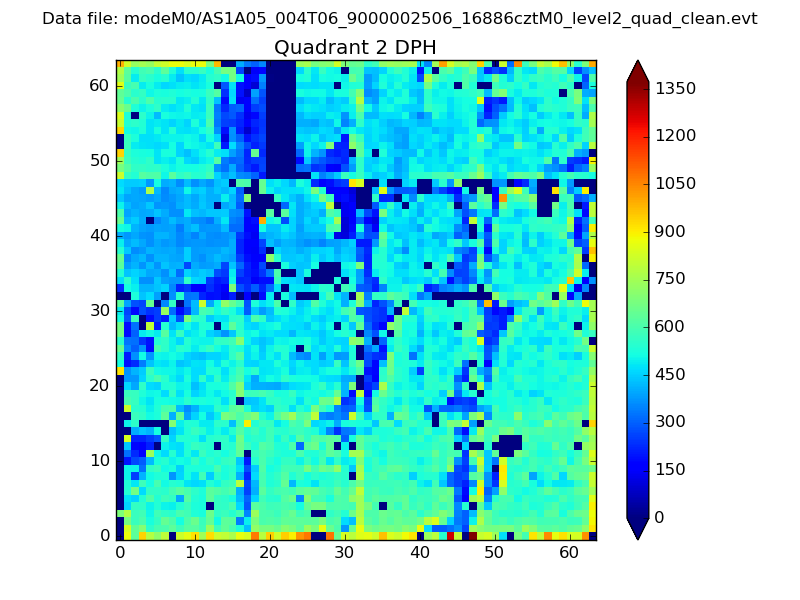
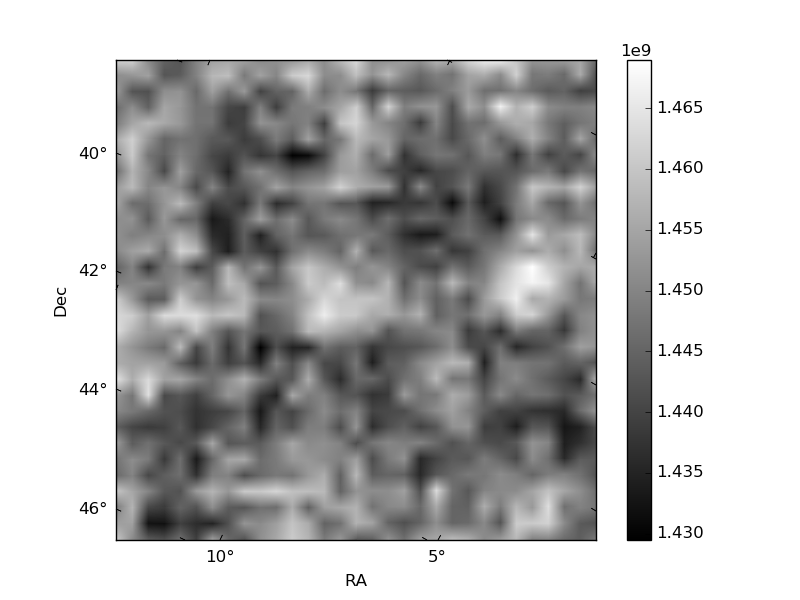
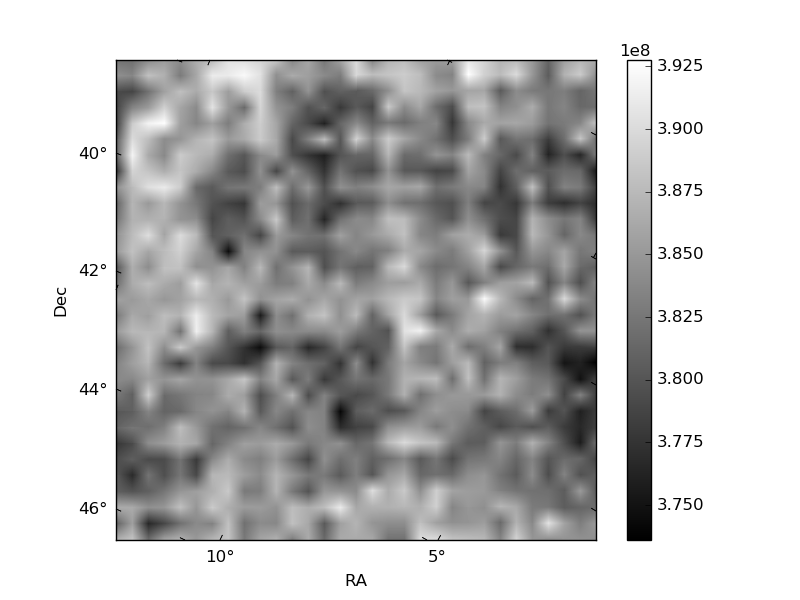
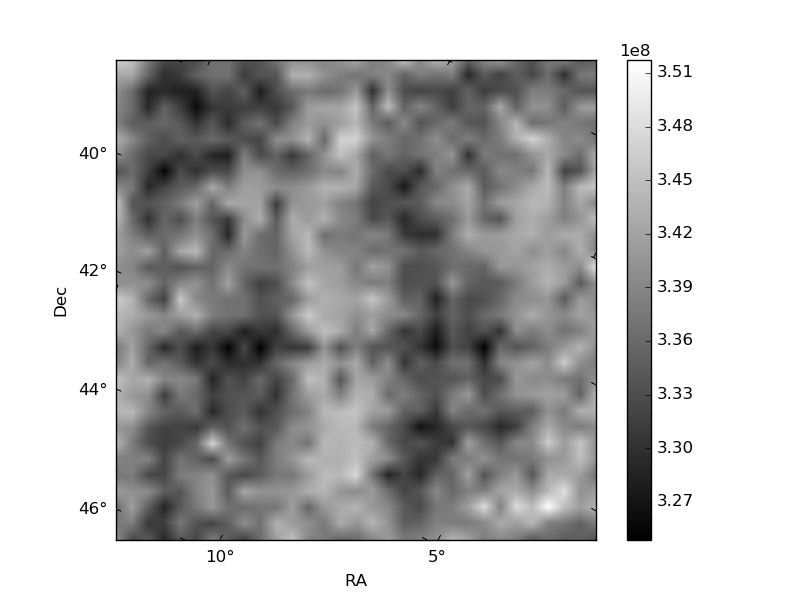
Histogram calculated using DETX and DETY for each event in the final _common_clean file
| Quadrant A | 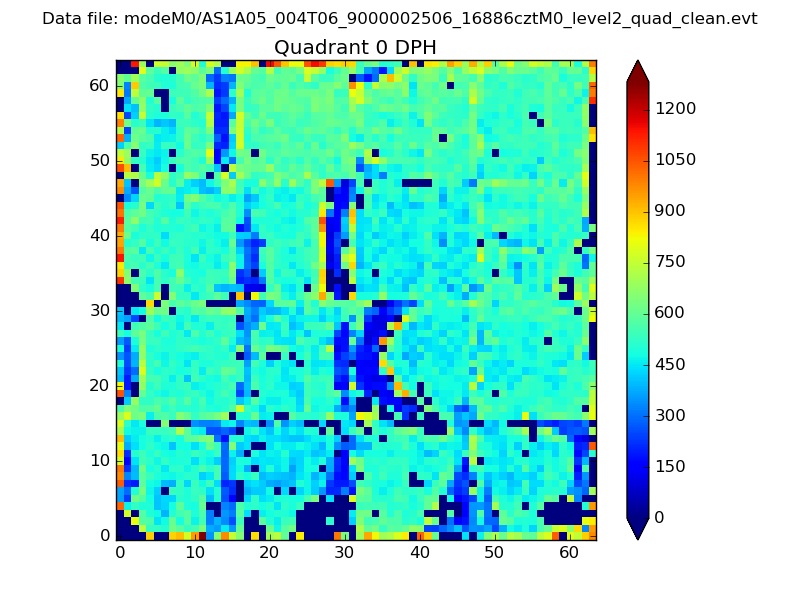 |
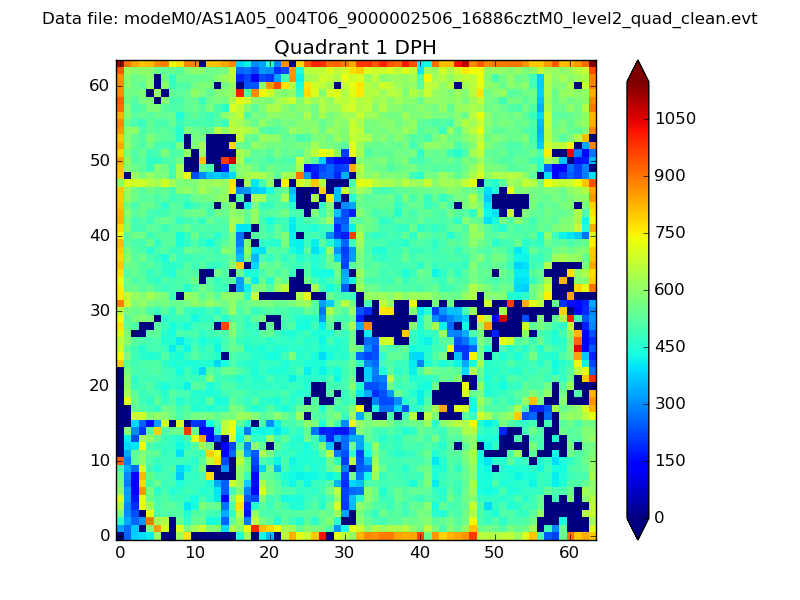 |
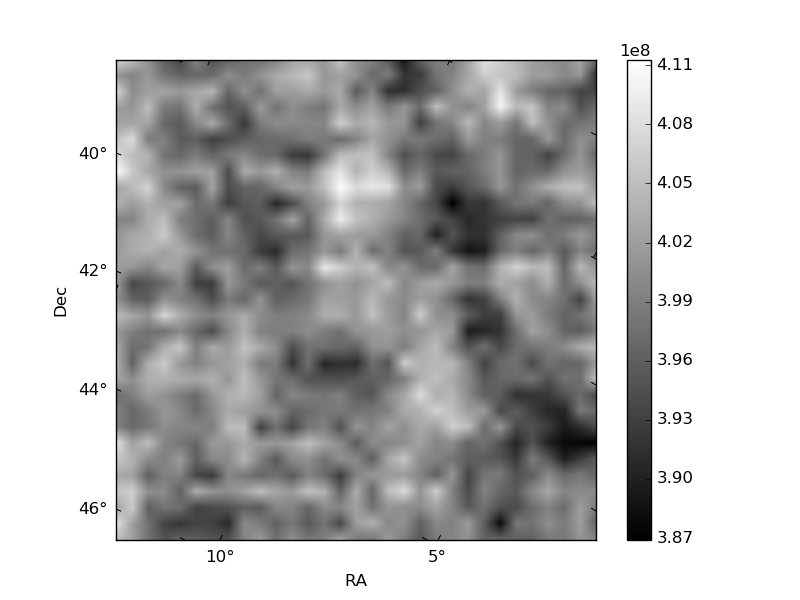
Quadrant B |
|---|---|---|---|
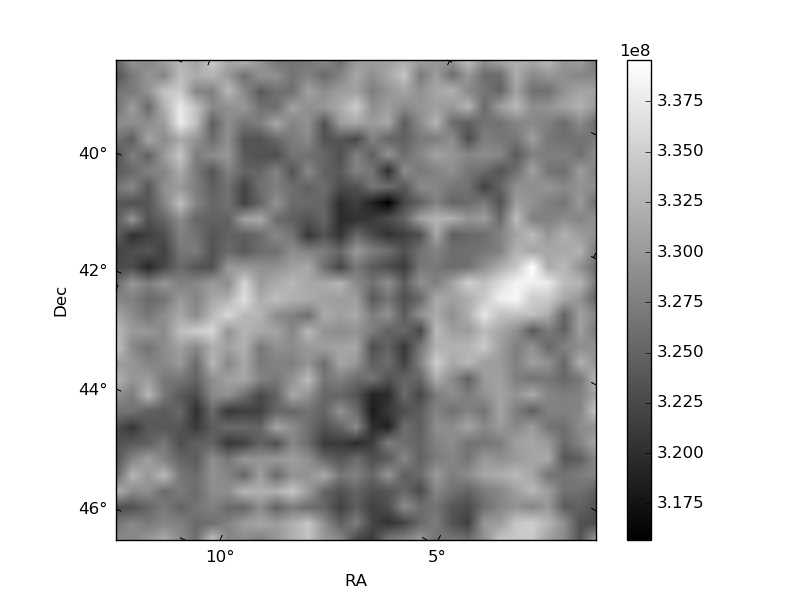
| Quadrant D | 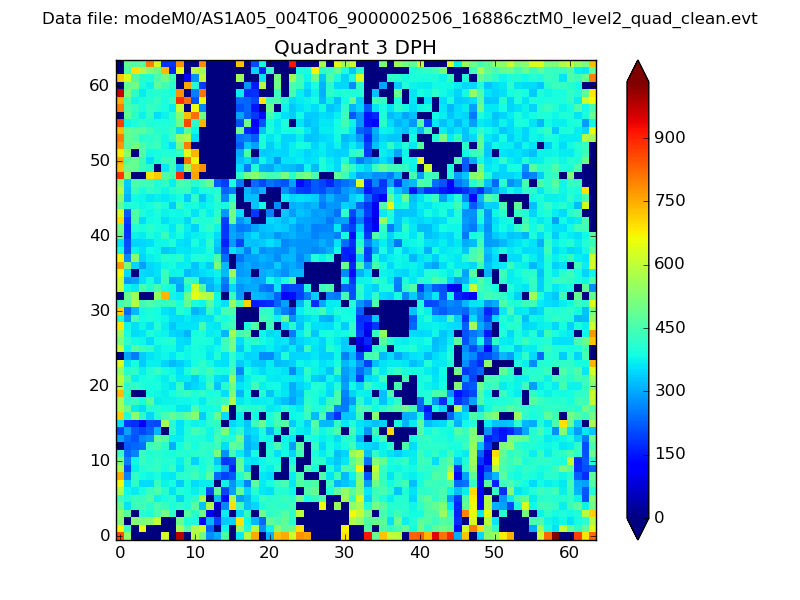 |
 |
Quadrant C |
| Plot type | Count rate plots | Images |
|---|---|---|
| Comparison with Poisson distribution Blue bars denote a histogram of data divided into 1 sec bins. Red curve is a Poisson curve with rate = median count rate of data. |
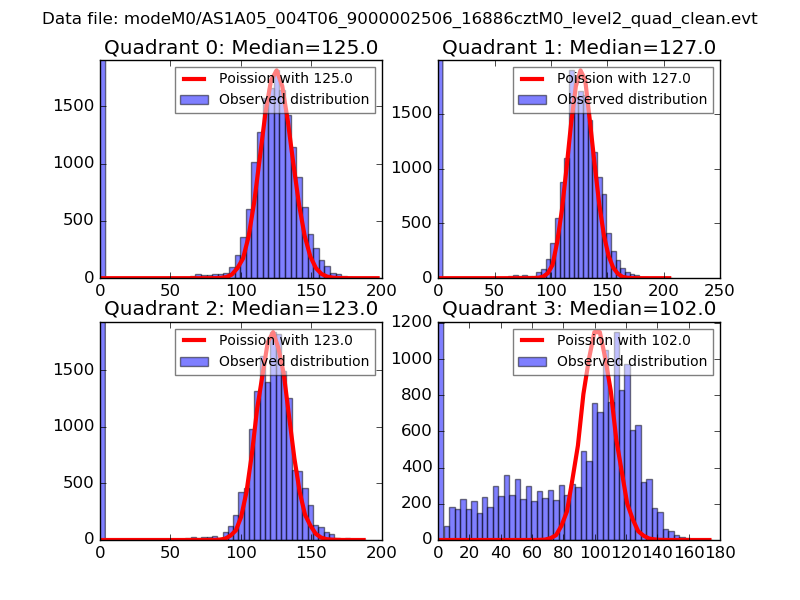 |
 |
| Quadrant-wise count rates Data is divided into 100 sec bins |
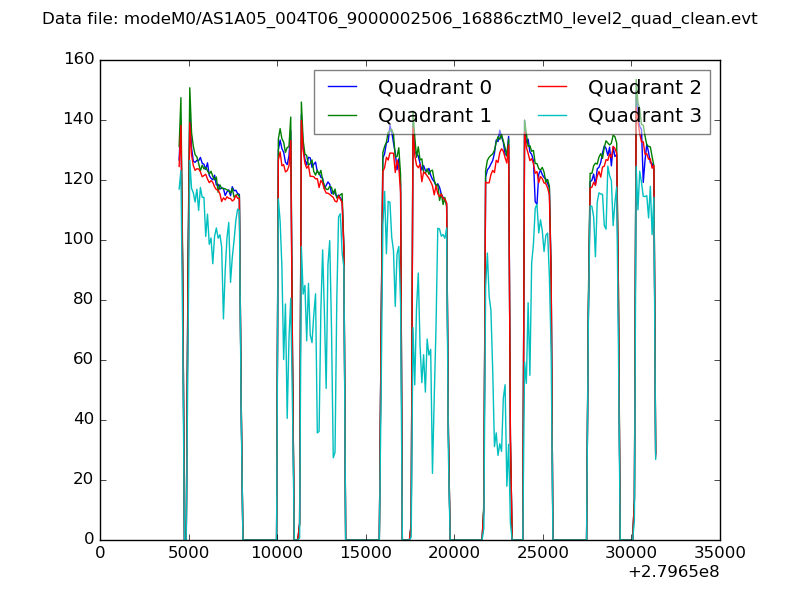 |
|
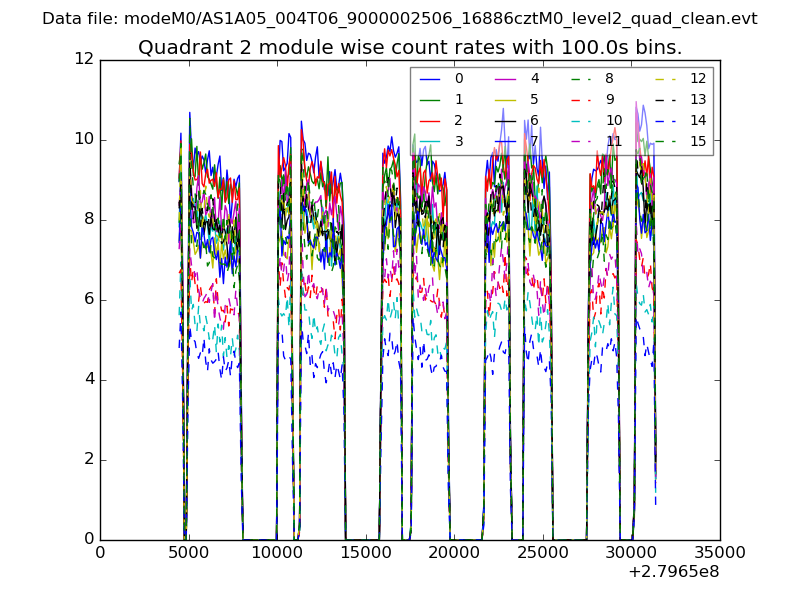
| Module-wise count rates for Quadrant A Data is divided into 100 sec bins |
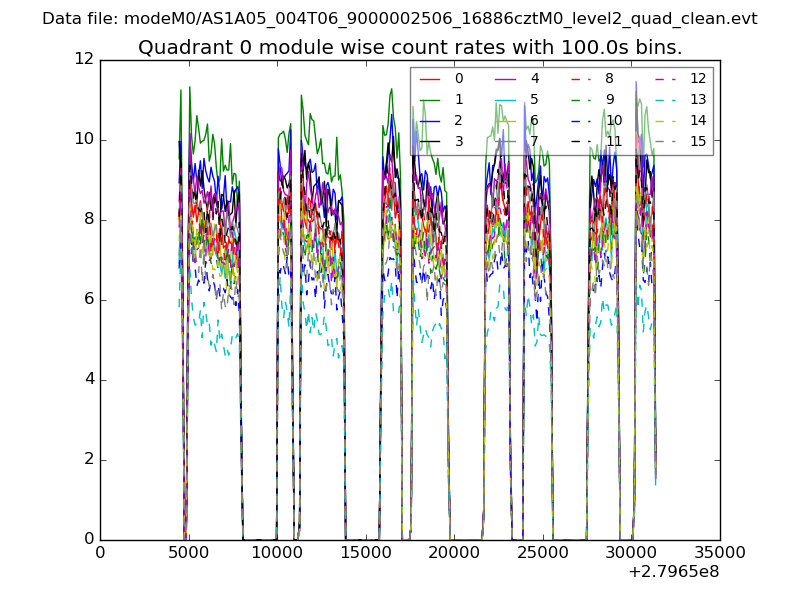 |
 |
| Module-wise count rates for Quadrant B Data is divided into 100 sec bins |
 |
 |
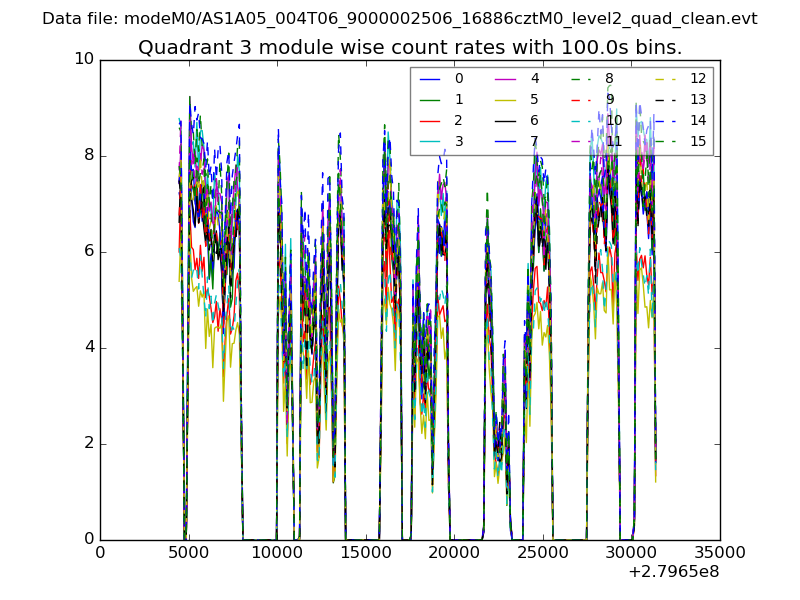
| Module-wise count rates for Quadrant C Data is divided into 100 sec bins |
 |
 |
| Module-wise count rates for Quadrant D Data is divided into 100 sec bins |
 |
 |
| Parameter | Plot |
|---|---|
| CZT HV Monitor |  |
| D_VDD | 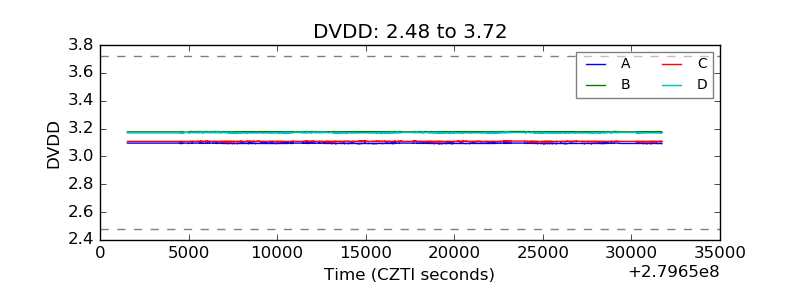 |
| Temperature 1 | 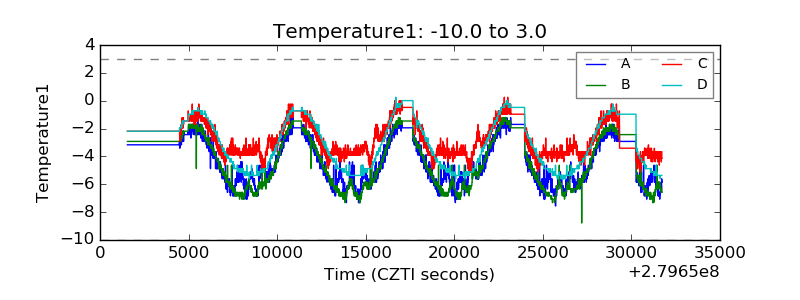 |
| Veto HV Monitor | 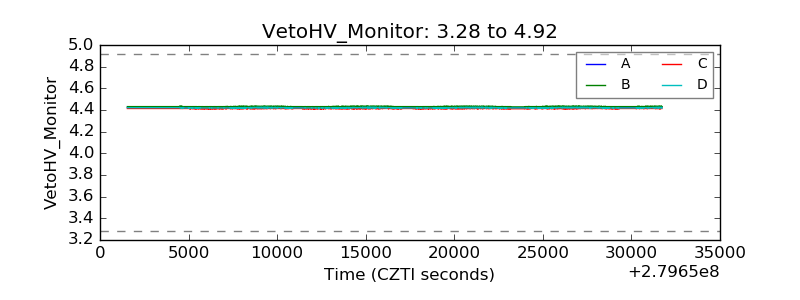 |
| Veto LLD |  |
| Alpha Counter | 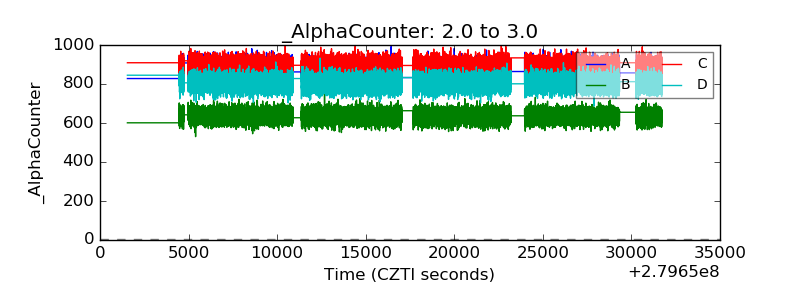 |
| _CPM_Rate | 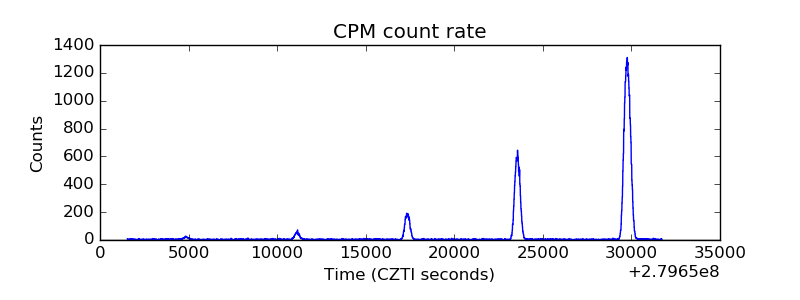 |
| CZT Counter | 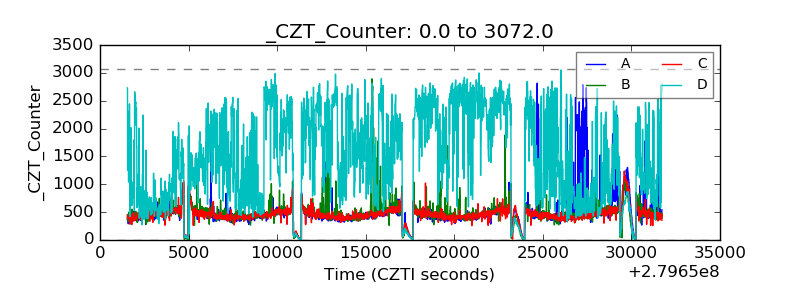 |
| +2.5 Volts monitor |  |
| +5 Volts monitor |  |
| _ROLL_ROT | 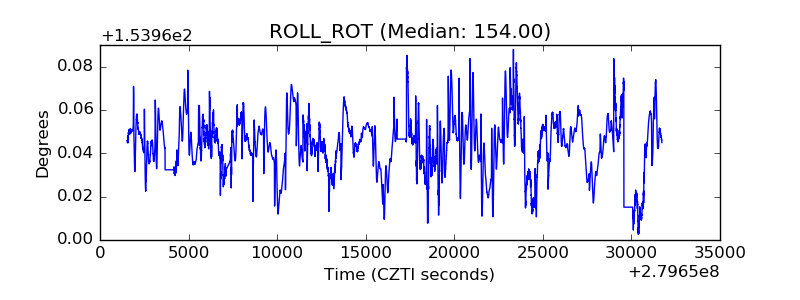 |
| _Roll_DEC | 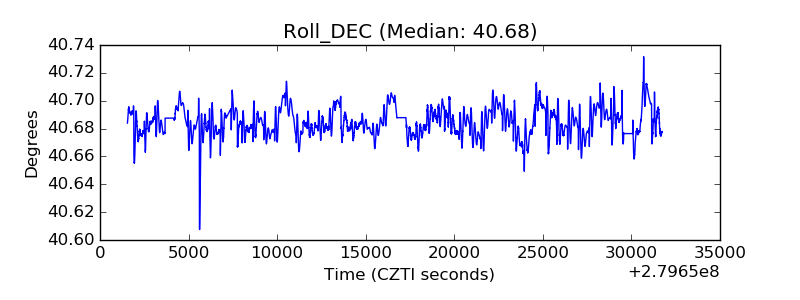 |
| _Roll_RA | 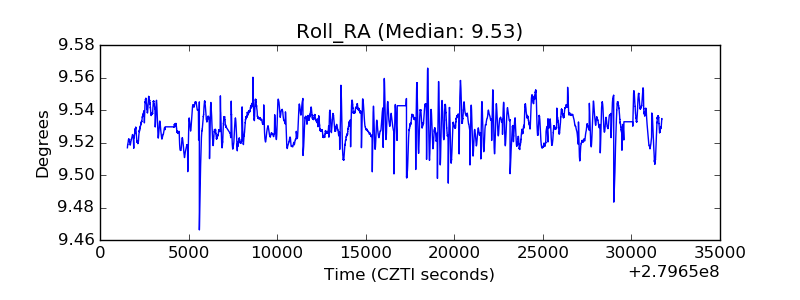 |
| Veto Counter | 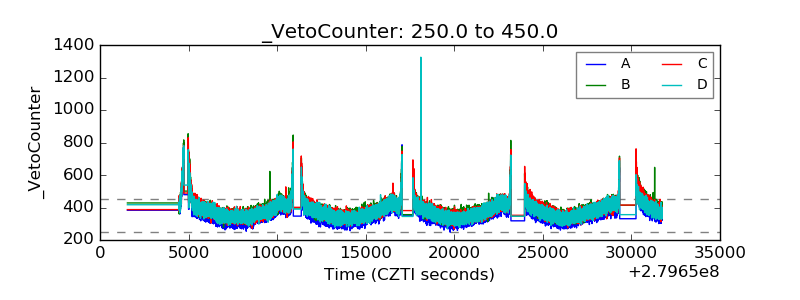 |