| Param | Original file | Final file |
|---|---|---|
| Filename | modeM0/AS1A05_004T06_9000002506_16887cztM0_level2.evt | modeM0/AS1A05_004T06_9000002506_16887cztM0_level2_quad_clean.evt |
| Size (bytes) | 615,844,800 | 47,652,480 |
| Size | 587.3 MB | 45.4 MB |
| Events in quadrant A | 4,311,581 | 258,786 |
| Events in quadrant B | 3,052,506 | 267,703 |
| Events in quadrant C | 2,907,209 | 256,692 |
| Events in quadrant D | 7,961,007 | 227,030 |
| Mode M9 | |||
|---|---|---|---|
| Quadrant | BADHDUFLAG | Total packets | Discarded packets |
| A | 0 | 11 | 0 |
| B | 0 | 11 | 0 |
| C | 0 | 11 | 0 |
| D | 0 | 11 | 0 |
| Mode SS | |||
|---|---|---|---|
| Quadrant | BADHDUFLAG | Total packets | Discarded packets |
| A | 0 | 124 | 0 |
| B | 0 | 124 | 0 |
| C | 0 | 124 | 0 |
| D | 0 | 124 | 0 |
| Mode M0 | |||
|---|---|---|---|
| Quadrant | BADHDUFLAG | Total packets | Discarded packets |
| A | 0 | 16855 | 2 |
| B | 0 | 12968 | 1 |
| C | 0 | 12653 | 1 |
| D | 0 | 27940 | 1 |
| Quadrant | Total seconds | Saturated seconds | Saturation percentage |
|---|---|---|---|
| A | 6192 | 219 | 3.536822% |
| B | 6192 | 32 | 0.516796% |
| C | 6192 | 46 | 0.742894% |
| D | 6192 | 1572 | 25.387597% |
Noise dominated data is calculated using 1-second bins in cleaned event files. If a bin has >2000 counts, and if more than 50% of those come from <1% of pixels, then it is considered to be noise-dominated and hence unusable.
| Quadrant | # 1 sec bins | Bins with >0 counts | Bins with >2000 counts | High rate bins dominated by noise | Noise dominated (total time) | Noise dominated (detector-on time) | Marked lightcurve |
|---|---|---|---|---|---|---|---|
| A | 7268 | 6194 | 102 | 102 | 1.40% | 1.65% |  |
| B | 7268 | 6194 | 0 | 0 | 0.00% | 0.00% | 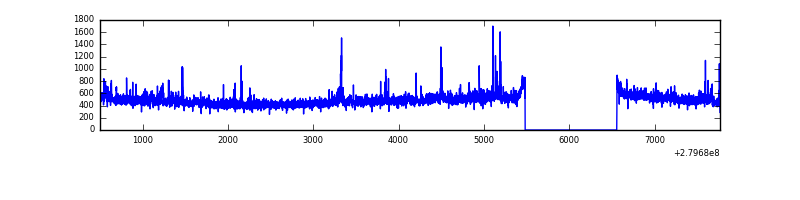 |
| C | 7268 | 6194 | 0 | 0 | 0.00% | 0.00% | 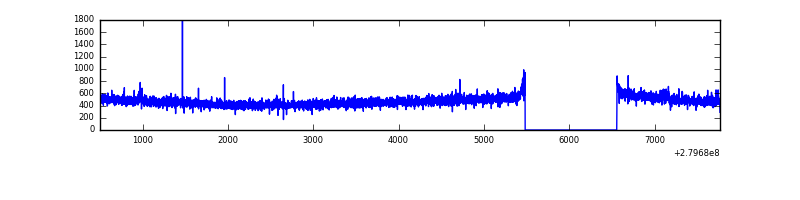 |
| D | 7268 | 6194 | 1208 | 1208 | 16.62% | 19.50% | 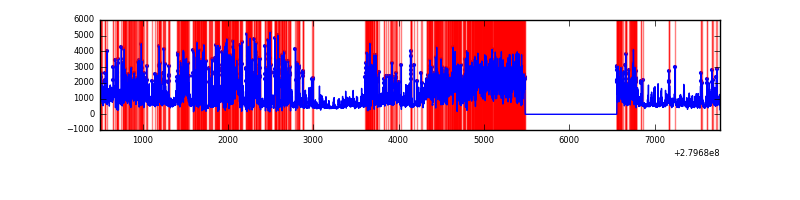 |
Top three noisy pixels from each quadrant. If the there are fewer than three noisy pixels in the level2.evt file, extra rows are filled as -1
| Pixel properties | Quadrant properties | ||||||
|---|---|---|---|---|---|---|---|
| Quadrant | DetID | PixID | Counts | Sigma | Mean | Median | Sigma |
| A | 15 | 174 | 1466771 | 9960.37 | 730 | 714 | 147.2 |
| A | 9 | 143 | 15396 | 99.75 | 730 | 714 | 147.2 |
| A | 4 | 2 | 14410 | 93.05 | 730 | 714 | 147.2 |
| B | 0 | 229 | 49837 | 346.99 | 740 | 721 | 141.6 |
| B | 10 | 16 | 44565 | 309.74 | 740 | 721 | 141.6 |
| B | 15 | 35 | 21840 | 149.2 | 740 | 721 | 141.6 |
| C | 14 | 238 | 109877 | 657.93 | 711 | 716 | 165.9 |
| C | 3 | 233 | 12621 | 71.75 | 711 | 716 | 165.9 |
| C | 14 | 225 | 7663 | 41.87 | 711 | 716 | 165.9 |
| D | 1 | 52 | 5482232 | 35572.39 | 629 | 610 | 154.1 |
| D | 13 | 112 | 68680 | 441.73 | 629 | 610 | 154.1 |
| D | 2 | 234 | 27735 | 176.02 | 629 | 610 | 154.1 |
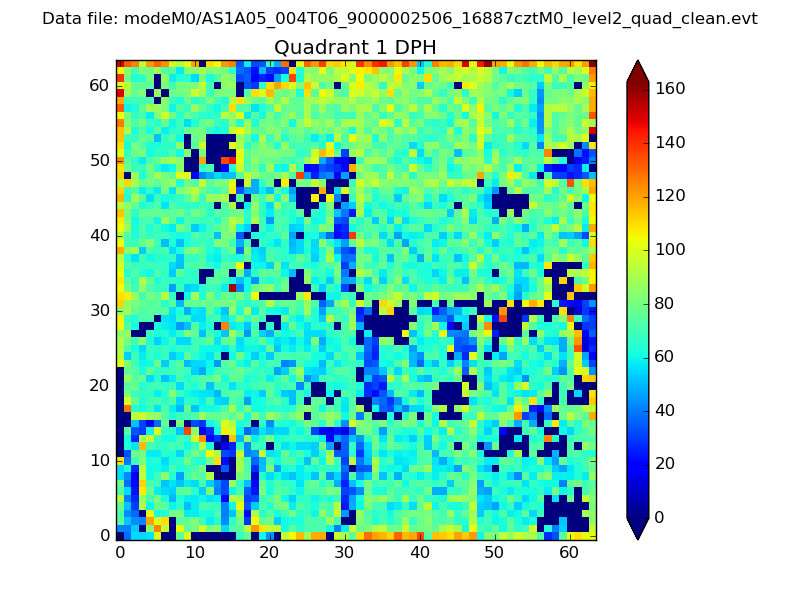
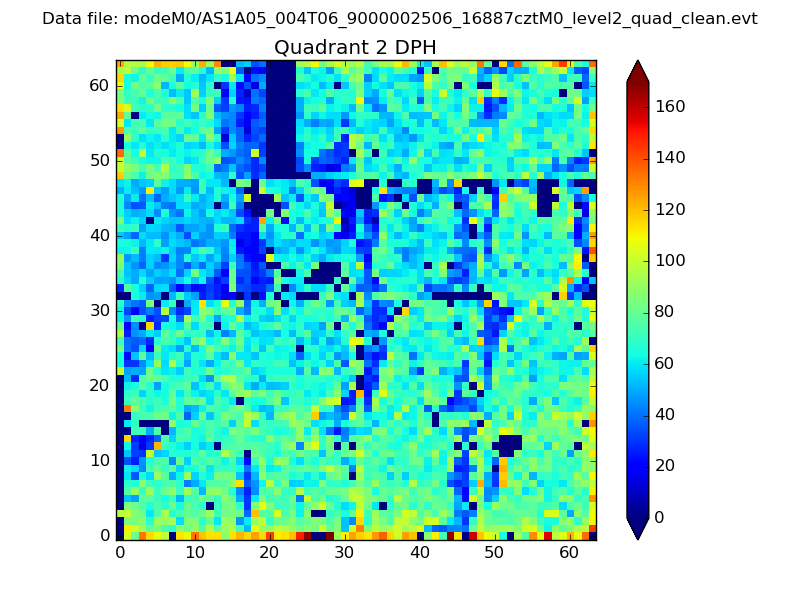
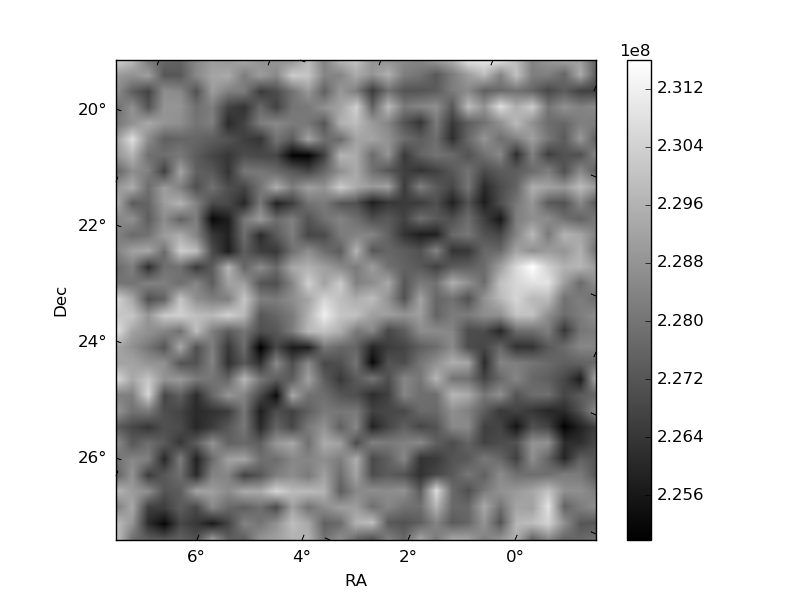
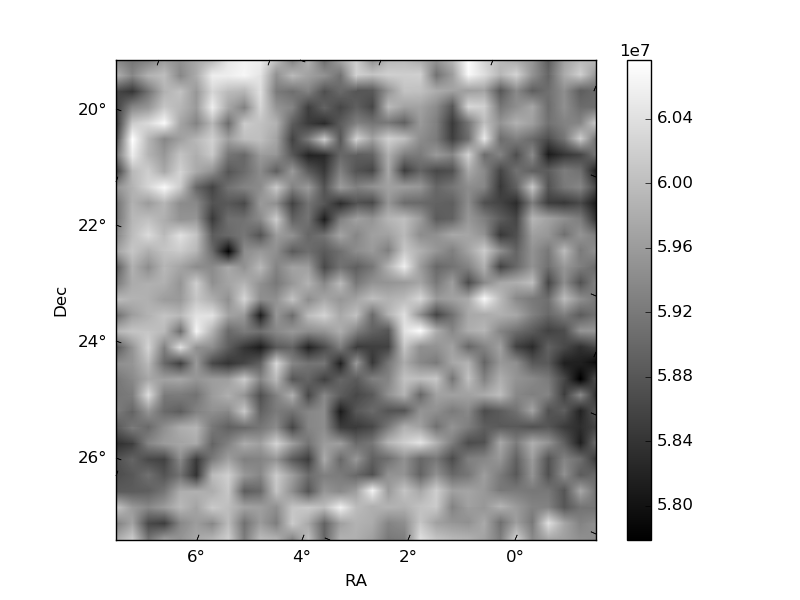
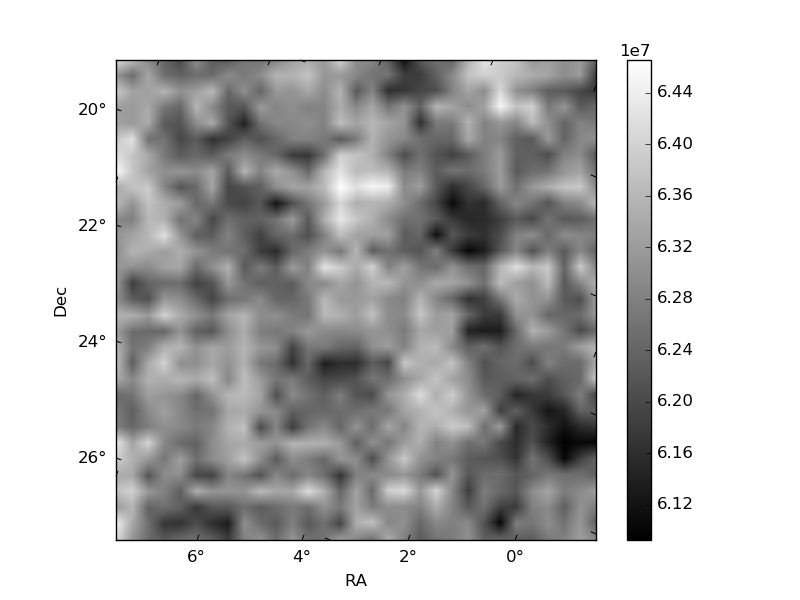
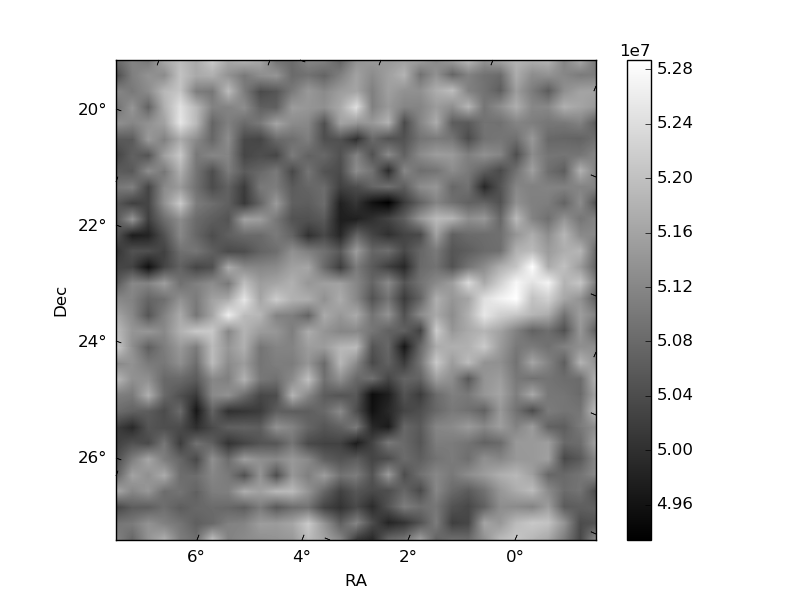
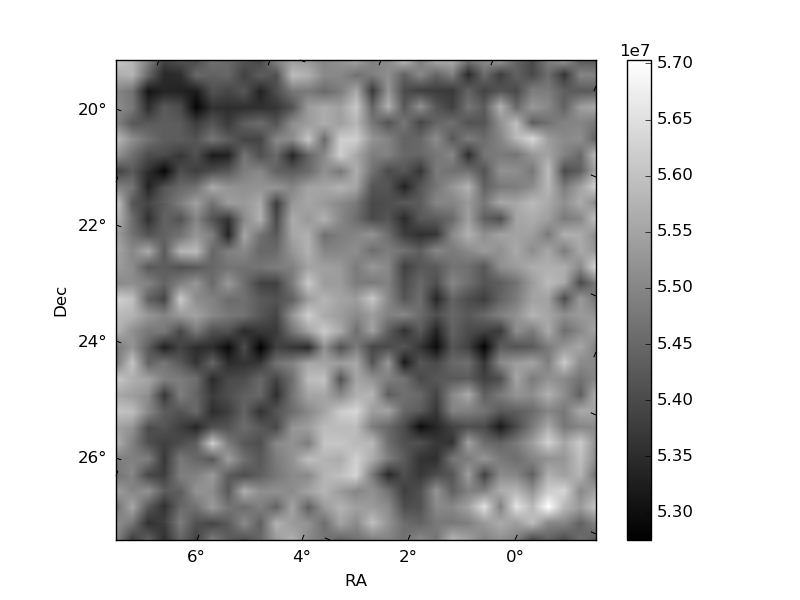
Histogram calculated using DETX and DETY for each event in the final _common_clean file
| Quadrant A | 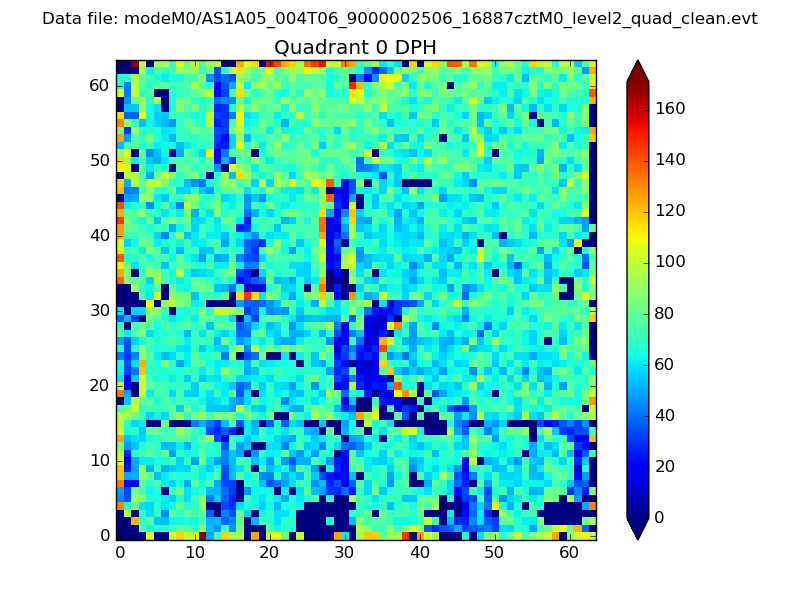 |
 |
Quadrant B |
|---|---|---|---|
| Quadrant D | 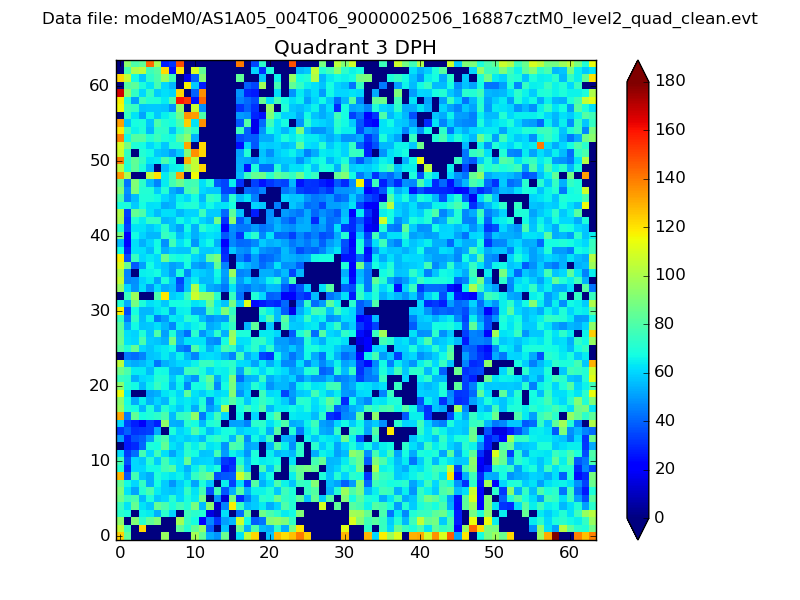 |
 |
Quadrant C |
| Plot type | Count rate plots | Images |
|---|---|---|
| Comparison with Poisson distribution Blue bars denote a histogram of data divided into 1 sec bins. Red curve is a Poisson curve with rate = median count rate of data. |
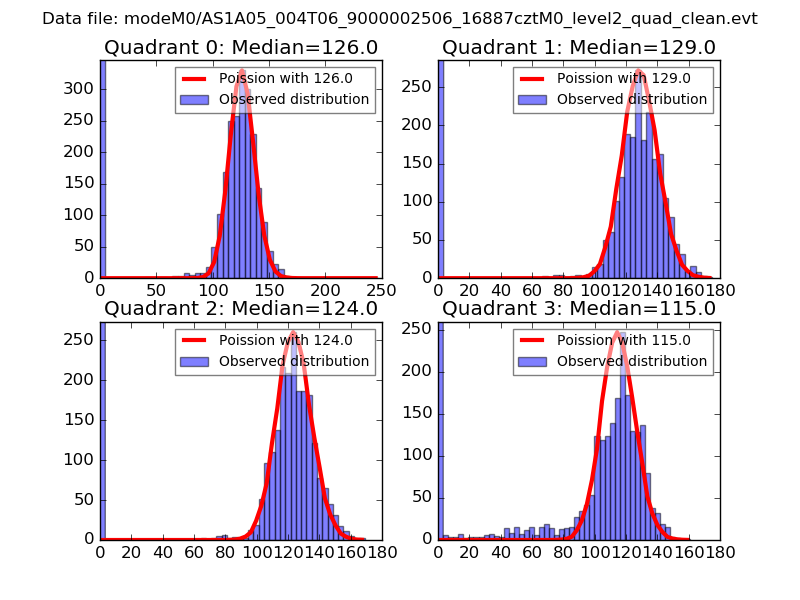 |
 |
| Quadrant-wise count rates Data is divided into 100 sec bins |
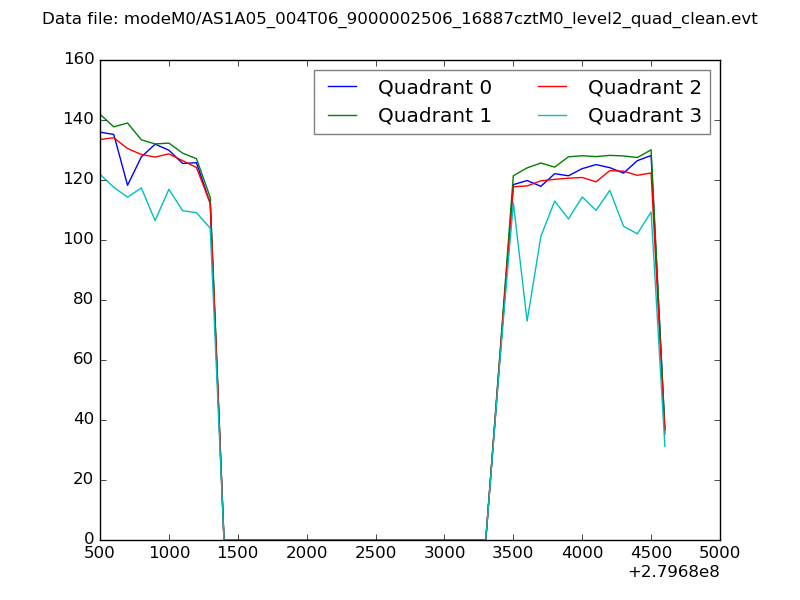 |
|
| Module-wise count rates for Quadrant A Data is divided into 100 sec bins |
 |
 |
| Module-wise count rates for Quadrant B Data is divided into 100 sec bins |
 |
 |
| Module-wise count rates for Quadrant C Data is divided into 100 sec bins |
 |
 |
| Module-wise count rates for Quadrant D Data is divided into 100 sec bins |
 |
 |
| Parameter | Plot |
|---|---|
| CZT HV Monitor | 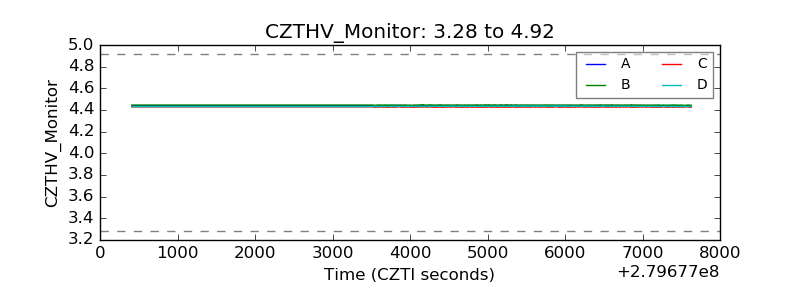 |
| D_VDD | 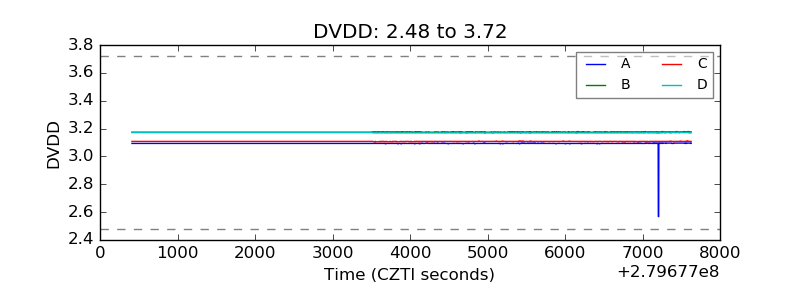 |
| Temperature 1 | 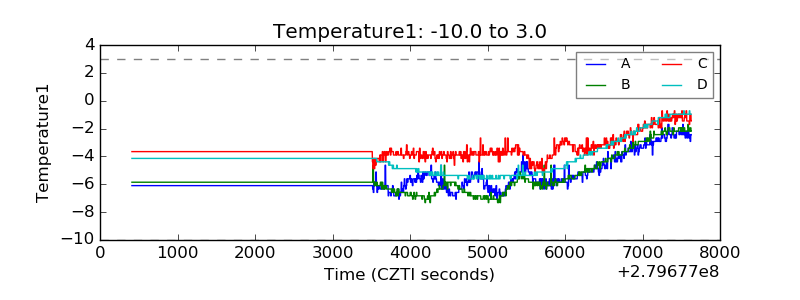 |
| Veto HV Monitor | 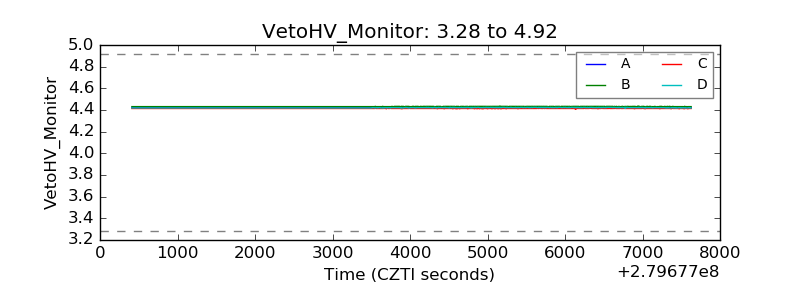 |
| Veto LLD |  |
| Alpha Counter | 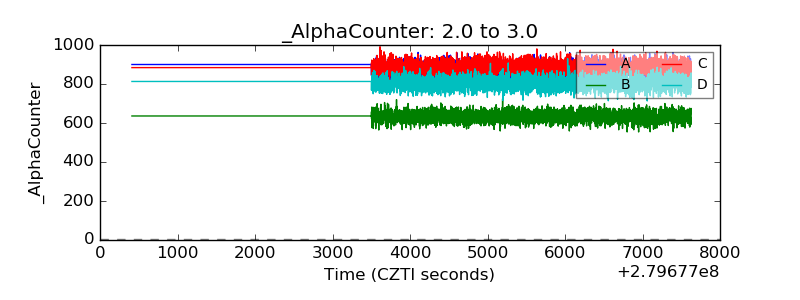 |
| _CPM_Rate | 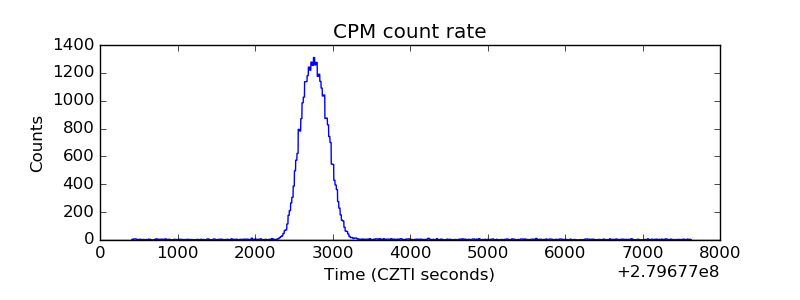 |
| CZT Counter | 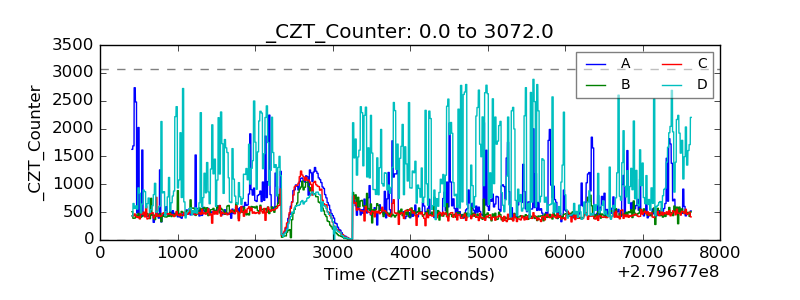 |
| +2.5 Volts monitor |  |
| +5 Volts monitor |  |
| _ROLL_ROT |  |
| _Roll_DEC | 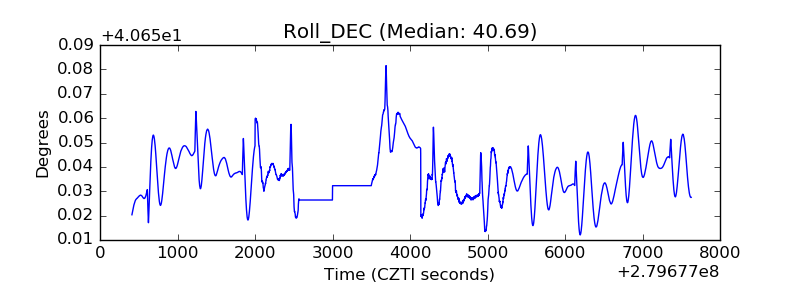 |
| _Roll_RA | 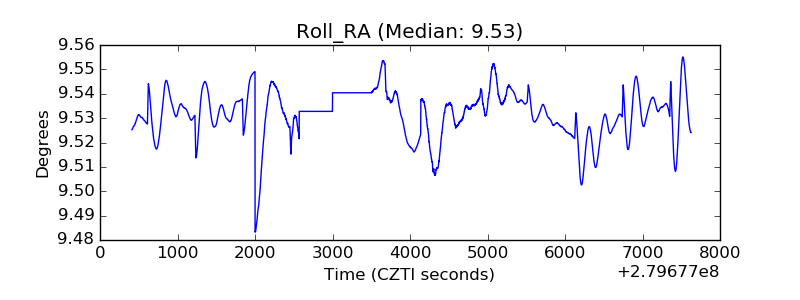 |
| Veto Counter |  |