| Param | Original file | Final file |
|---|---|---|
| Filename | modeM0/AS1A05_004T06_9000002506_16889cztM0_level2.evt | modeM0/AS1A05_004T06_9000002506_16889cztM0_level2_quad_clean.evt |
| Size (bytes) | 578,606,400 | 71,173,440 |
| Size | 551.8 MB | 67.9 MB |
| Events in quadrant A | 4,345,734 | 449,295 |
| Events in quadrant B | 3,340,495 | 460,126 |
| Events in quadrant C | 3,171,358 | 436,938 |
| Events in quadrant D | 6,227,224 | 357,086 |
| Mode M9 | |||
|---|---|---|---|
| Quadrant | BADHDUFLAG | Total packets | Discarded packets |
| A | 0 | 14 | 0 |
| B | 0 | 14 | 0 |
| C | 0 | 14 | 0 |
| D | 0 | 15 | 0 |
| Mode SS | |||
|---|---|---|---|
| Quadrant | BADHDUFLAG | Total packets | Discarded packets |
| A | 0 | 132 | 0 |
| B | 0 | 132 | 0 |
| C | 0 | 132 | 0 |
| D | 0 | 132 | 0 |
| Mode M0 | |||
|---|---|---|---|
| Quadrant | BADHDUFLAG | Total packets | Discarded packets |
| A | 0 | 17100 | 3 |
| B | 0 | 13955 | 2 |
| C | 0 | 13426 | 2 |
| D | 0 | 22857 | 2 |
| Quadrant | Total seconds | Saturated seconds | Saturation percentage |
|---|---|---|---|
| A | 6466 | 145 | 2.242499% |
| B | 6466 | 29 | 0.448500% |
| C | 6466 | 33 | 0.510362% |
| D | 6466 | 1149 | 17.769873% |
Noise dominated data is calculated using 1-second bins in cleaned event files. If a bin has >2000 counts, and if more than 50% of those come from <1% of pixels, then it is considered to be noise-dominated and hence unusable.
| Quadrant | # 1 sec bins | Bins with >0 counts | Bins with >2000 counts | High rate bins dominated by noise | Noise dominated (total time) | Noise dominated (detector-on time) | Marked lightcurve |
|---|---|---|---|---|---|---|---|
| A | 7677 | 6468 | 90 | 90 | 1.17% | 1.39% | 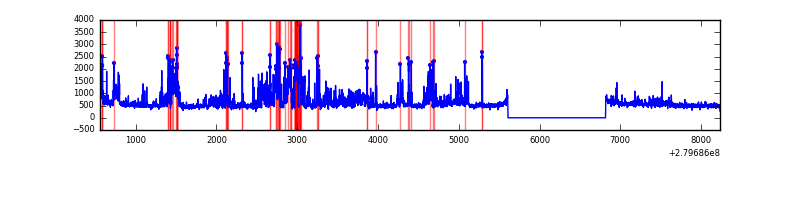 |
| B | 7677 | 6468 | 0 | 0 | 0.00% | 0.00% | 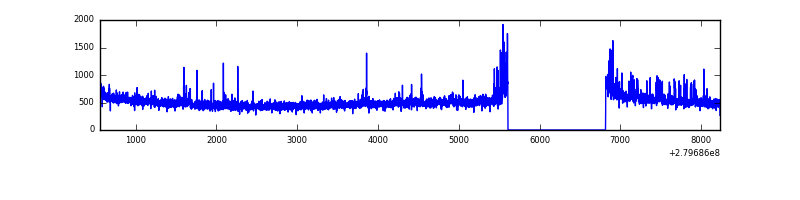 |
| C | 7677 | 6468 | 1 | 1 | 0.01% | 0.02% | 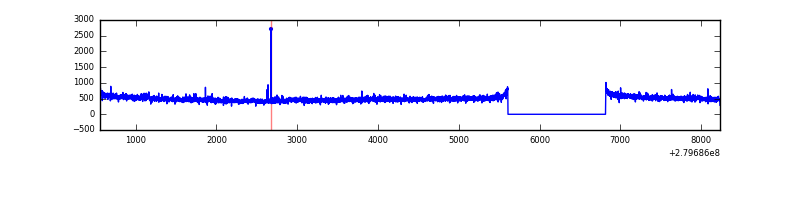 |
| D | 7677 | 6468 | 649 | 649 | 8.45% | 10.03% | 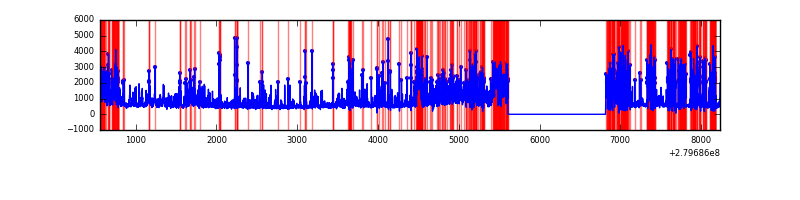 |
Top three noisy pixels from each quadrant. If the there are fewer than three noisy pixels in the level2.evt file, extra rows are filled as -1
| Pixel properties | Quadrant properties | ||||||
|---|---|---|---|---|---|---|---|
| Quadrant | DetID | PixID | Counts | Sigma | Mean | Median | Sigma |
| A | 15 | 174 | 1267966 | 7902.08 | 799 | 783 | 160.4 |
| A | 9 | 143 | 7346 | 40.93 | 799 | 783 | 160.4 |
| A | 0 | 226 | 6922 | 38.28 | 799 | 783 | 160.4 |
| B | 0 | 219 | 77585 | 503.2 | 807 | 791 | 152.6 |
| B | 15 | 35 | 64209 | 415.55 | 807 | 791 | 152.6 |
| B | 10 | 16 | 20069 | 126.32 | 807 | 791 | 152.6 |
| C | 14 | 238 | 120463 | 670.81 | 771 | 776 | 178.4 |
| C | 3 | 233 | 26805 | 145.88 | 771 | 776 | 178.4 |
| C | 14 | 225 | 11141 | 58.09 | 771 | 776 | 178.4 |
| D | 1 | 52 | 3522685 | 21283.38 | 677 | 659 | 165.5 |
| D | 2 | 33 | 111608 | 670.46 | 677 | 659 | 165.5 |
| D | 2 | 234 | 24366 | 143.26 | 677 | 659 | 165.5 |
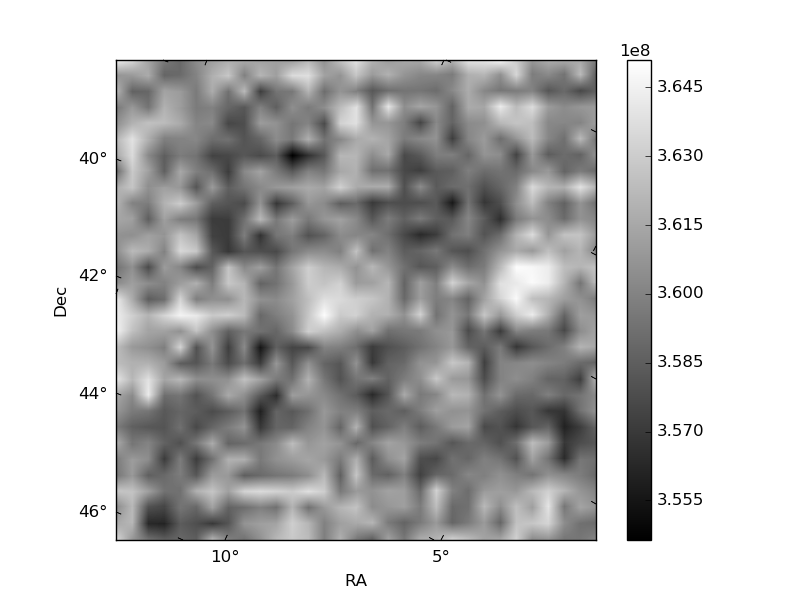
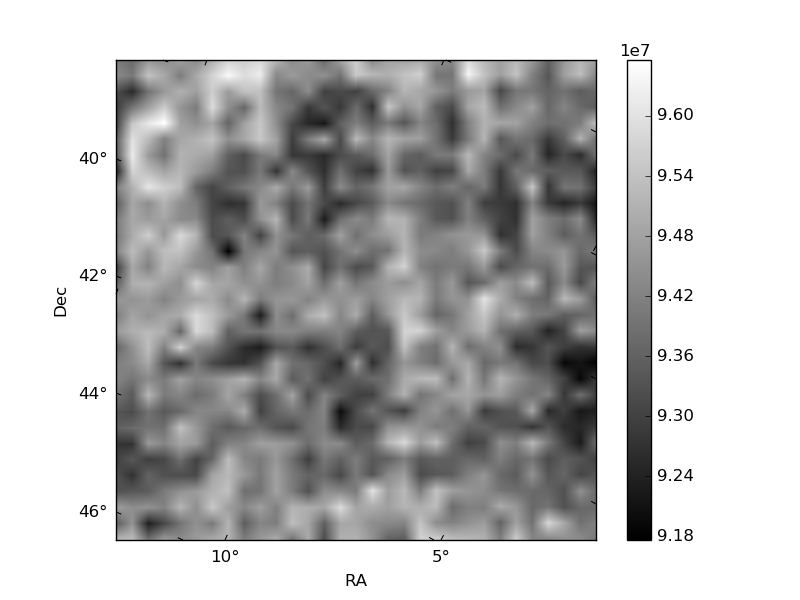
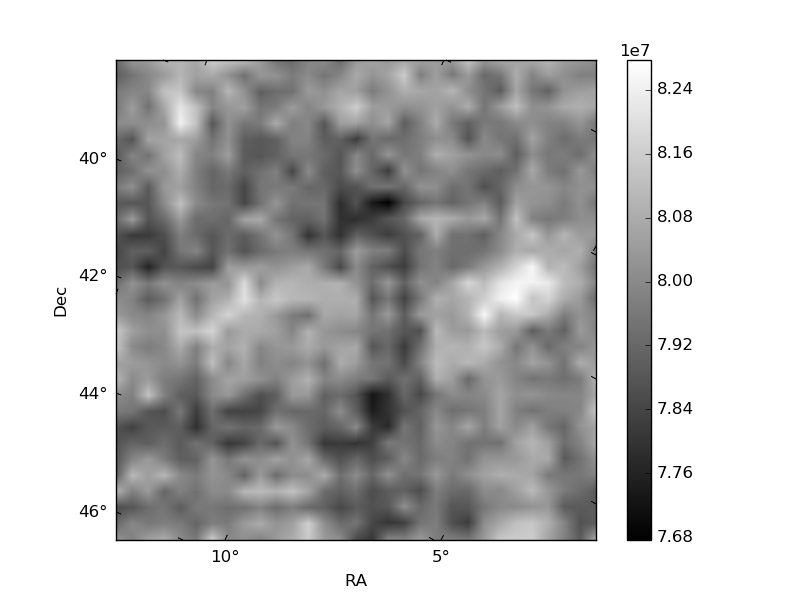
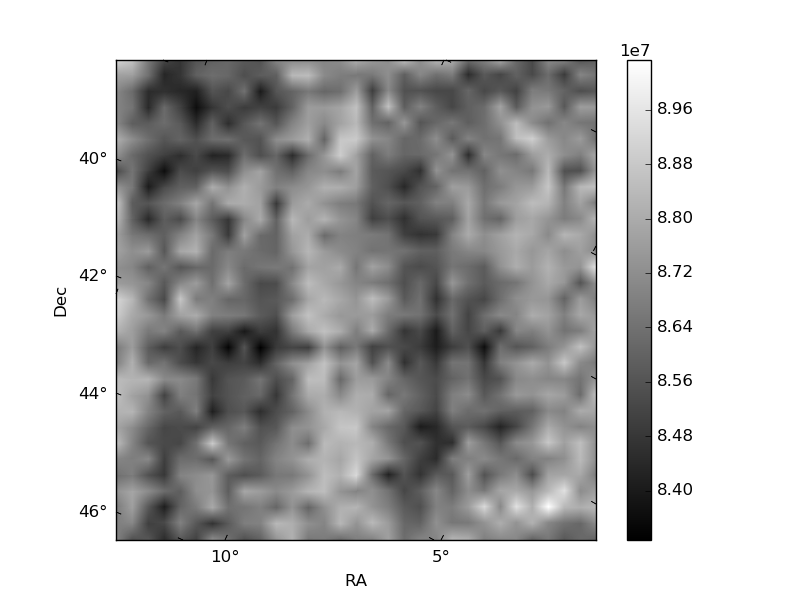
Histogram calculated using DETX and DETY for each event in the final _common_clean file
| Quadrant A | 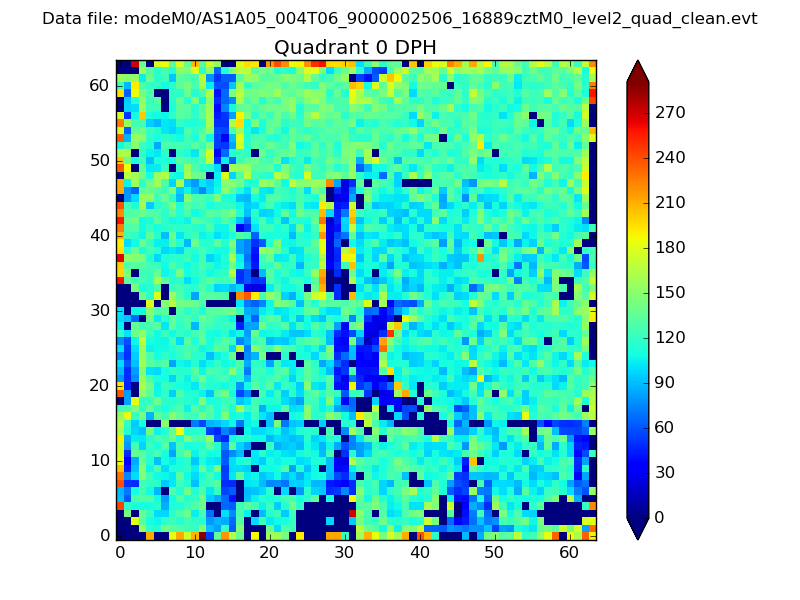 |
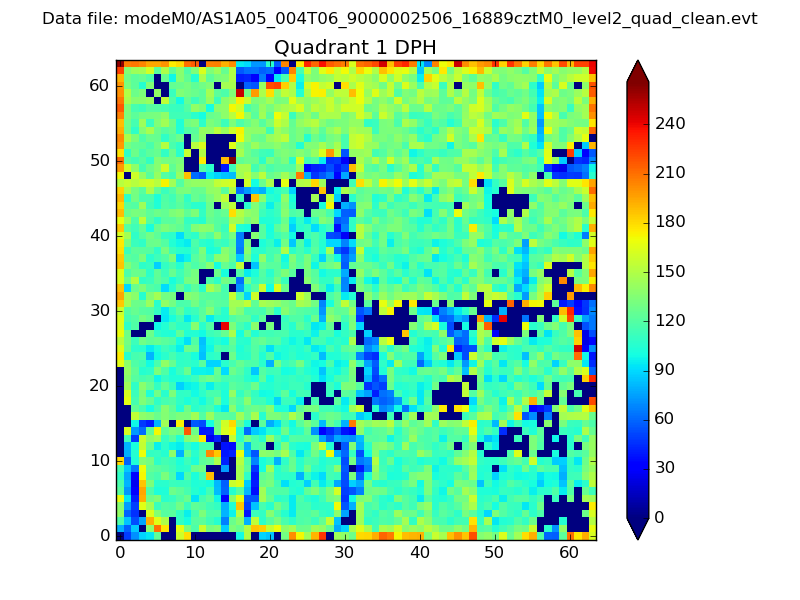 |
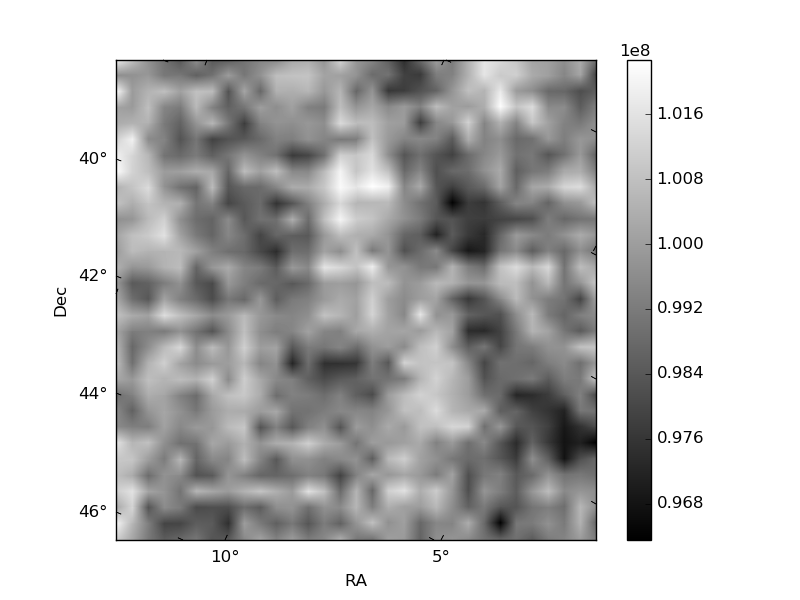
Quadrant B |
|---|---|---|---|
| Quadrant D | 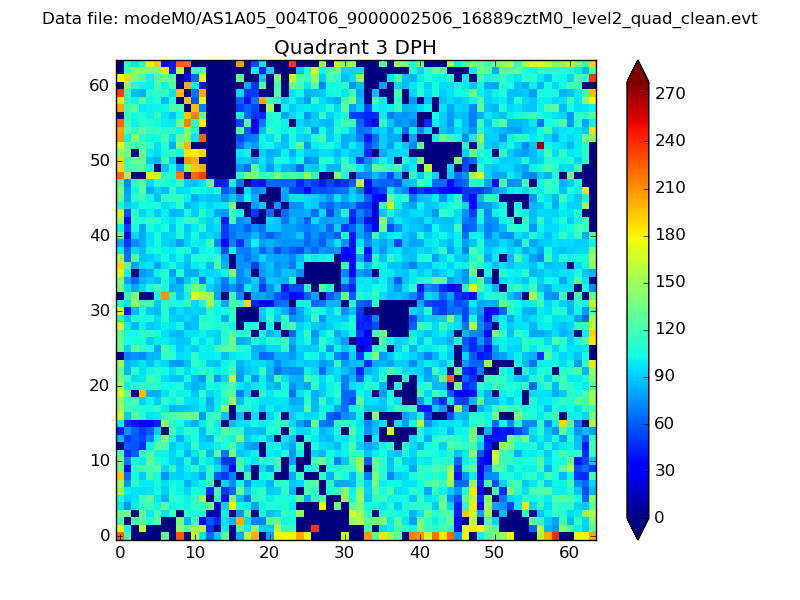 |
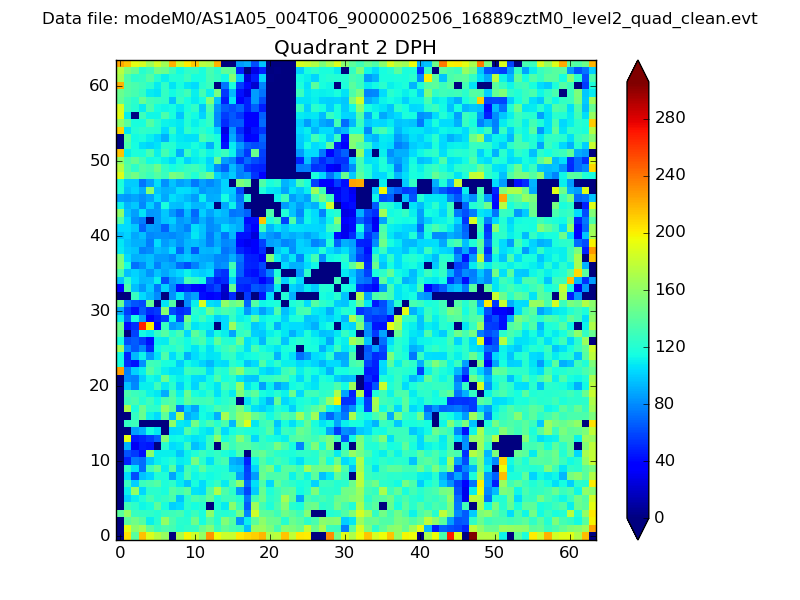 |
Quadrant C |
| Plot type | Count rate plots | Images |
|---|---|---|
| Comparison with Poisson distribution Blue bars denote a histogram of data divided into 1 sec bins. Red curve is a Poisson curve with rate = median count rate of data. |
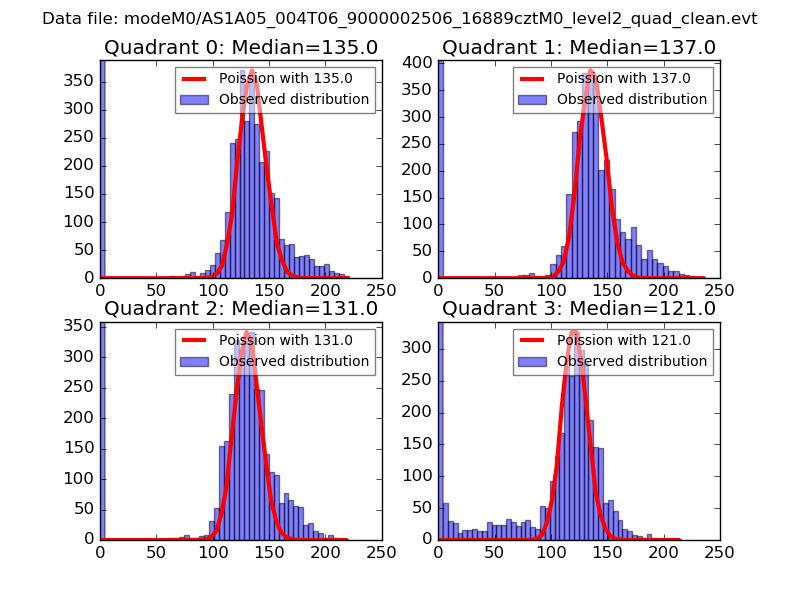 |
 |
| Quadrant-wise count rates Data is divided into 100 sec bins |
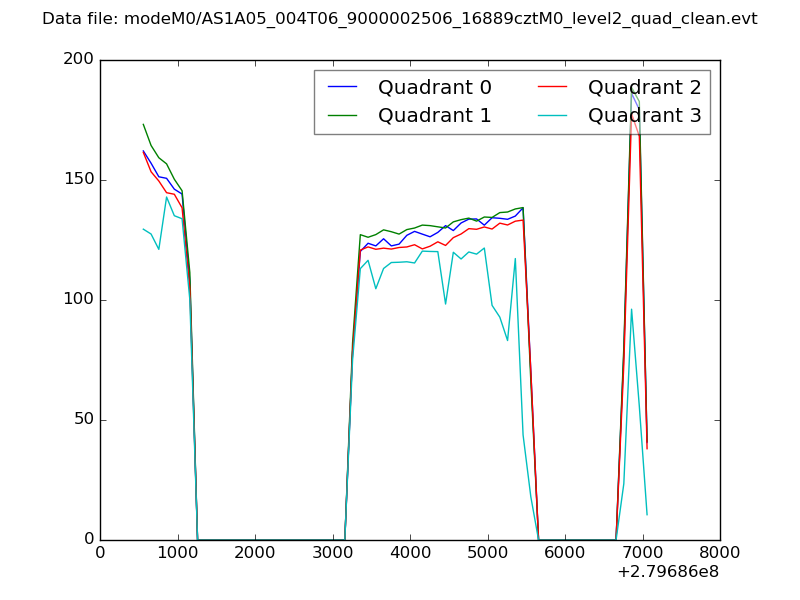 |
|
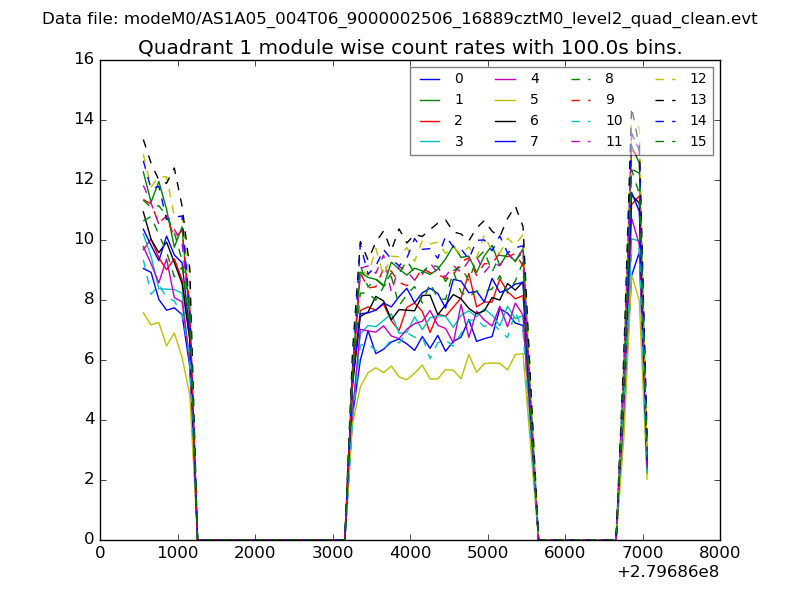
| Module-wise count rates for Quadrant A Data is divided into 100 sec bins |
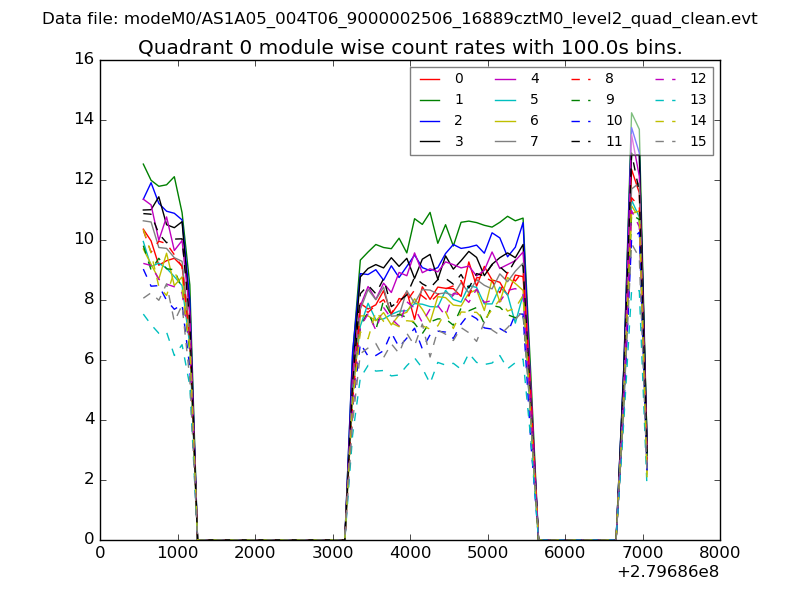 |
 |
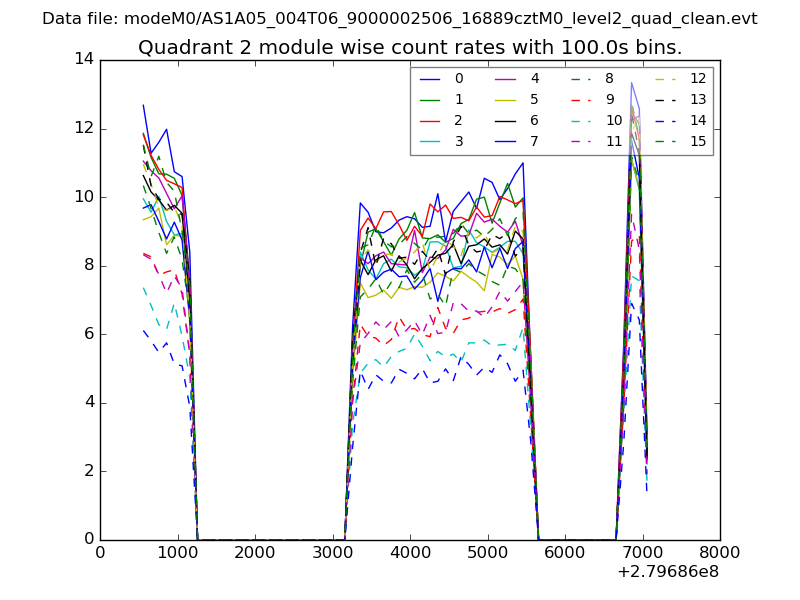
| Module-wise count rates for Quadrant B Data is divided into 100 sec bins |
 |
 |
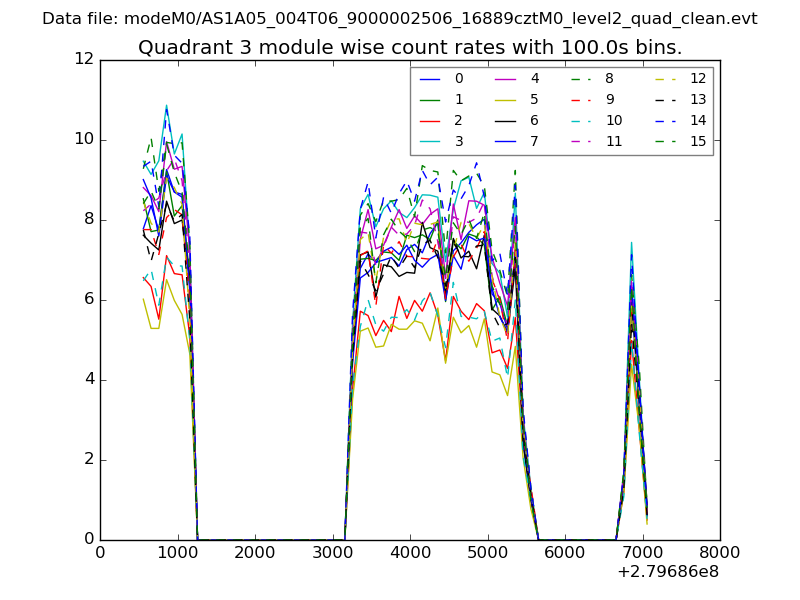
| Module-wise count rates for Quadrant C Data is divided into 100 sec bins |
 |
 |
| Module-wise count rates for Quadrant D Data is divided into 100 sec bins |
 |
 |
| Parameter | Plot |
|---|---|
| CZT HV Monitor | 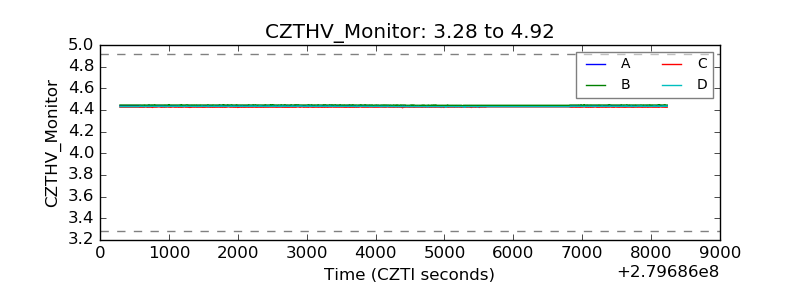 |
| D_VDD | 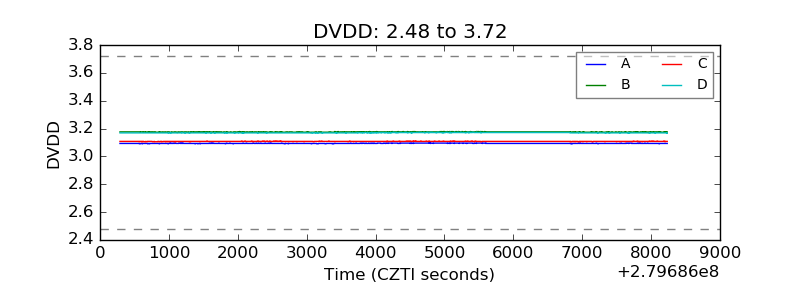 |
| Temperature 1 | 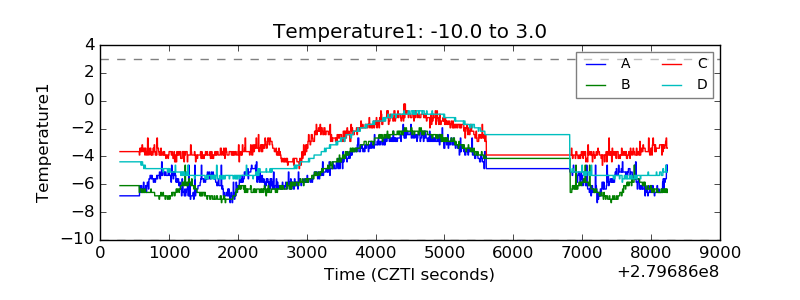 |
| Veto HV Monitor | 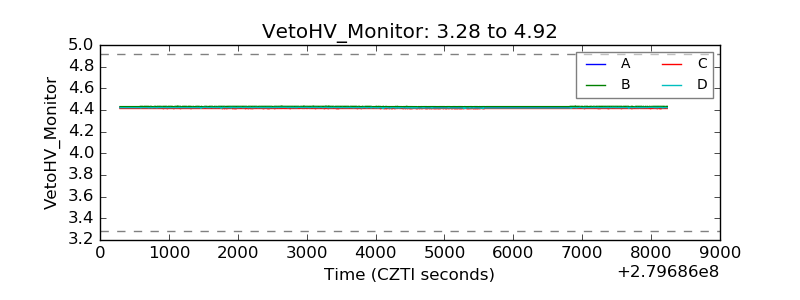 |
| Veto LLD | 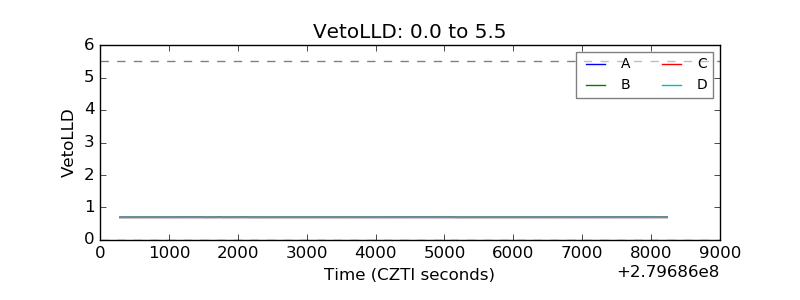 |
| Alpha Counter | 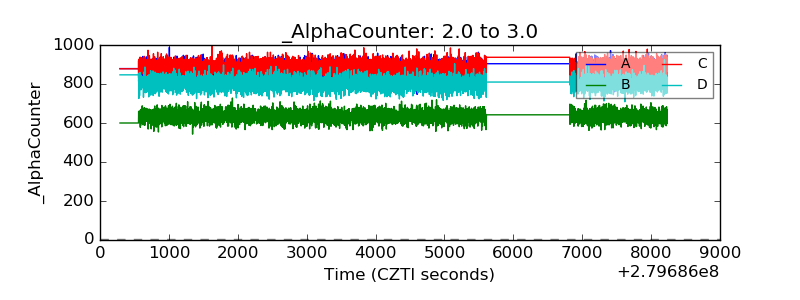 |
| _CPM_Rate | 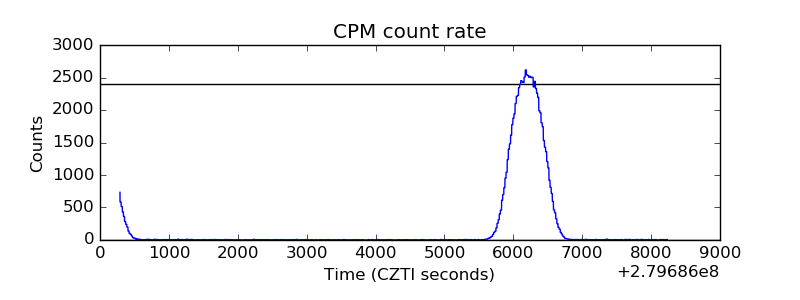 |
| CZT Counter | 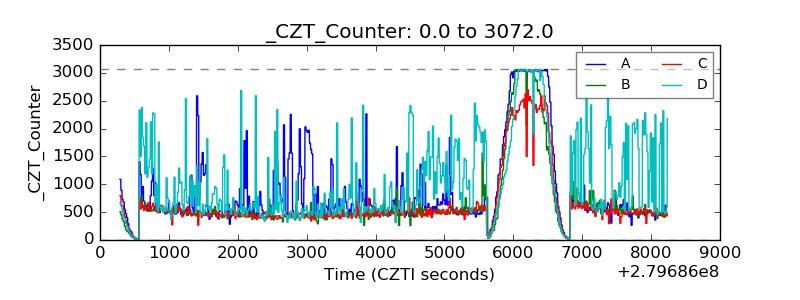 |
| +2.5 Volts monitor |  |
| +5 Volts monitor |  |
| _ROLL_ROT | 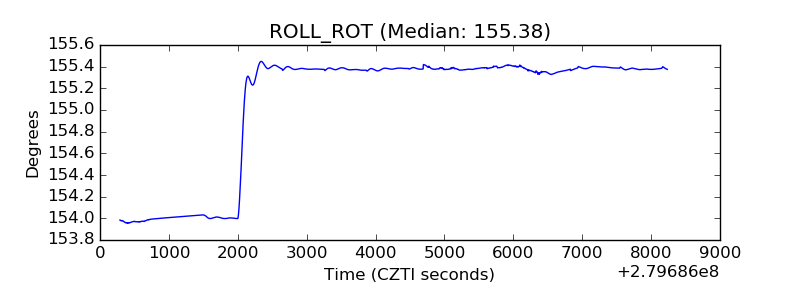 |
| _Roll_DEC | 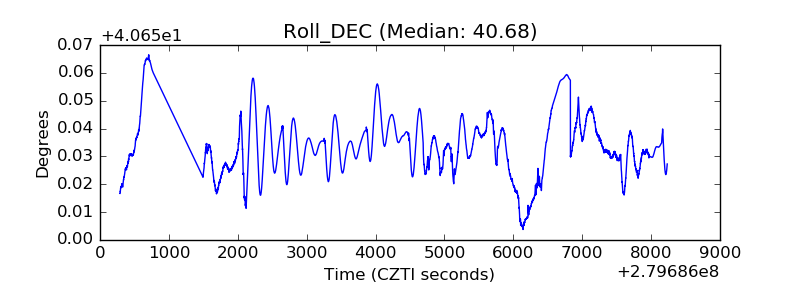 |
| _Roll_RA | 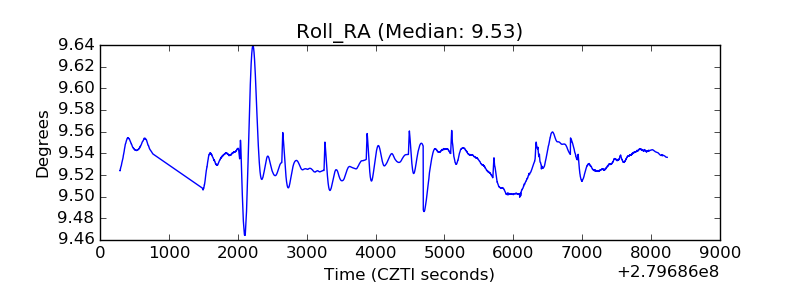 |
| Veto Counter | 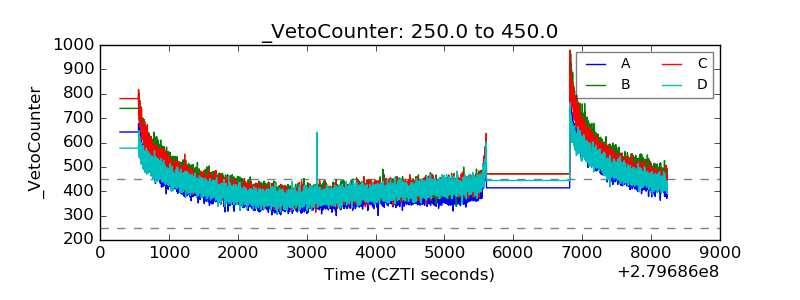 |