| Param | Original file | Final file |
|---|---|---|
| Filename | modeM0/AS1A05_004T06_9000002506_16890cztM0_level2.evt | modeM0/AS1A05_004T06_9000002506_16890cztM0_level2_quad_clean.evt |
| Size (bytes) | 655,873,920 | 62,130,240 |
| Size | 625.5 MB | 59.3 MB |
| Events in quadrant A | 4,989,143 | 358,010 |
| Events in quadrant B | 3,757,228 | 403,770 |
| Events in quadrant C | 3,263,907 | 390,909 |
| Events in quadrant D | 7,414,772 | 276,314 |
| Mode M9 | |||
|---|---|---|---|
| Quadrant | BADHDUFLAG | Total packets | Discarded packets |
| A | 0 | 15 | 0 |
| B | 0 | 15 | 0 |
| C | 0 | 15 | 0 |
| D | 0 | 16 | 0 |
| Mode SS | |||
|---|---|---|---|
| Quadrant | BADHDUFLAG | Total packets | Discarded packets |
| A | 0 | 130 | 0 |
| B | 0 | 130 | 0 |
| C | 0 | 130 | 0 |
| D | 0 | 130 | 0 |
| Mode M0 | |||
|---|---|---|---|
| Quadrant | BADHDUFLAG | Total packets | Discarded packets |
| A | 0 | 19014 | 3 |
| B | 0 | 15107 | 2 |
| C | 0 | 13566 | 2 |
| D | 0 | 26509 | 2 |
| Quadrant | Total seconds | Saturated seconds | Saturation percentage |
|---|---|---|---|
| A | 6463 | 718 | 11.109392% |
| B | 6463 | 144 | 2.228067% |
| C | 6463 | 46 | 0.711744% |
| D | 6463 | 2074 | 32.090361% |
Noise dominated data is calculated using 1-second bins in cleaned event files. If a bin has >2000 counts, and if more than 50% of those come from <1% of pixels, then it is considered to be noise-dominated and hence unusable.
| Quadrant | # 1 sec bins | Bins with >0 counts | Bins with >2000 counts | High rate bins dominated by noise | Noise dominated (total time) | Noise dominated (detector-on time) | Marked lightcurve |
|---|---|---|---|---|---|---|---|
| A | 7754 | 6465 | 486 | 486 | 6.27% | 7.52% | 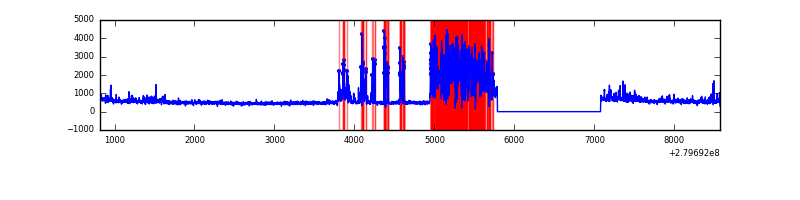 |
| B | 7754 | 6465 | 73 | 73 | 0.94% | 1.13% |  |
| C | 7754 | 6465 | 0 | 0 | 0.00% | 0.00% | 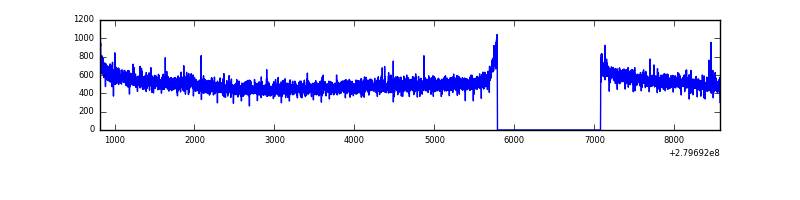 |
| D | 7754 | 6465 | 1011 | 1011 | 13.04% | 15.64% | 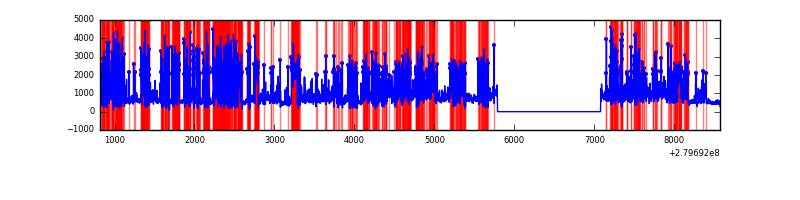 |
Top three noisy pixels from each quadrant. If the there are fewer than three noisy pixels in the level2.evt file, extra rows are filled as -1
| Pixel properties | Quadrant properties | ||||||
|---|---|---|---|---|---|---|---|
| Quadrant | DetID | PixID | Counts | Sigma | Mean | Median | Sigma |
| A | 15 | 174 | 1886389 | 11641.76 | 805 | 790 | 162.0 |
| A | 0 | 226 | 7099 | 38.95 | 805 | 790 | 162.0 |
| A | 9 | 143 | 6570 | 35.69 | 805 | 790 | 162.0 |
| B | 15 | 35 | 224003 | 1411.14 | 840 | 821 | 158.2 |
| B | 0 | 219 | 187414 | 1179.8 | 840 | 821 | 158.2 |
| B | 10 | 16 | 34504 | 212.97 | 840 | 821 | 158.2 |
| C | 14 | 238 | 126214 | 683.93 | 799 | 806 | 183.4 |
| C | 3 | 233 | 13125 | 67.18 | 799 | 806 | 183.4 |
| C | 7 | 247 | 7869 | 38.52 | 799 | 806 | 183.4 |
| D | 1 | 52 | 4906435 | 31601.29 | 644 | 626 | 155.2 |
| D | 12 | 32 | 34363 | 217.32 | 644 | 626 | 155.2 |
| D | 2 | 234 | 21279 | 133.04 | 644 | 626 | 155.2 |
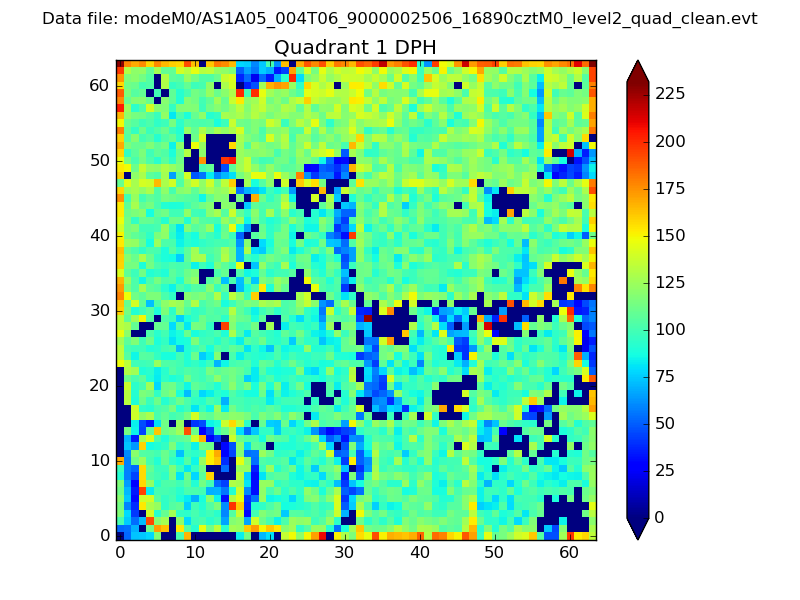
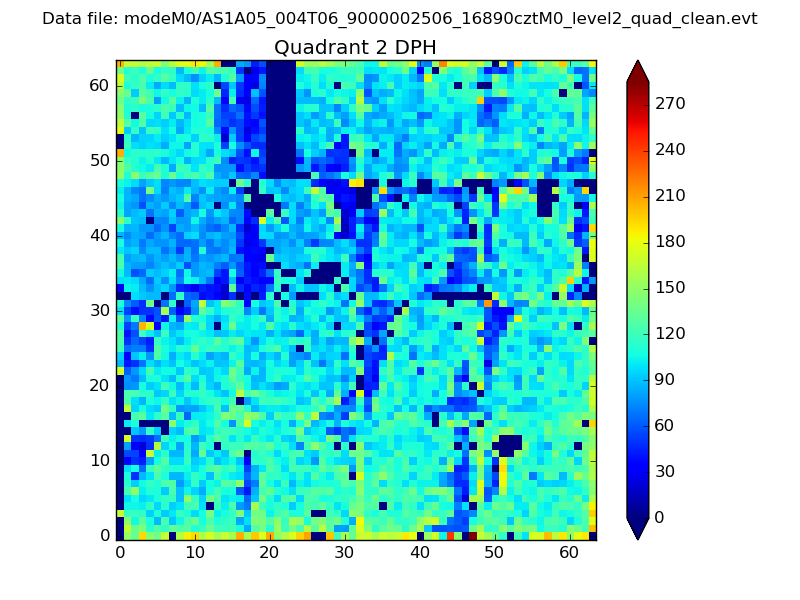
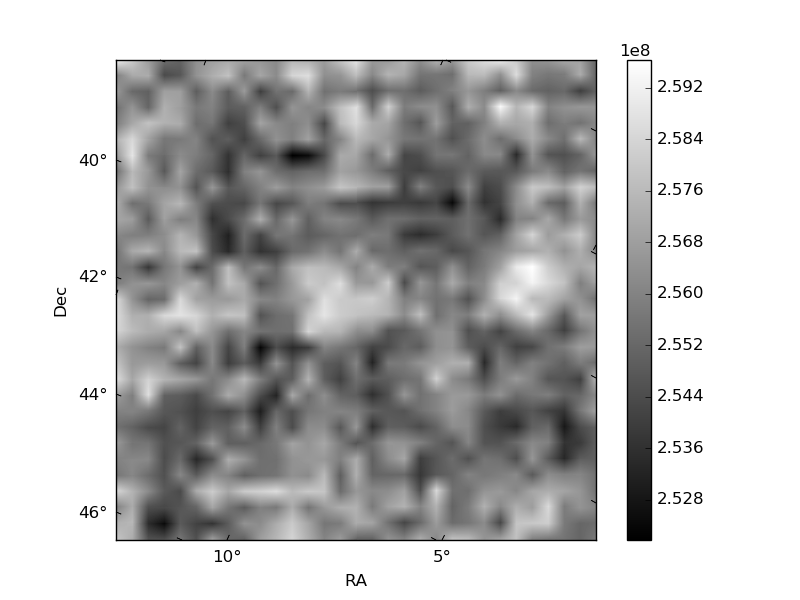
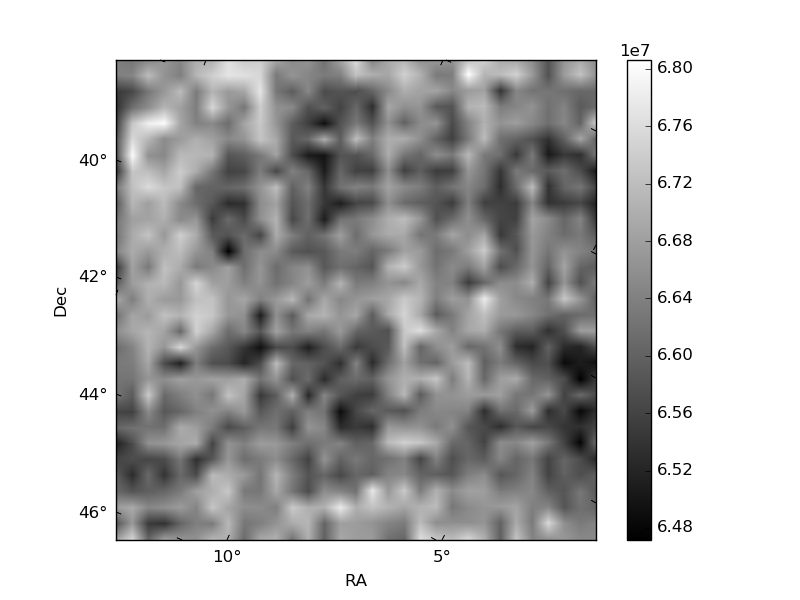
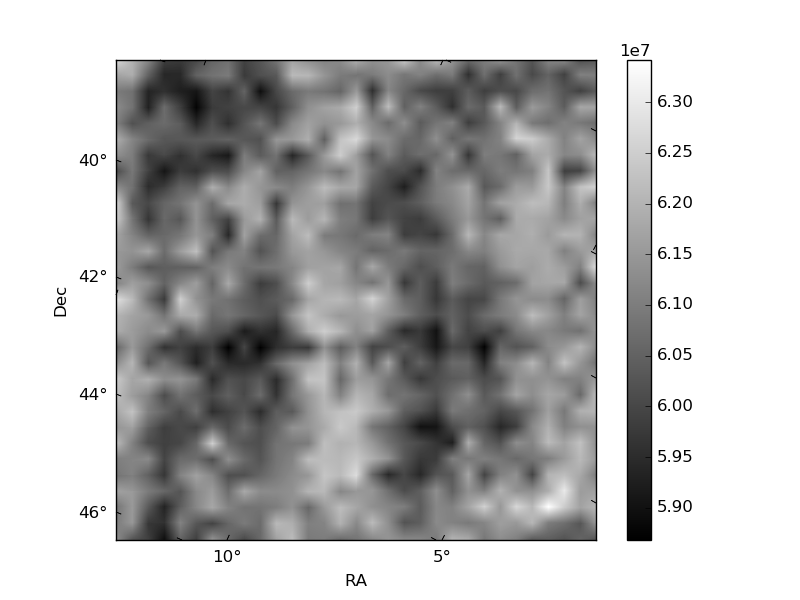
Histogram calculated using DETX and DETY for each event in the final _common_clean file
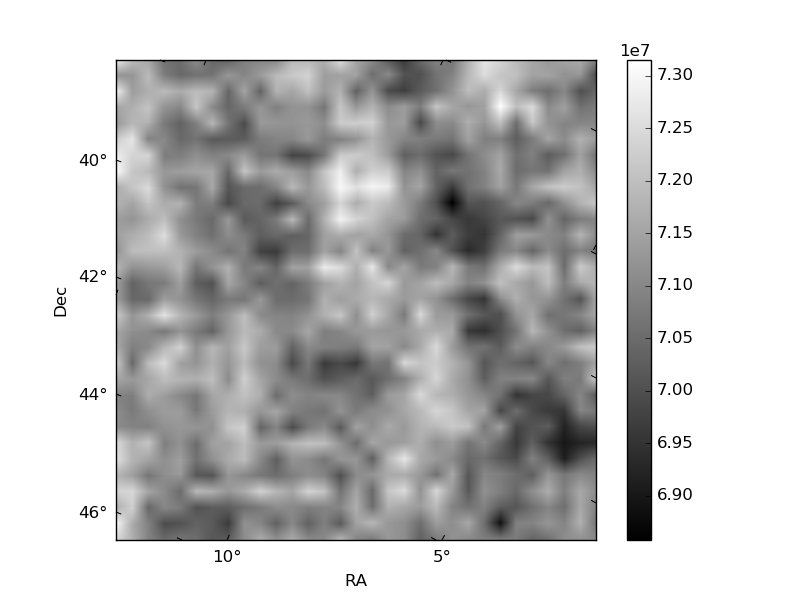
| Quadrant A | 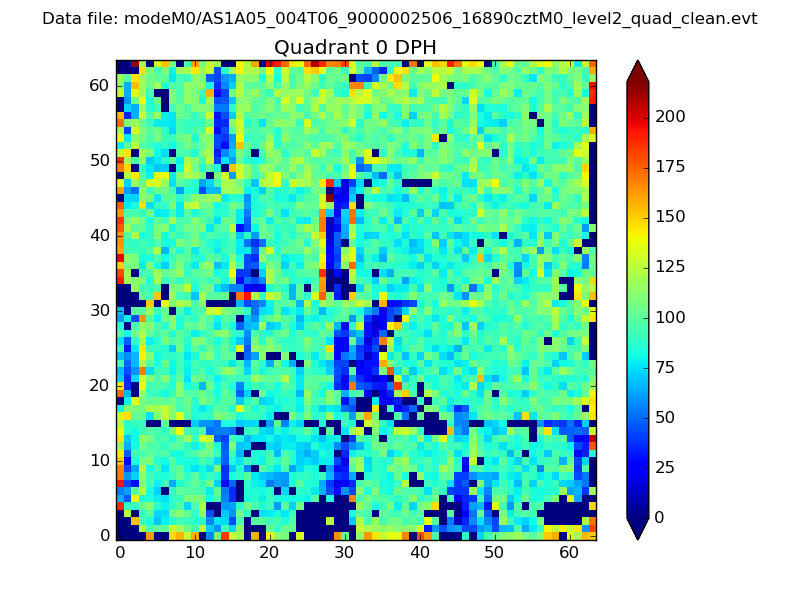 |
 |
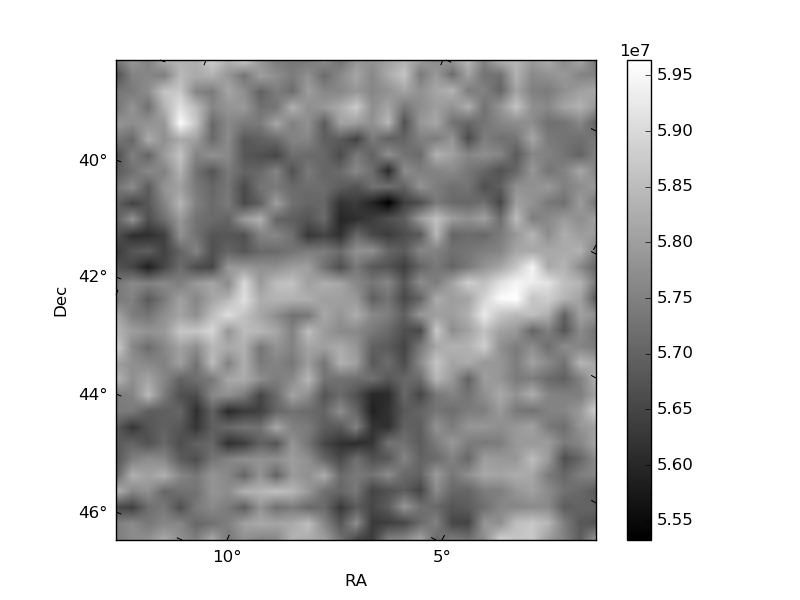
Quadrant B |
|---|---|---|---|
| Quadrant D | 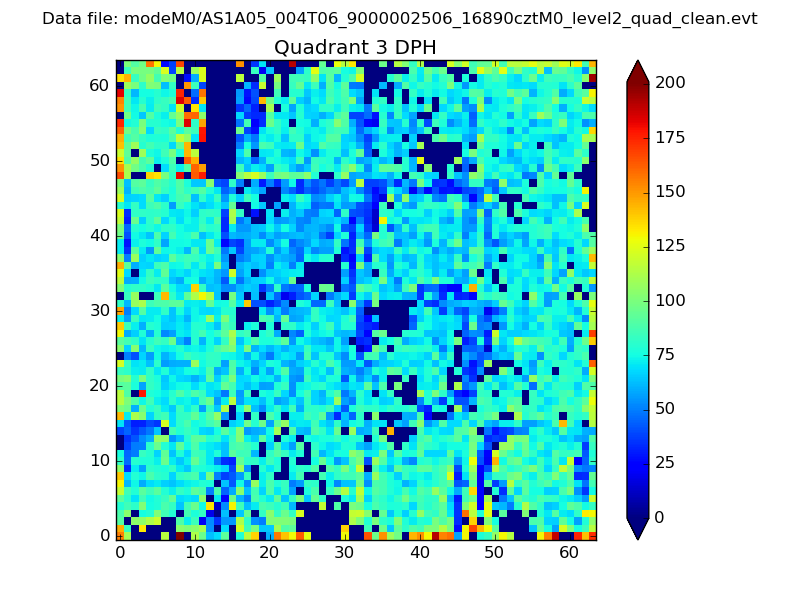 |
 |
Quadrant C |
| Plot type | Count rate plots | Images |
|---|---|---|
| Comparison with Poisson distribution Blue bars denote a histogram of data divided into 1 sec bins. Red curve is a Poisson curve with rate = median count rate of data. |
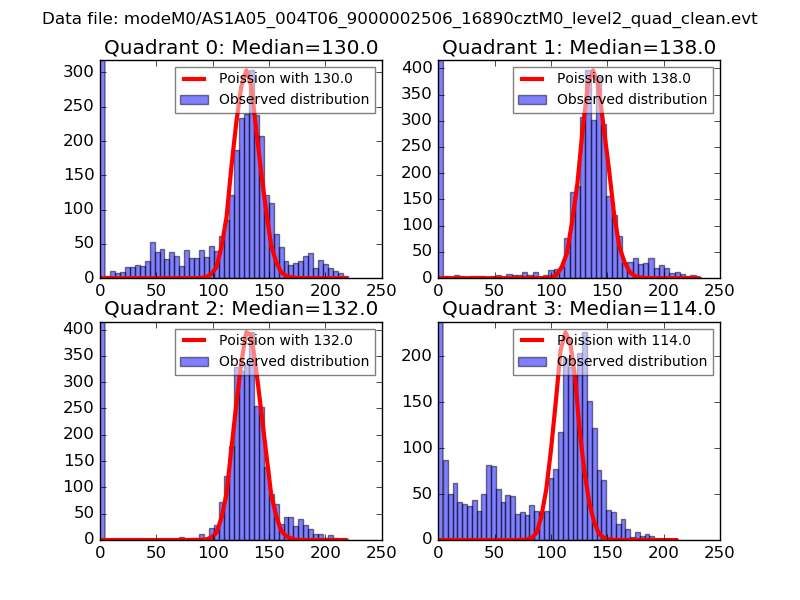 |
 |
| Quadrant-wise count rates Data is divided into 100 sec bins |
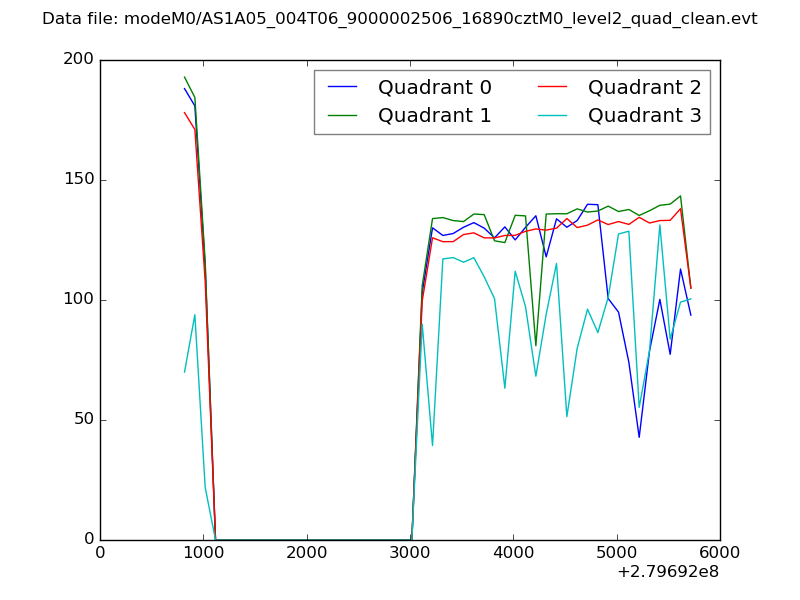 |
|
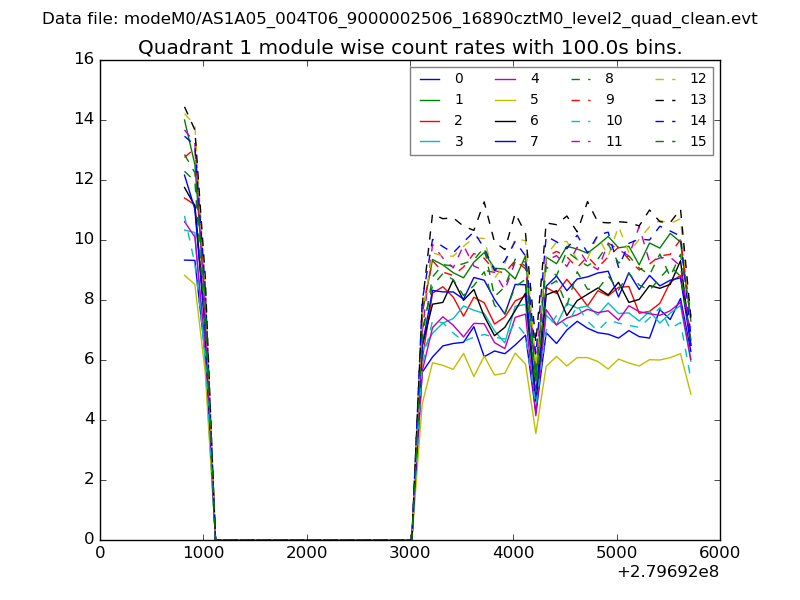
| Module-wise count rates for Quadrant A Data is divided into 100 sec bins |
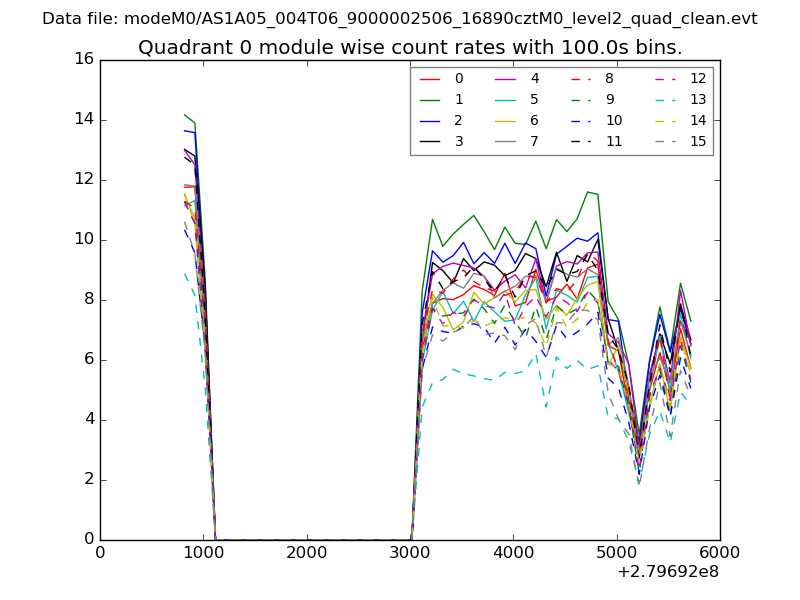 |
 |
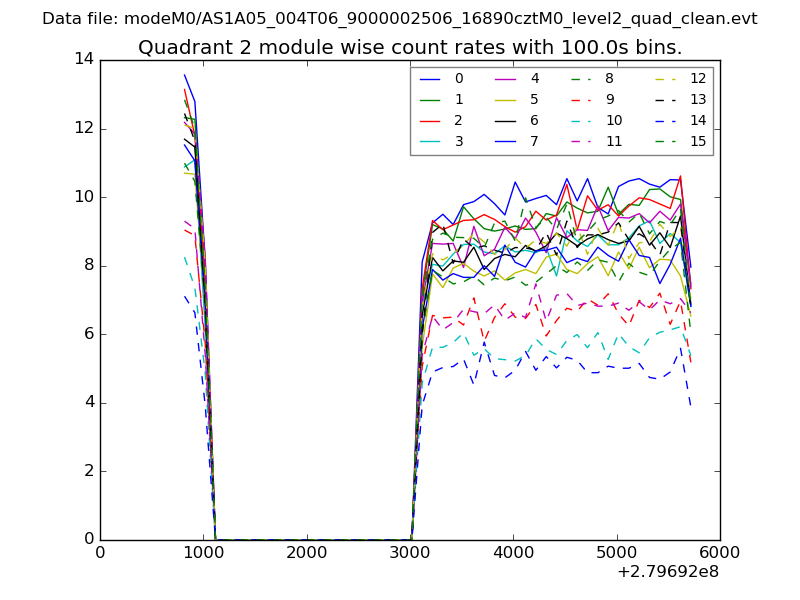
| Module-wise count rates for Quadrant B Data is divided into 100 sec bins |
 |
 |
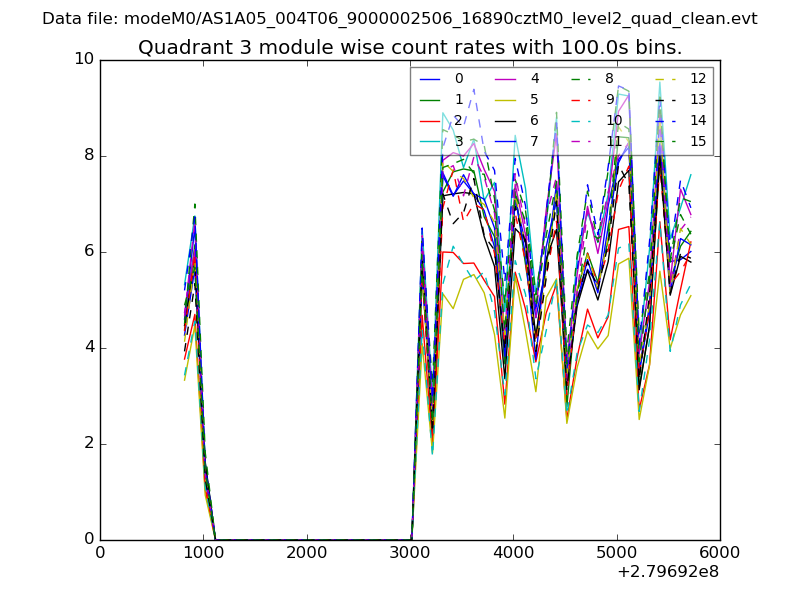
| Module-wise count rates for Quadrant C Data is divided into 100 sec bins |
 |
 |
| Module-wise count rates for Quadrant D Data is divided into 100 sec bins |
 |
 |
| Parameter | Plot |
|---|---|
| CZT HV Monitor | 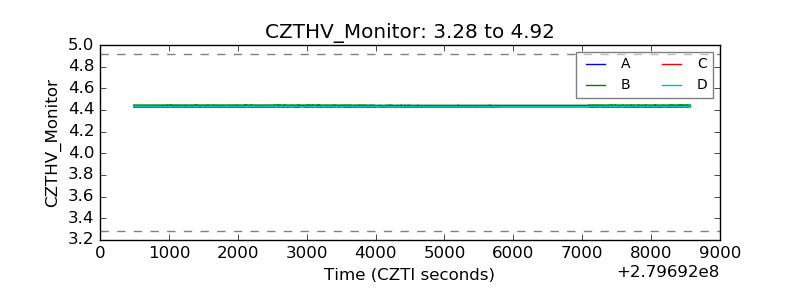 |
| D_VDD | 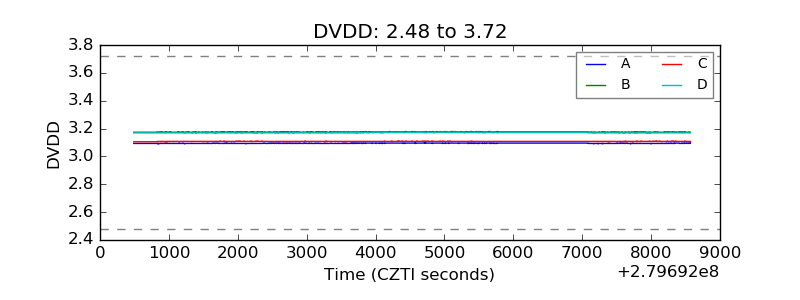 |
| Temperature 1 | 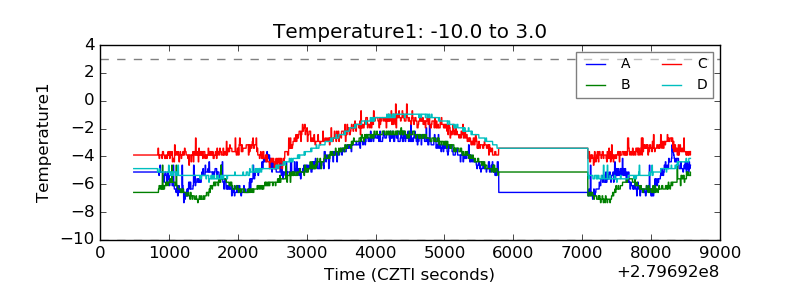 |
| Veto HV Monitor | 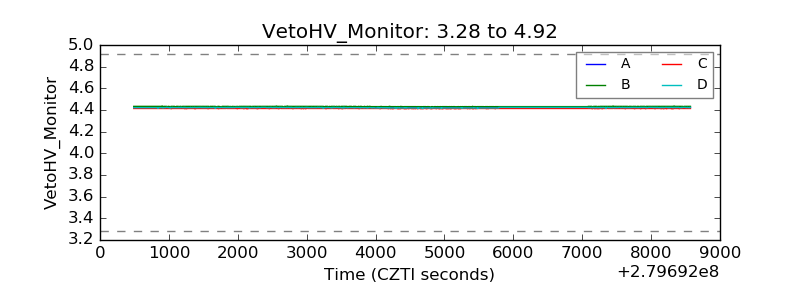 |
| Veto LLD | 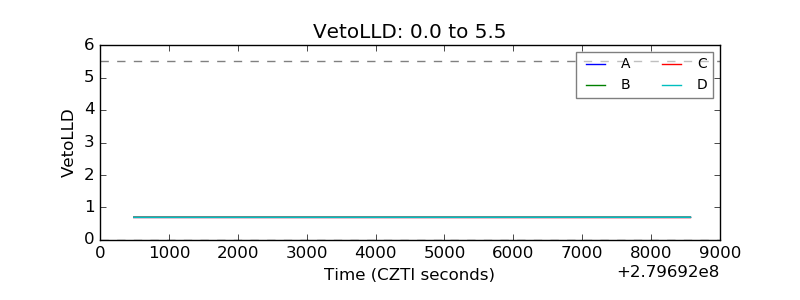 |
| Alpha Counter | 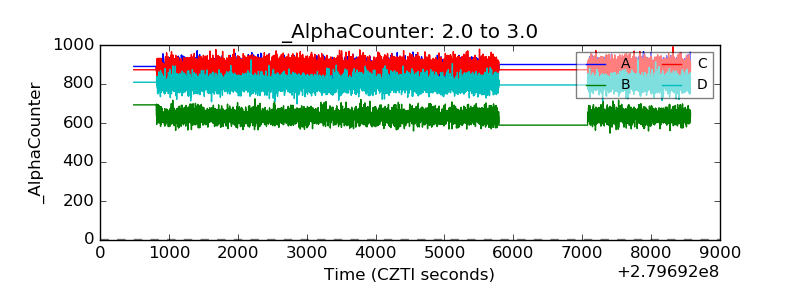 |
| _CPM_Rate | 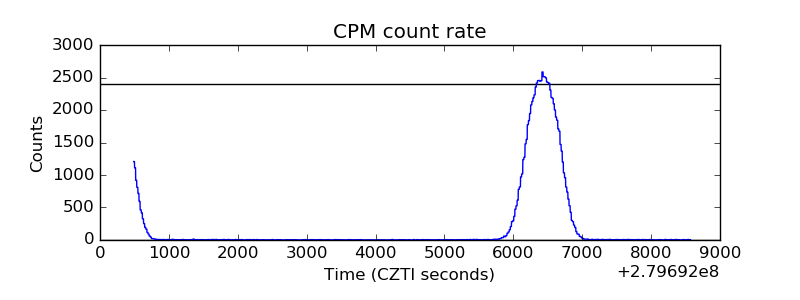 |
| CZT Counter | 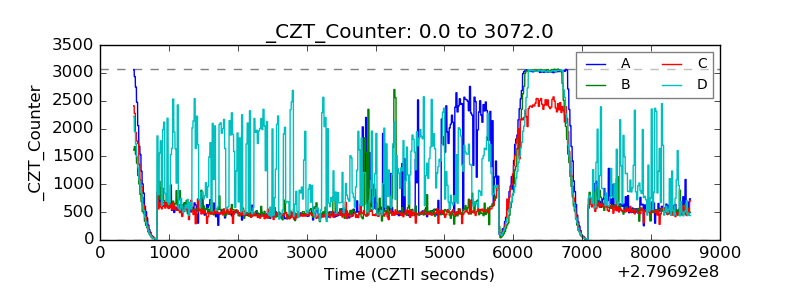 |
| +2.5 Volts monitor |  |
| +5 Volts monitor | 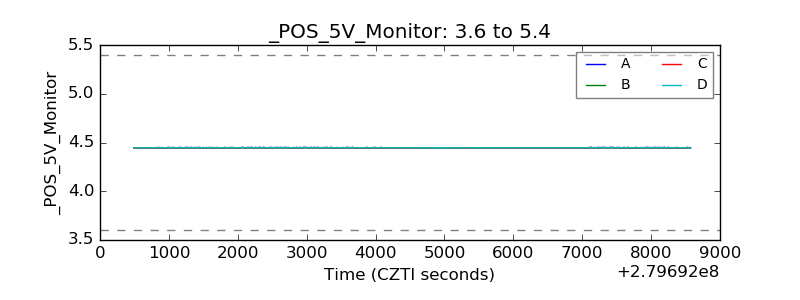 |
| _ROLL_ROT | 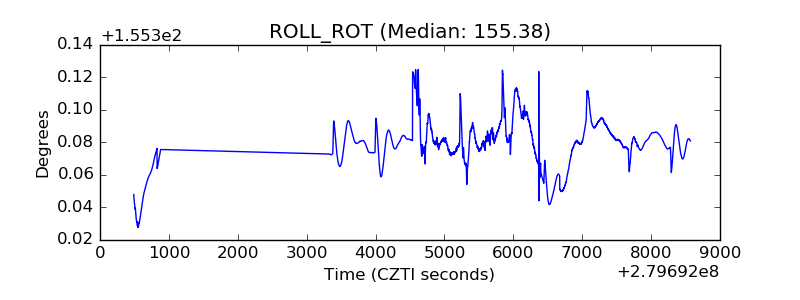 |
| _Roll_DEC |  |
| _Roll_RA | 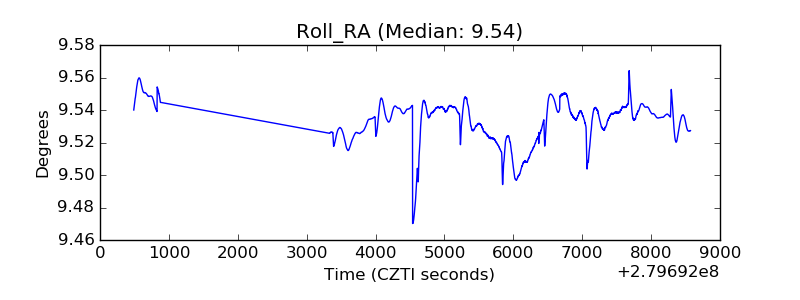 |
| Veto Counter | 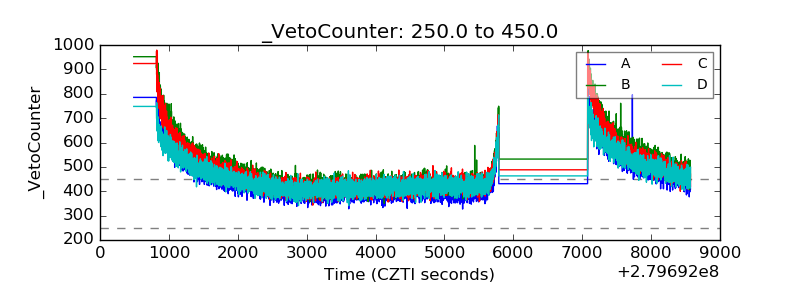 |