| Param | Original file | Final file |
|---|---|---|
| Filename | modeM0/AS1A05_004T06_9000002506_16894cztM0_level2.evt | modeM0/AS1A05_004T06_9000002506_16894cztM0_level2_quad_clean.evt |
| Size (bytes) | 392,785,920 | 55,342,080 |
| Size | 374.6 MB | 52.8 MB |
| Events in quadrant A | 5,474,173 | 320,598 |
| Events in quadrant B | 1,995,227 | 383,844 |
| Events in quadrant C | 1,664,805 | 367,167 |
| Events in quadrant D | 2,519,763 | 352,115 |
| Mode SS | |||
|---|---|---|---|
| Quadrant | BADHDUFLAG | Total packets | Discarded packets |
| A | 0 | 70 | 0 |
| B | 0 | 70 | 0 |
| C | 0 | 70 | 0 |
| D | 0 | 70 | 0 |
| Mode M0 | |||
|---|---|---|---|
| Quadrant | BADHDUFLAG | Total packets | Discarded packets |
| A | 0 | 18701 | 0 |
| B | 0 | 8060 | 0 |
| C | 0 | 7167 | 0 |
| D | 0 | 9774 | 0 |
| Quadrant | Total seconds | Saturated seconds | Saturation percentage |
|---|---|---|---|
| A | 3553 | 1377 | 38.755981% |
| B | 3553 | 10 | 0.281452% |
| C | 3554 | 9 | 0.253236% |
| D | 3554 | 177 | 4.980304% |
Noise dominated data is calculated using 1-second bins in cleaned event files. If a bin has >2000 counts, and if more than 50% of those come from <1% of pixels, then it is considered to be noise-dominated and hence unusable.
| Quadrant | # 1 sec bins | Bins with >0 counts | Bins with >2000 counts | High rate bins dominated by noise | Noise dominated (total time) | Noise dominated (detector-on time) | Marked lightcurve |
|---|---|---|---|---|---|---|---|
| A | 3554 | 3554 | 1033 | 1033 | 29.07% | 29.07% | 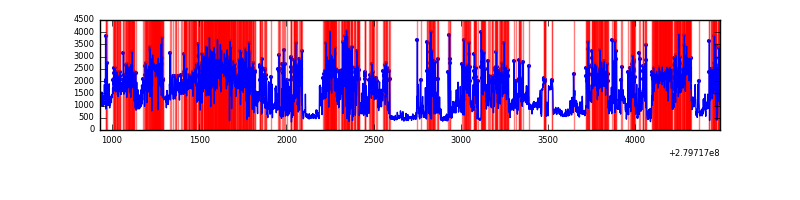 |
| B | 3554 | 3554 | 5 | 5 | 0.14% | 0.14% | 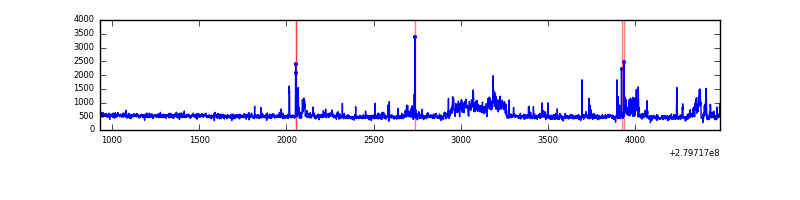 |
| C | 3555 | 3555 | 0 | 0 | 0.00% | 0.00% | 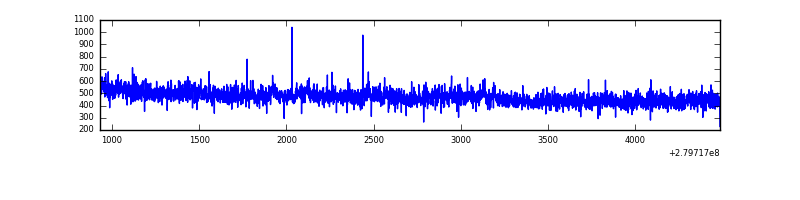 |
| D | 3555 | 3555 | 144 | 144 | 4.05% | 4.05% | 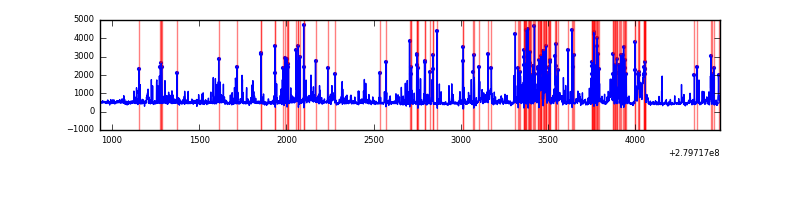 |
Top three noisy pixels from each quadrant. If the there are fewer than three noisy pixels in the level2.evt file, extra rows are filled as -1
| Pixel properties | Quadrant properties | ||||||
|---|---|---|---|---|---|---|---|
| Quadrant | DetID | PixID | Counts | Sigma | Mean | Median | Sigma |
| A | 15 | 174 | 3995581 | 54117.37 | 362 | 355 | 73.8 |
| A | 15 | 190 | 72444 | 976.48 | 362 | 355 | 73.8 |
| A | 12 | 189 | 7751 | 100.18 | 362 | 355 | 73.8 |
| B | 4 | 216 | 146288 | 1817.66 | 418 | 409 | 80.3 |
| B | 15 | 35 | 108469 | 1346.43 | 418 | 409 | 80.3 |
| B | 0 | 229 | 40922 | 504.79 | 418 | 409 | 80.3 |
| C | 14 | 238 | 62999 | 662.82 | 400 | 403 | 94.4 |
| C | 3 | 233 | 37172 | 389.34 | 400 | 403 | 94.4 |
| C | 13 | 61 | 2787 | 25.24 | 400 | 403 | 94.4 |
| D | 1 | 52 | 934475 | 9471.95 | 402 | 390 | 98.6 |
| D | 2 | 120 | 26887 | 268.69 | 402 | 390 | 98.6 |
| D | 10 | 70 | 22646 | 225.68 | 402 | 390 | 98.6 |
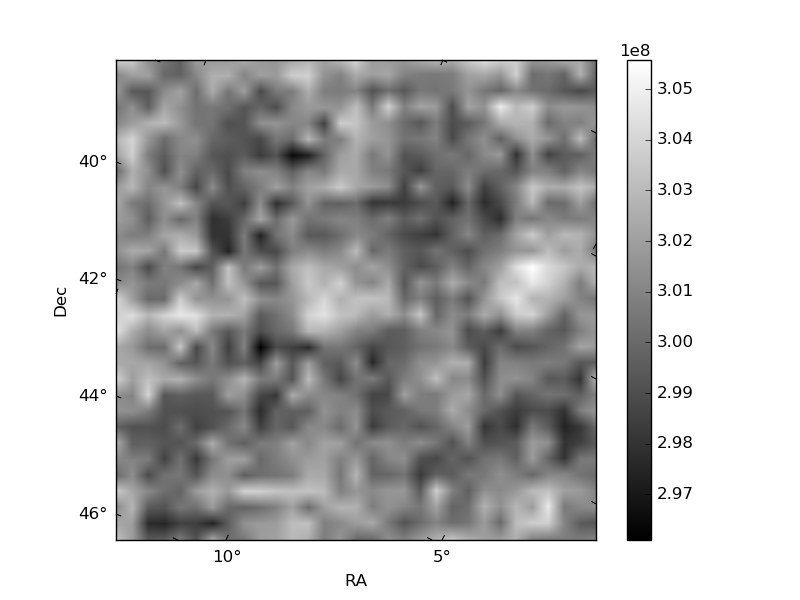
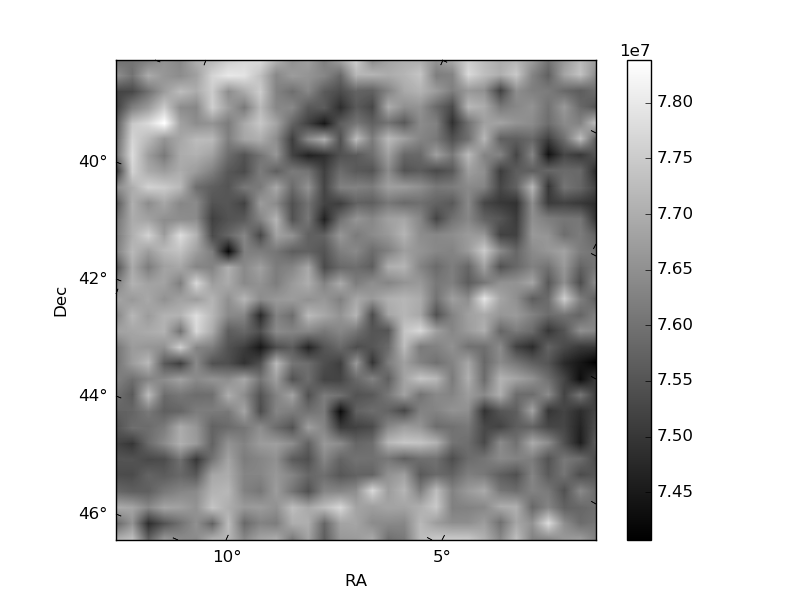
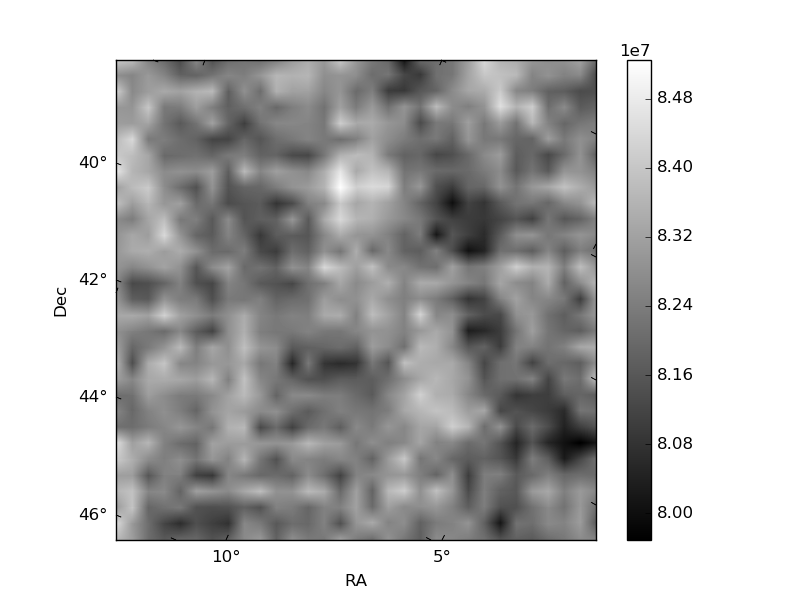
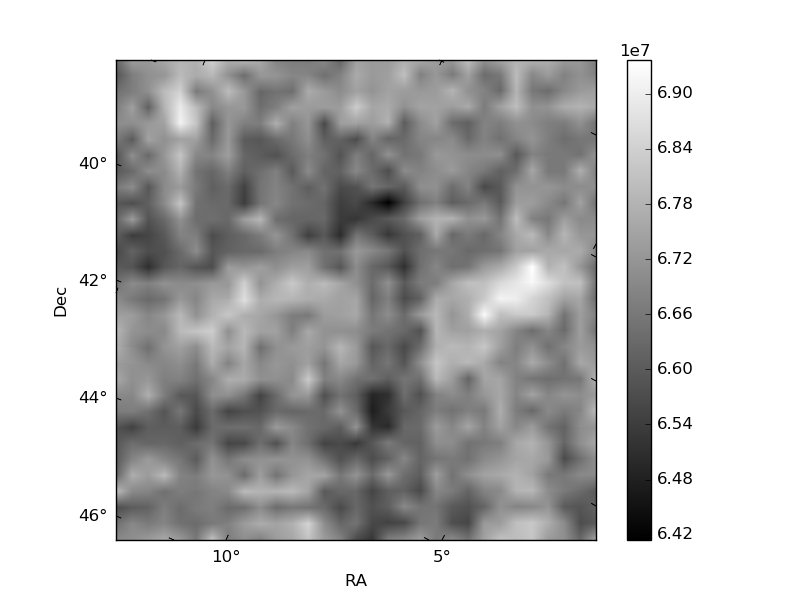
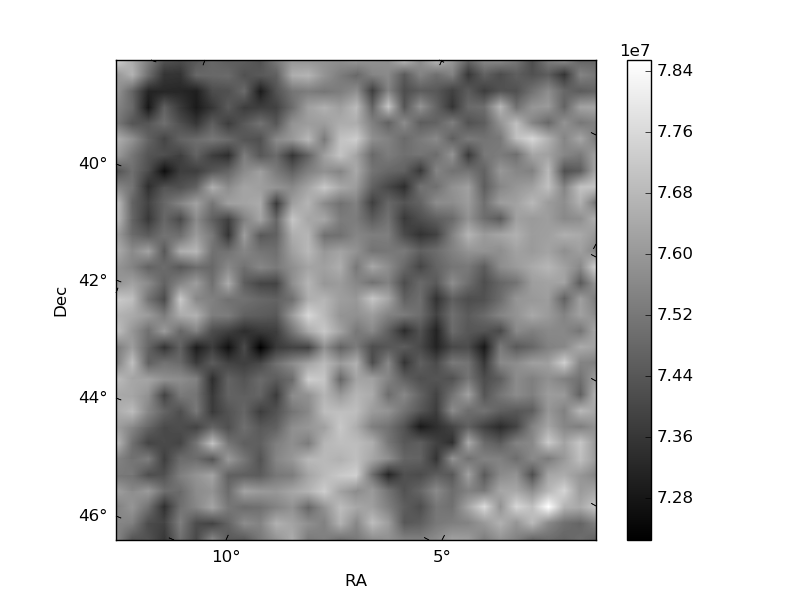
Histogram calculated using DETX and DETY for each event in the final _common_clean file
| Quadrant A | 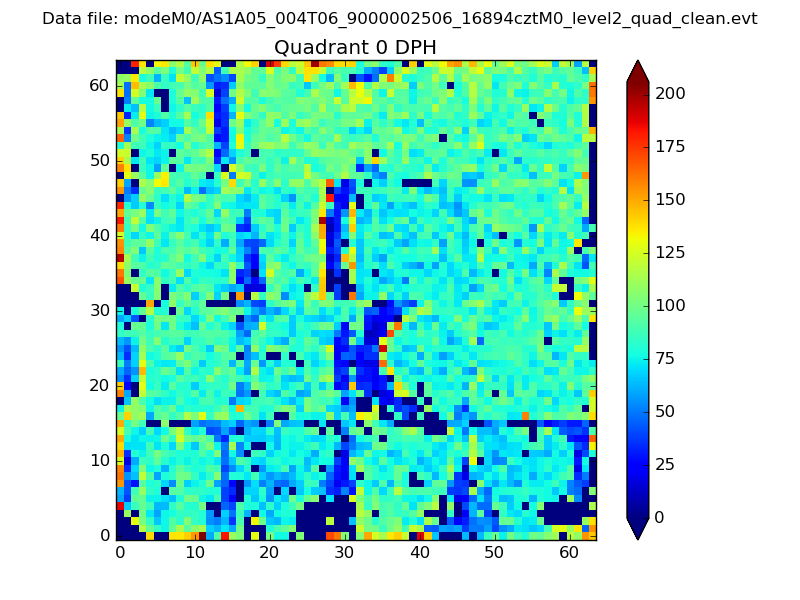 |
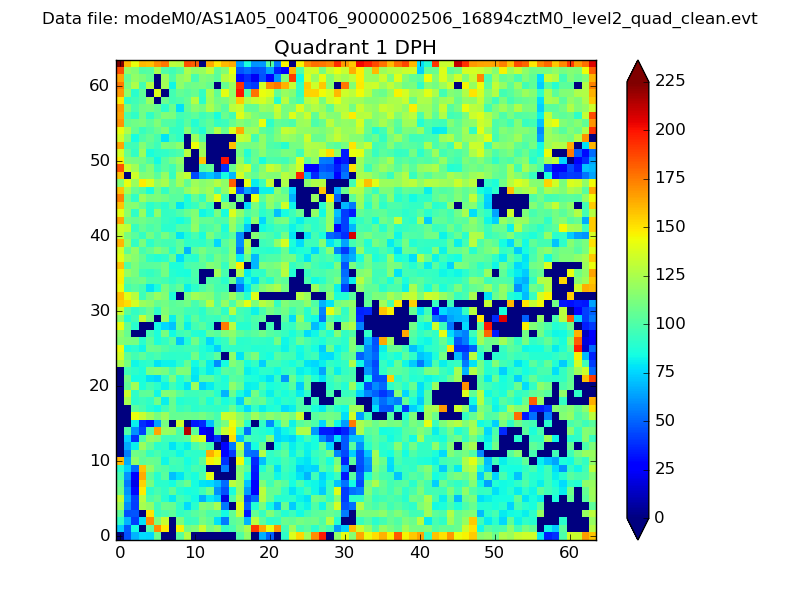 |
Quadrant B |
|---|---|---|---|
| Quadrant D | 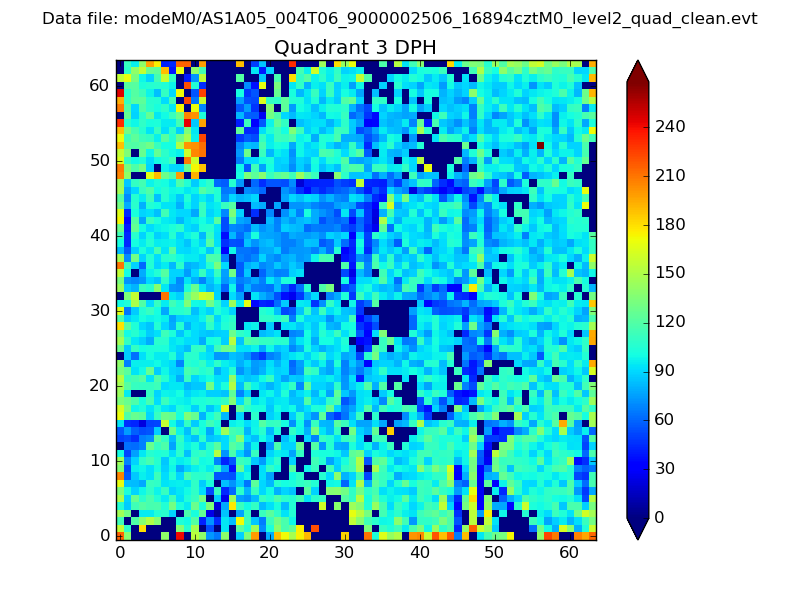 |
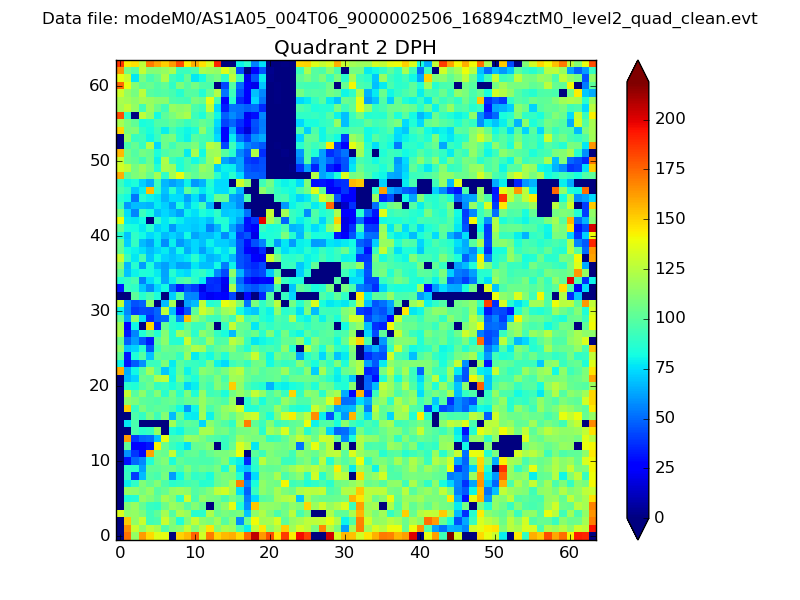 |
Quadrant C |
| Plot type | Count rate plots | Images |
|---|---|---|
| Comparison with Poisson distribution Blue bars denote a histogram of data divided into 1 sec bins. Red curve is a Poisson curve with rate = median count rate of data. |
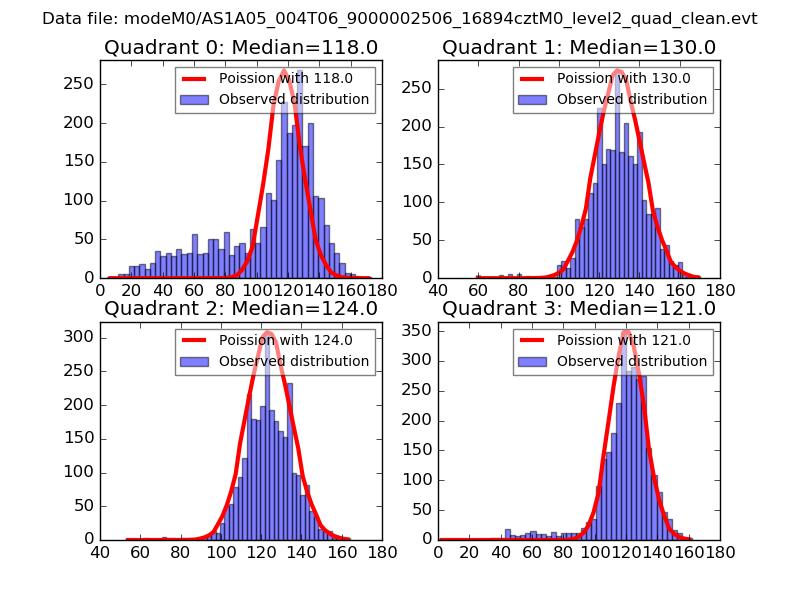 |
 |
| Quadrant-wise count rates Data is divided into 100 sec bins |
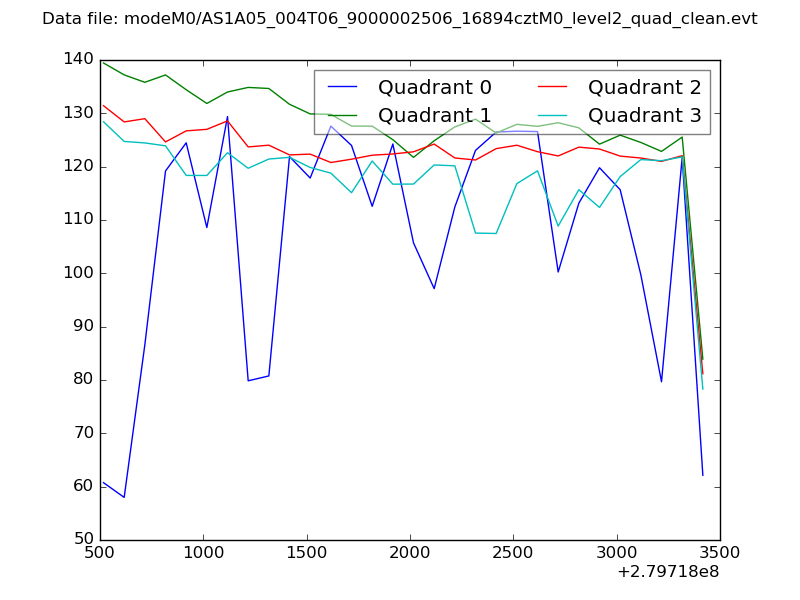 |
|
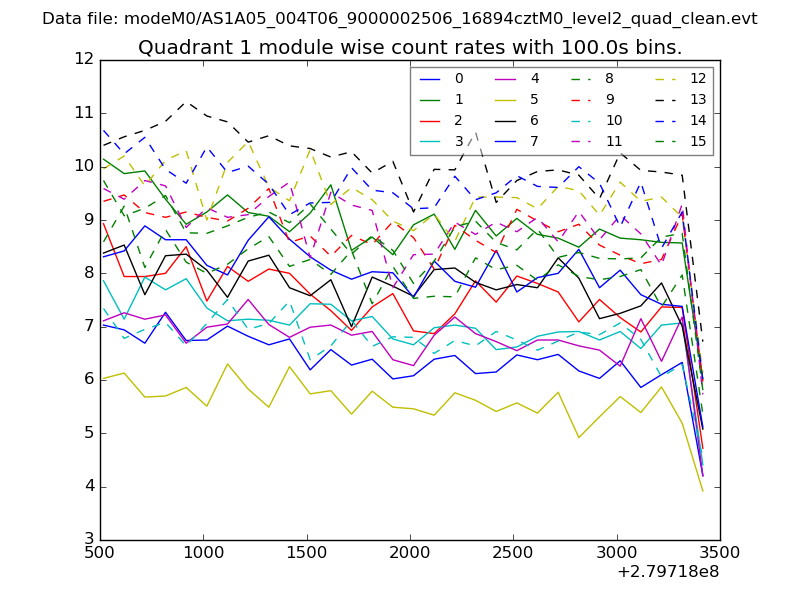
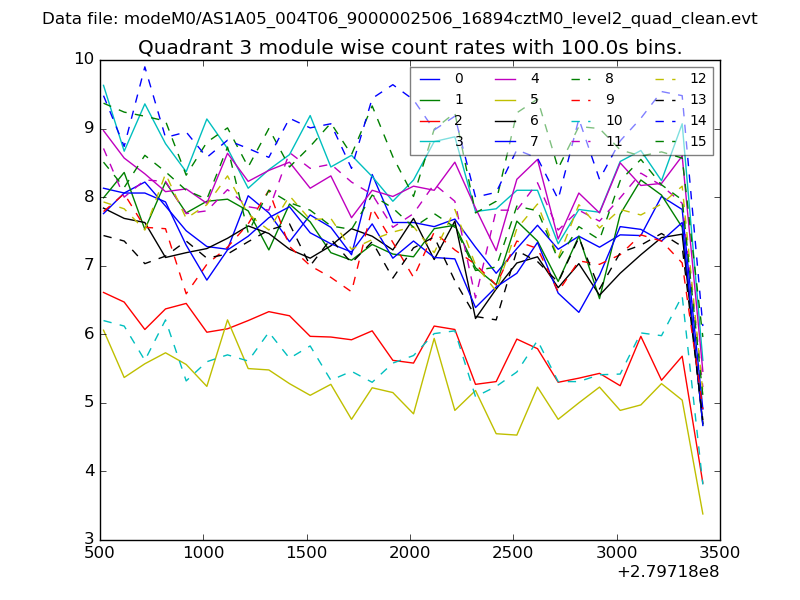
| Module-wise count rates for Quadrant A Data is divided into 100 sec bins |
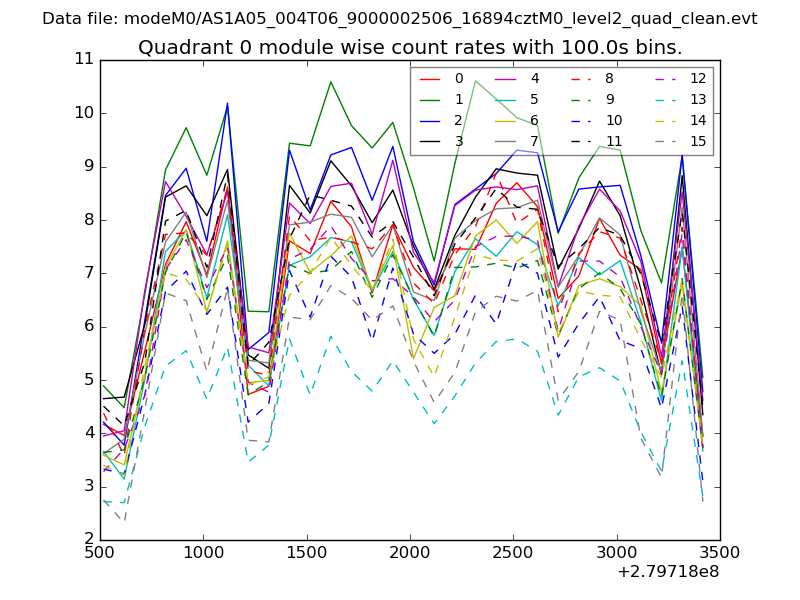 |
 |
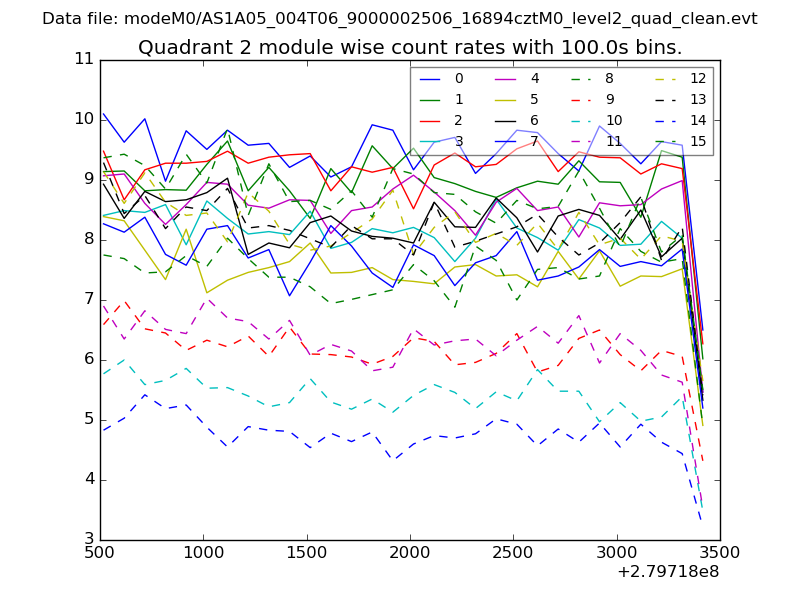
| Module-wise count rates for Quadrant B Data is divided into 100 sec bins |
 |
 |
| Module-wise count rates for Quadrant C Data is divided into 100 sec bins |
 |
 |
| Module-wise count rates for Quadrant D Data is divided into 100 sec bins |
 |
 |
| Parameter | Plot |
|---|---|
| CZT HV Monitor | 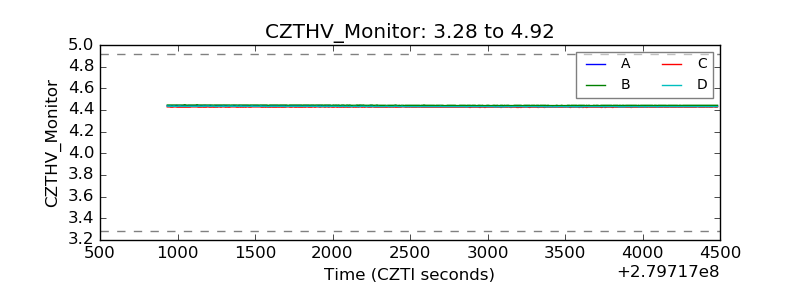 |
| D_VDD | 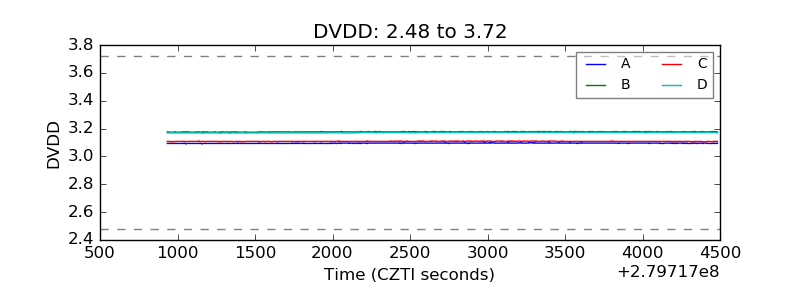 |
| Temperature 1 | 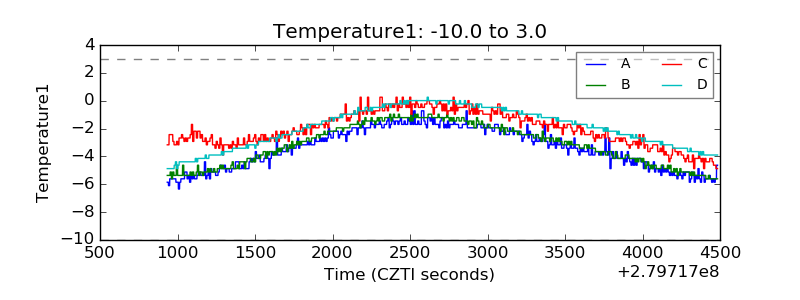 |
| Veto HV Monitor | 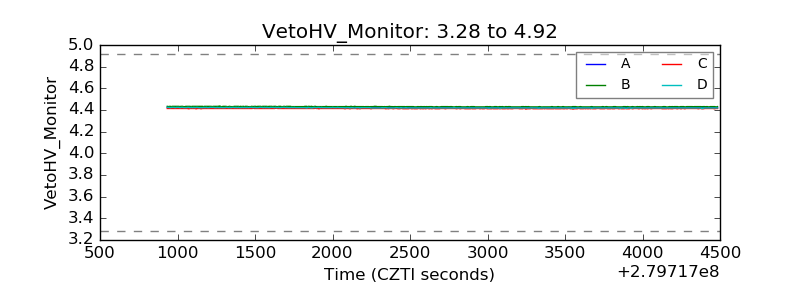 |
| Veto LLD | 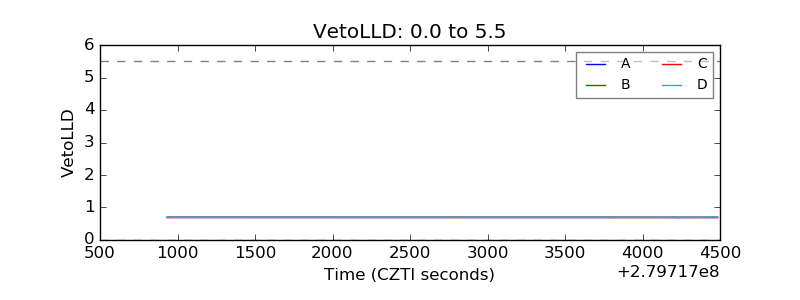 |
| Alpha Counter | 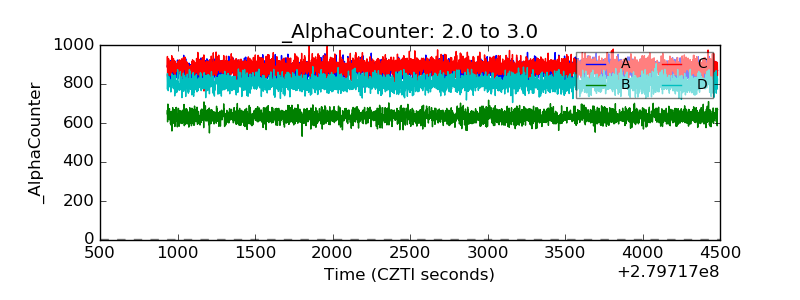 |
| _CPM_Rate | 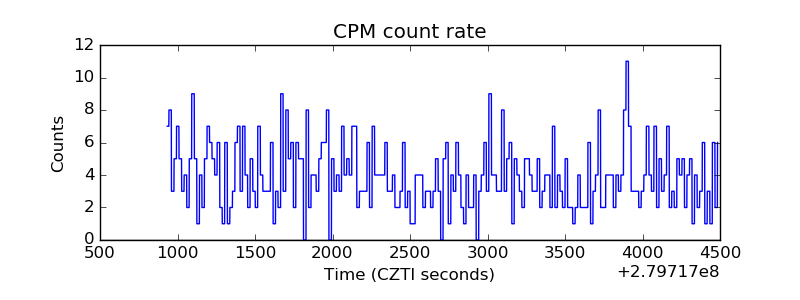 |
| CZT Counter | 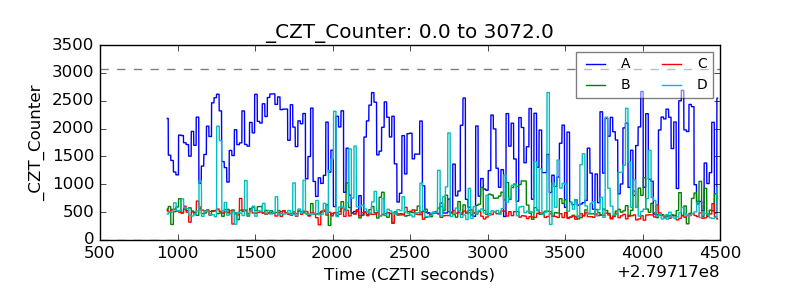 |
| +2.5 Volts monitor | 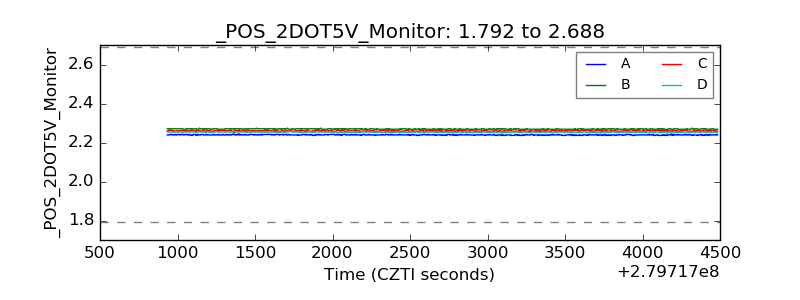 |
| +5 Volts monitor | 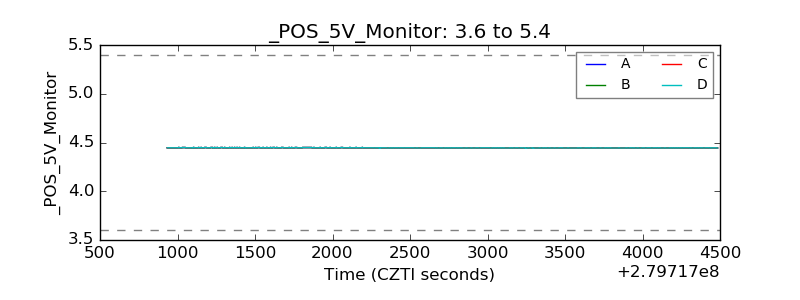 |
| _ROLL_ROT | 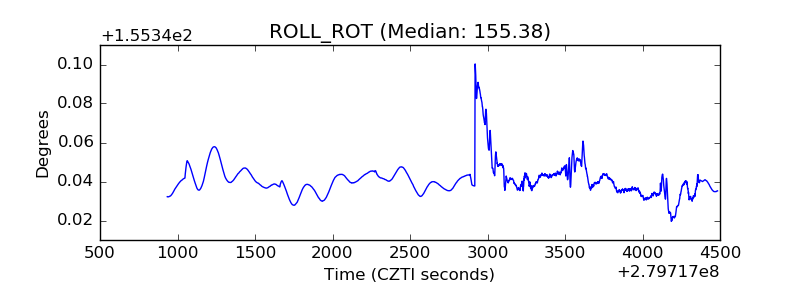 |
| _Roll_DEC | 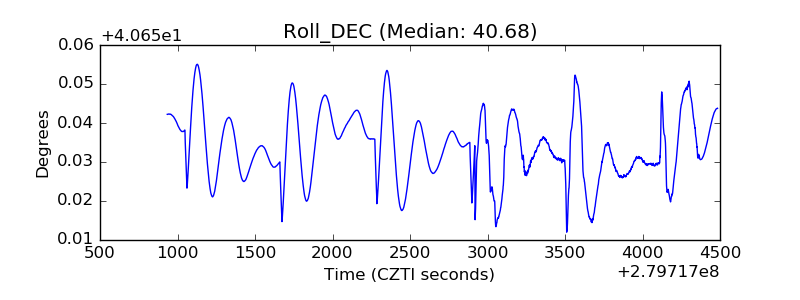 |
| _Roll_RA | 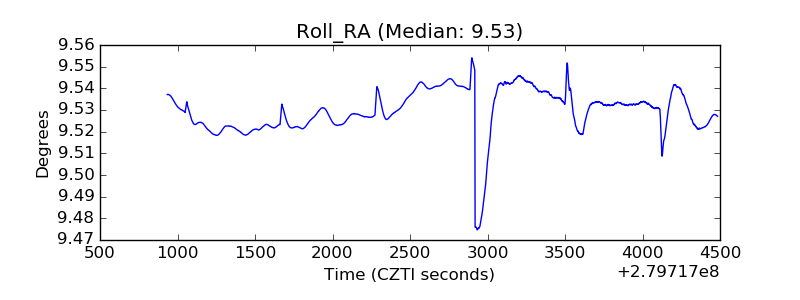 |
| Veto Counter | 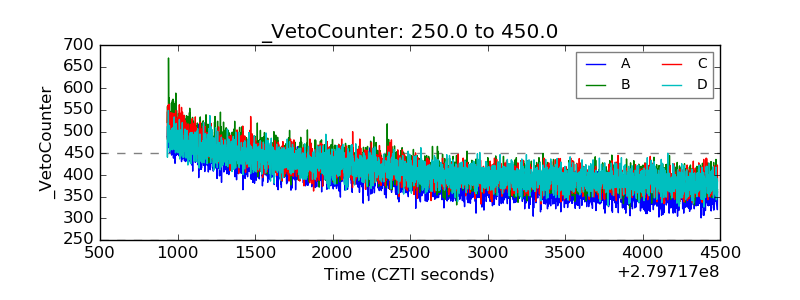 |