| Param | Original file | Final file |
|---|---|---|
| Filename | modeM0/AS1A05_074T02_9000002504cztM0_level2.fits | modeM0/AS1A05_074T02_9000002504cztM0_level2_quad_clean.evt |
| Size (bytes) | 279,987,840 | 242,072,640 |
| Size | 267.0 MB | 230.9 MB |
| Events in quadrant A | 1,778,636 | 1,478,055 |
| Events in quadrant B | 1,709,544 | 1,487,602 |
| Events in quadrant C | 1,747,484 | 1,420,700 |
| Events in quadrant D | 1,405,838 | 1,107,343 |
| Mode M9 | |||
|---|---|---|---|
| Quadrant | BADHDUFLAG | Total packets | Discarded packets |
| A | 0 | 69 | 0 |
| B | 0 | 69 | 0 |
| C | 0 | 69 | 0 |
| D | 0 | 69 | 0 |
| Mode SS | |||
|---|---|---|---|
| Quadrant | BADHDUFLAG | Total packets | Discarded packets |
| A | 0 | 544 | 0 |
| B | 0 | 544 | 0 |
| C | 0 | 544 | 0 |
| D | 0 | 544 | 0 |
| Mode M0 | |||
|---|---|---|---|
| Quadrant | BADHDUFLAG | Total packets | Discarded packets |
| A | 0 | 56597 | 0 |
| B | 0 | 57673 | 0 |
| C | 0 | 57017 | 0 |
| D | 0 | 103943 | 0 |
| Quadrant | Total seconds | Saturated seconds | Saturation percentage |
|---|---|---|---|
| A | 26700 | 449 | 1.681648% |
| B | 26700 | 544 | 2.037453% |
| C | 26700 | 640 | 2.397004% |
| D | 26700 | 4460 | 16.704120% |
Noise dominated data is calculated using 1-second bins in cleaned event files. If a bin has >2000 counts, and if more than 50% of those come from <1% of pixels, then it is considered to be noise-dominated and hence unusable.
| Quadrant | # 1 sec bins | Bins with >0 counts | Bins with >2000 counts | High rate bins dominated by noise | Noise dominated (total time) | Noise dominated (detector-on time) | Marked lightcurve |
|---|---|---|---|---|---|---|---|
| A | 32609 | 26698 | 0 | 0 | 0.00% | 0.00% |  |
| B | 32609 | 26698 | 0 | 0 | 0.00% | 0.00% |  |
| C | 32609 | 26699 | 0 | 0 | 0.00% | 0.00% | 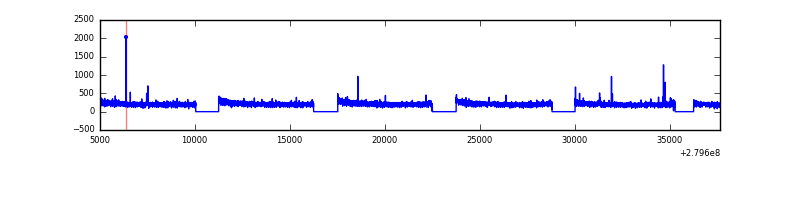 |
| D | 32609 | 26668 | 0 | 0 | 0.00% | 0.00% |  |
Top three noisy pixels from each quadrant. If the there are fewer than three noisy pixels in the level2.evt file, extra rows are filled as -1
| Pixel properties | Quadrant properties | ||||||
|---|---|---|---|---|---|---|---|
| Quadrant | DetID | PixID | Counts | Sigma | Mean | Median | Sigma |
| A | 0 | 29 | 1596 | 10.34 | 462 | 435 | 112.3 |
| A | 7 | 110 | 1397 | 8.57 | 462 | 435 | 112.3 |
| A | 0 | 30 | 1323 | 7.91 | 462 | 435 | 112.3 |
| B | 2 | 9 | 1347 | 10.16 | 453 | 435 | 89.8 |
| B | 5 | 128 | 1138 | 7.83 | 453 | 435 | 89.8 |
| B | 5 | 225 | 1121 | 7.64 | 453 | 435 | 89.8 |
| C | 1 | 80 | 1297 | 7.25 | 461 | 433 | 119.1 |
| C | 1 | 81 | 1286 | 7.16 | 461 | 433 | 119.1 |
| C | 3 | 126 | 1207 | 6.5 | 461 | 433 | 119.1 |
| D | 3 | 14 | 1032 | 6.32 | 401 | 368 | 105.0 |
| D | 6 | 231 | 1025 | 6.25 | 401 | 368 | 105.0 |
| D | 10 | 189 | 1000 | 6.02 | 401 | 368 | 105.0 |
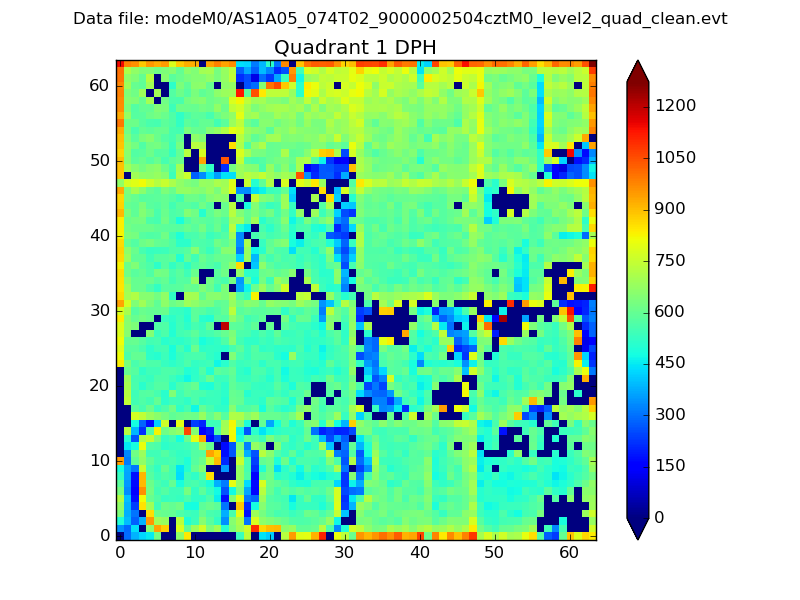
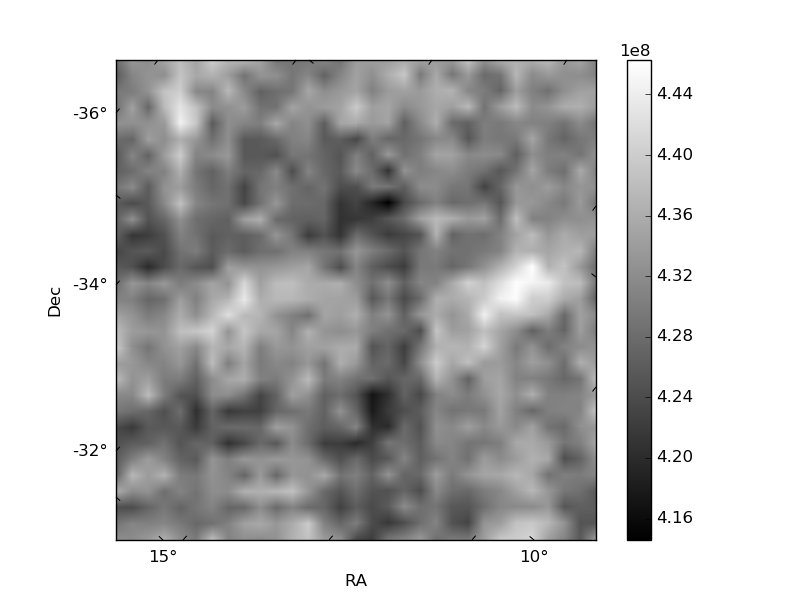
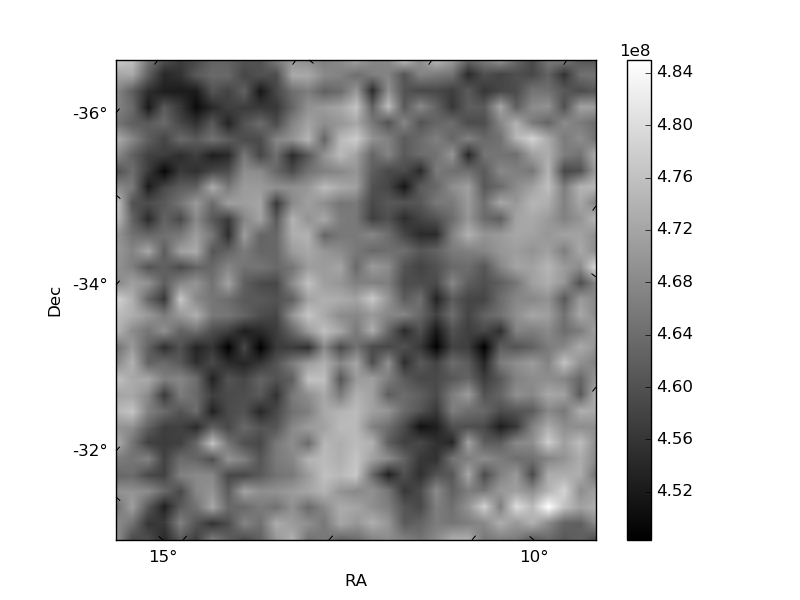
Histogram calculated using DETX and DETY for each event in the final _common_clean file
| Quadrant A |  |
 |
Quadrant B |
|---|---|---|---|
| Quadrant D | 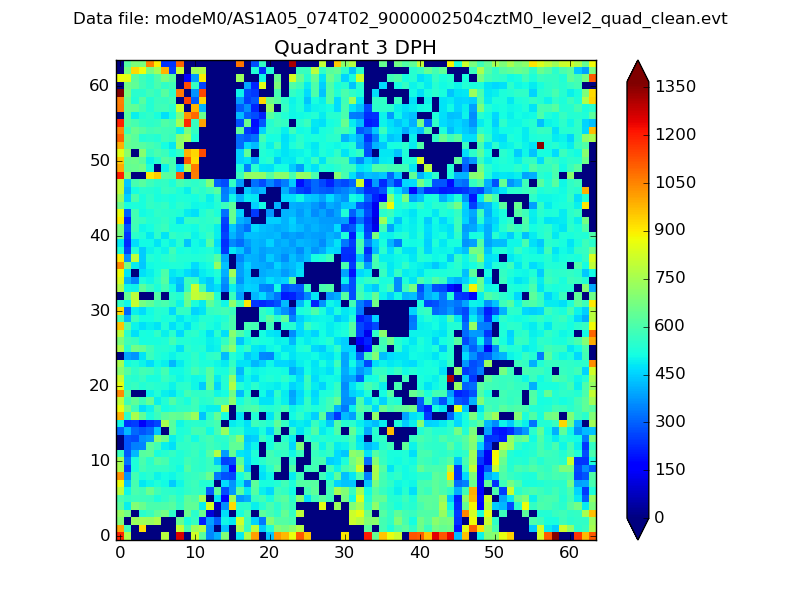 |
 |
Quadrant C |
| Plot type | Count rate plots | Images |
|---|---|---|
| Comparison with Poisson distribution Blue bars denote a histogram of data divided into 1 sec bins. Red curve is a Poisson curve with rate = median count rate of data. |
 |
 |
| Quadrant-wise count rates Data is divided into 100 sec bins |
 |
|
| Module-wise count rates for Quadrant A Data is divided into 100 sec bins |
 |
 |
| Module-wise count rates for Quadrant B Data is divided into 100 sec bins |
 |
 |
| Module-wise count rates for Quadrant C Data is divided into 100 sec bins |
 |
 |
| Module-wise count rates for Quadrant D Data is divided into 100 sec bins |
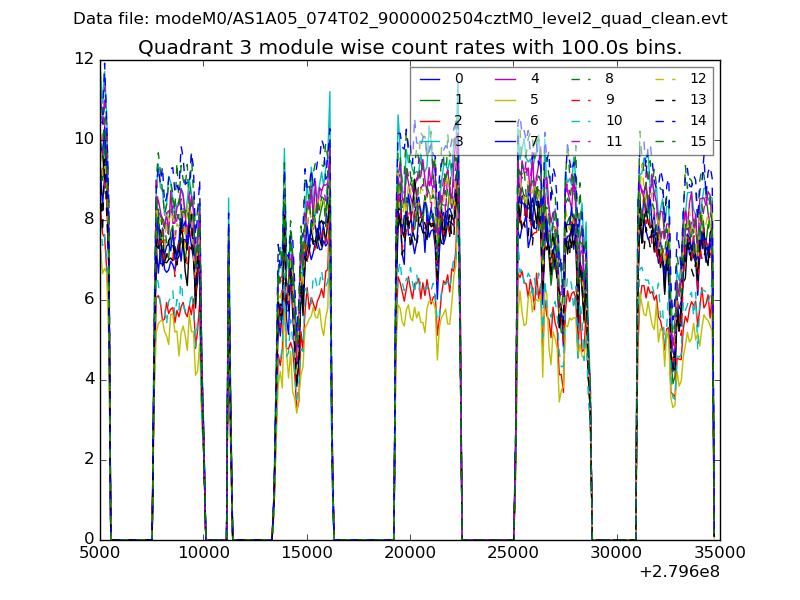 |
 |
| Parameter | Plot |
|---|---|
| CZT HV Monitor | 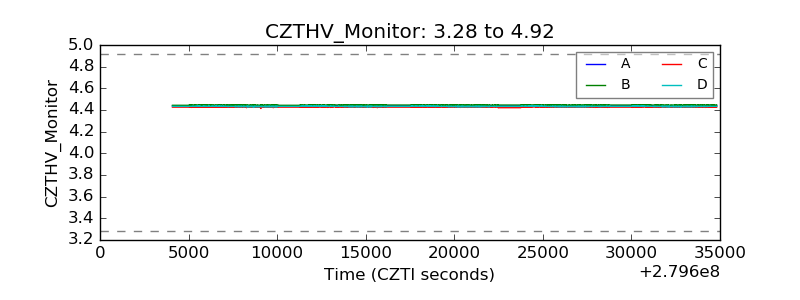 |
| D_VDD |  |
| Temperature 1 |  |
| Veto HV Monitor | 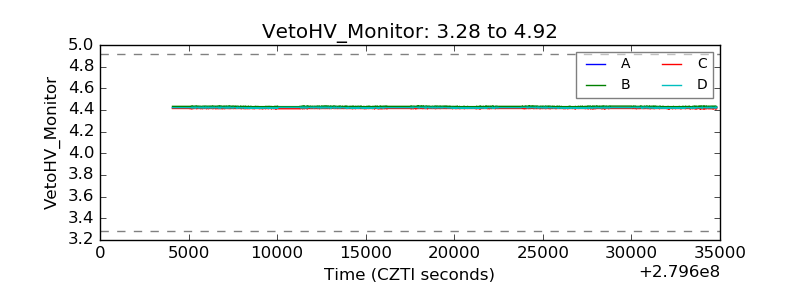 |
| Veto LLD |  |
| Alpha Counter |  |
| _CPM_Rate |  |
| CZT Counter |  |
| +2.5 Volts monitor |  |
| +5 Volts monitor |  |
| _ROLL_ROT |  |
| _Roll_DEC |  |
| _Roll_RA |  |
| Veto Counter |  |