| Param | Original file | Final file |
|---|---|---|
| Filename | modeM0/AS1A05_074T02_9000002504_16874cztM0_level2.evt | modeM0/AS1A05_074T02_9000002504_16874cztM0_level2_quad_clean.evt |
| Size (bytes) | 120,594,240 | 13,927,680 |
| Size | 115.0 MB | 13.3 MB |
| Events in quadrant A | 733,762 | 82,369 |
| Events in quadrant B | 722,282 | 87,053 |
| Events in quadrant C | 729,177 | 82,004 |
| Events in quadrant D | 1,376,017 | 72,198 |
| Mode M9 | |||
|---|---|---|---|
| Quadrant | BADHDUFLAG | Total packets | Discarded packets |
| A | 0 | 10 | 0 |
| B | 0 | 10 | 0 |
| C | 0 | 10 | 0 |
| D | 0 | 10 | 0 |
| Mode SS | |||
|---|---|---|---|
| Quadrant | BADHDUFLAG | Total packets | Discarded packets |
| A | 0 | 26 | 0 |
| B | 0 | 26 | 0 |
| C | 0 | 26 | 0 |
| D | 0 | 26 | 0 |
| Mode M0 | |||
|---|---|---|---|
| Quadrant | BADHDUFLAG | Total packets | Discarded packets |
| A | 0 | 2956 | 2 |
| B | 0 | 2924 | 1 |
| C | 0 | 2938 | 1 |
| D | 0 | 5004 | 1 |
| Quadrant | Total seconds | Saturated seconds | Saturation percentage |
|---|---|---|---|
| A | 1299 | 4 | 0.307929% |
| B | 1299 | 7 | 0.538876% |
| C | 1299 | 18 | 1.385681% |
| D | 1299 | 153 | 11.778291% |
Noise dominated data is calculated using 1-second bins in cleaned event files. If a bin has >2000 counts, and if more than 50% of those come from <1% of pixels, then it is considered to be noise-dominated and hence unusable.
| Quadrant | # 1 sec bins | Bins with >0 counts | Bins with >2000 counts | High rate bins dominated by noise | Noise dominated (total time) | Noise dominated (detector-on time) | Marked lightcurve |
|---|---|---|---|---|---|---|---|
| A | 1300 | 1300 | 0 | 0 | 0.00% | 0.00% | 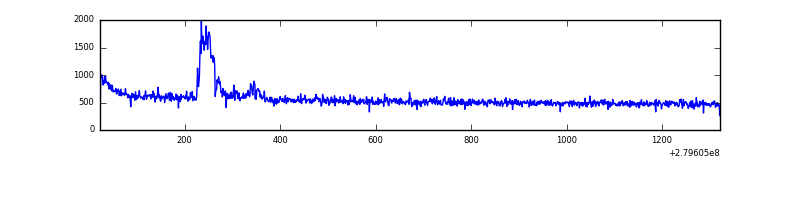 |
| B | 1300 | 1300 | 0 | 0 | 0.00% | 0.00% | 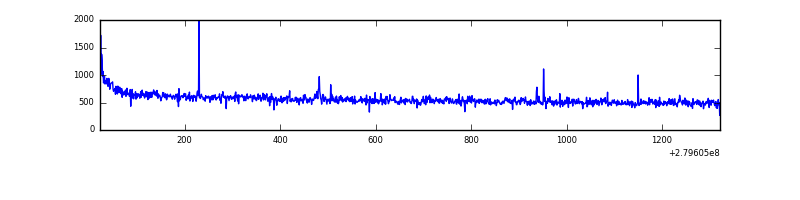 |
| C | 1300 | 1300 | 0 | 0 | 0.00% | 0.00% | 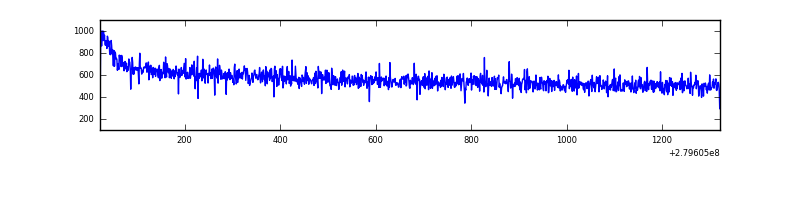 |
| D | 1300 | 1300 | 112 | 112 | 8.62% | 8.62% | 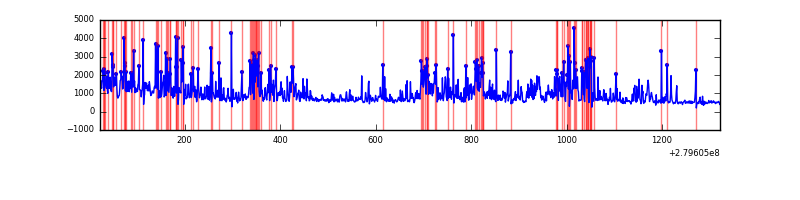 |
Top three noisy pixels from each quadrant. If the there are fewer than three noisy pixels in the level2.evt file, extra rows are filled as -1
| Pixel properties | Quadrant properties | ||||||
|---|---|---|---|---|---|---|---|
| Quadrant | DetID | PixID | Counts | Sigma | Mean | Median | Sigma |
| A | 15 | 174 | 44995 | 1219.11 | 178 | 175 | 36.8 |
| A | 12 | 189 | 1788 | 43.87 | 178 | 175 | 36.8 |
| A | 0 | 226 | 1467 | 35.14 | 178 | 175 | 36.8 |
| B | 12 | 111 | 3899 | 103.57 | 183 | 179 | 35.9 |
| B | 11 | 111 | 3356 | 88.45 | 183 | 179 | 35.9 |
| B | 4 | 173 | 3226 | 84.83 | 183 | 179 | 35.9 |
| C | 14 | 238 | 27544 | 634.47 | 179 | 180 | 43.1 |
| C | 13 | 61 | 1243 | 24.65 | 179 | 180 | 43.1 |
| C | 3 | 233 | 1049 | 20.15 | 179 | 180 | 43.1 |
| D | 1 | 52 | 729688 | 16931.61 | 170 | 165 | 43.1 |
| D | 2 | 234 | 4260 | 95.04 | 170 | 165 | 43.1 |
| D | 15 | 145 | 2200 | 47.23 | 170 | 165 | 43.1 |
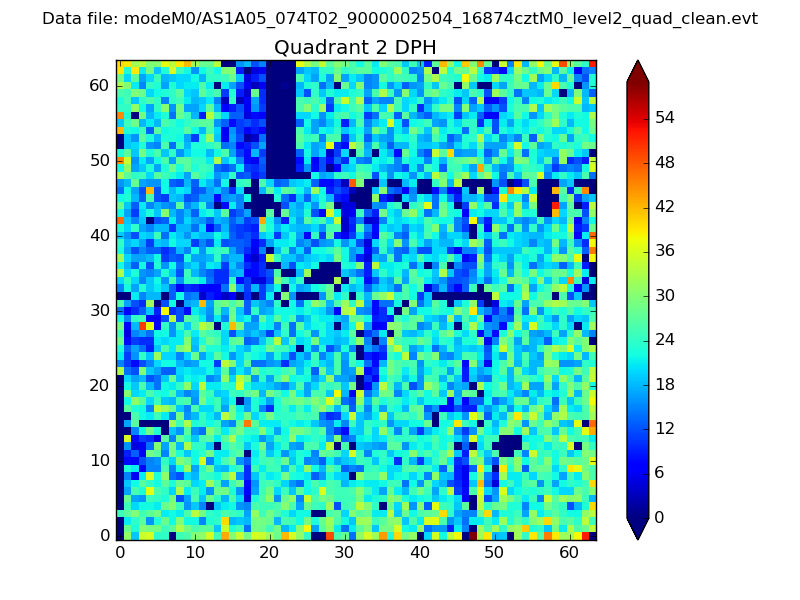
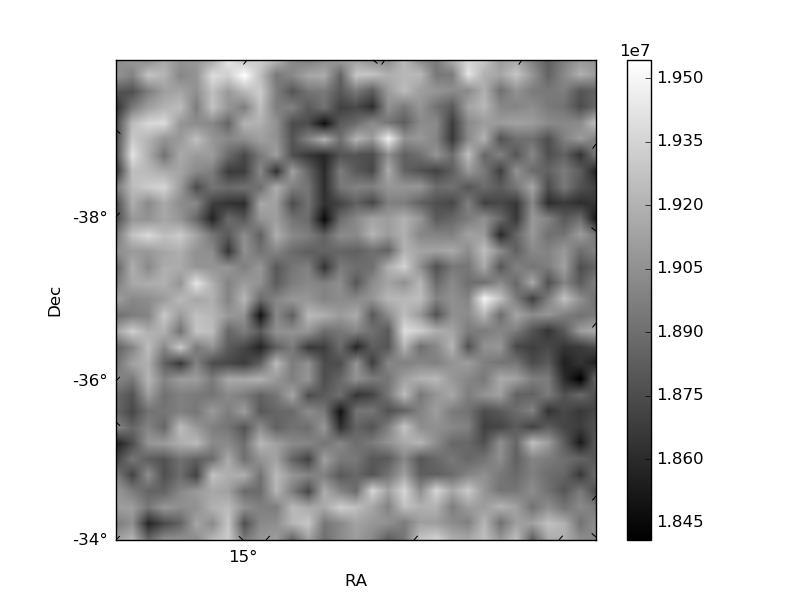
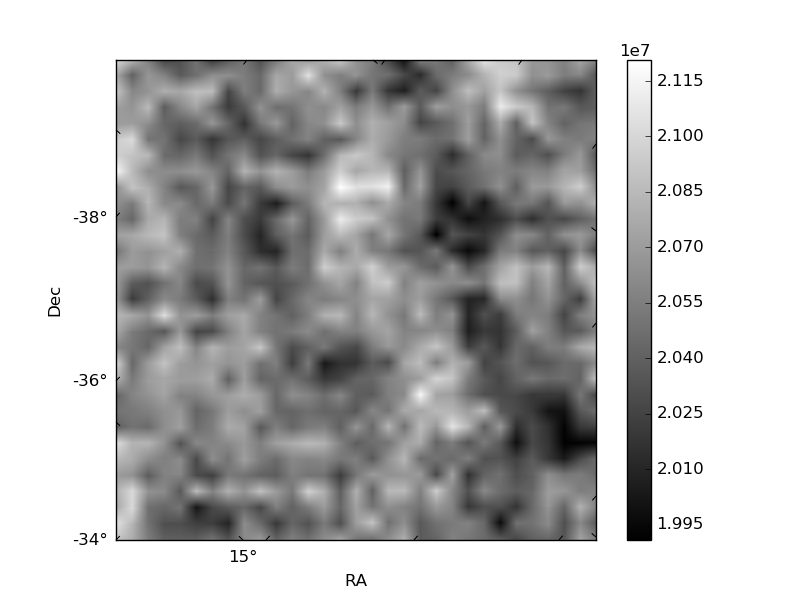
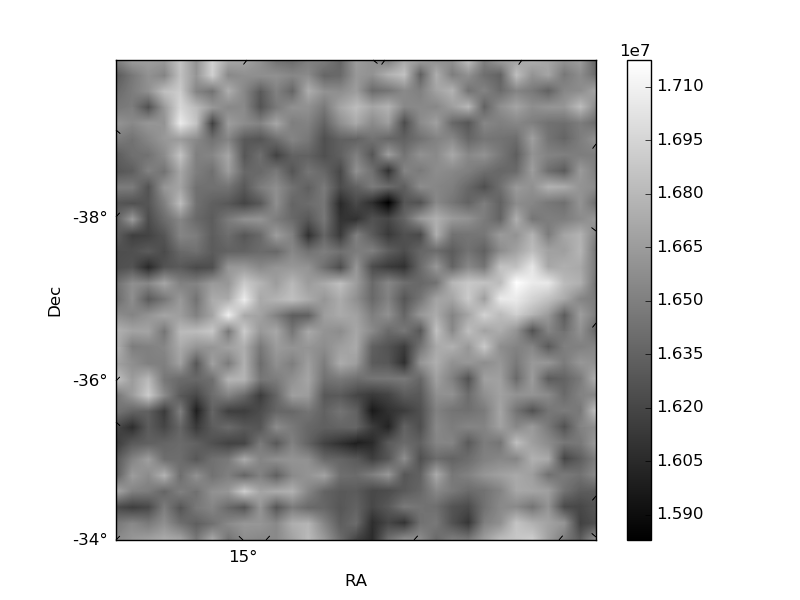
Histogram calculated using DETX and DETY for each event in the final _common_clean file
| Quadrant A | 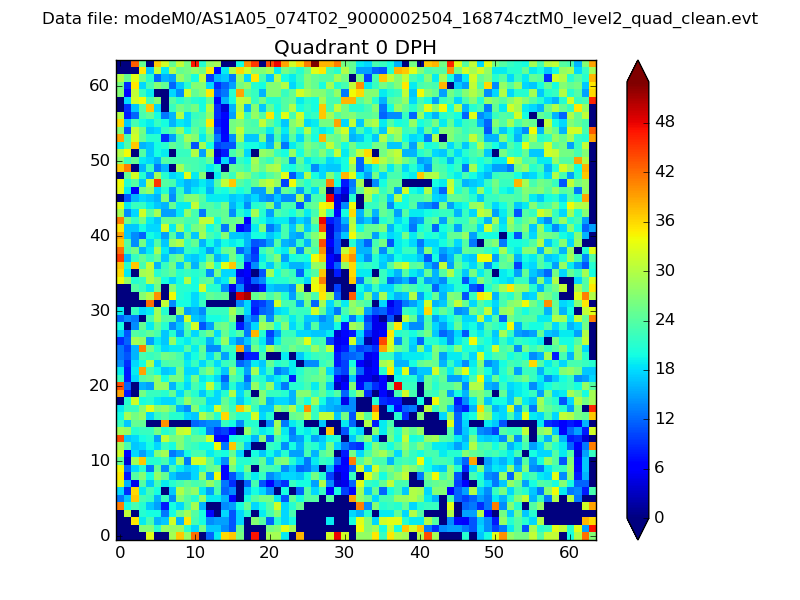 |
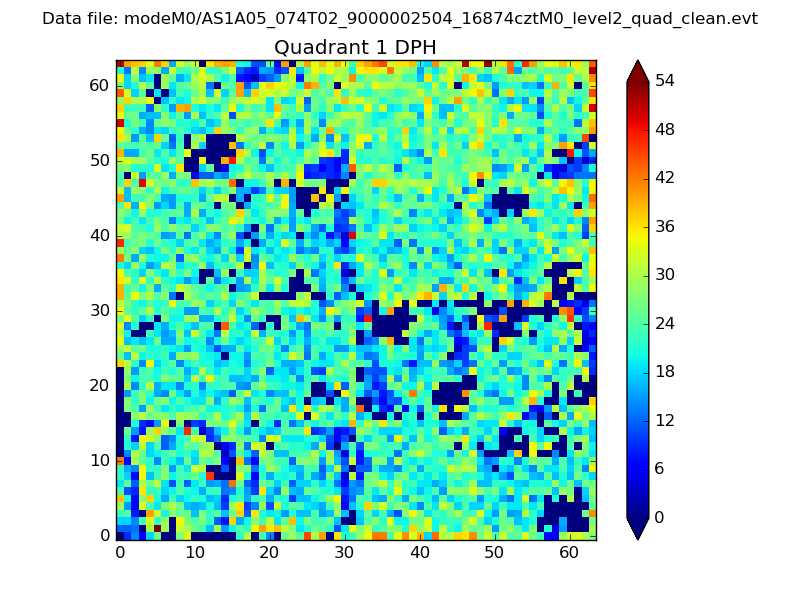 |
Quadrant B |
|---|---|---|---|
| Quadrant D | 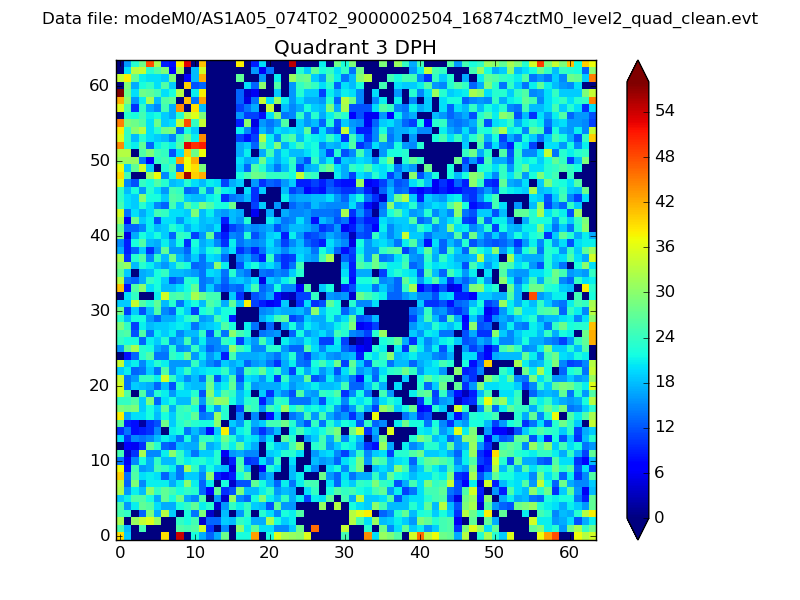 |
 |
Quadrant C |
| Plot type | Count rate plots | Images |
|---|---|---|
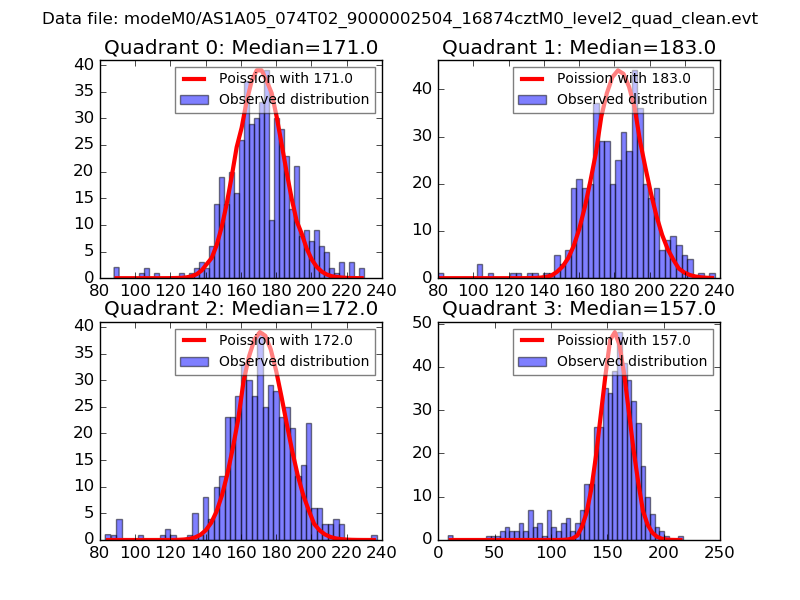
| Comparison with Poisson distribution Blue bars denote a histogram of data divided into 1 sec bins. Red curve is a Poisson curve with rate = median count rate of data. |
 |
 |
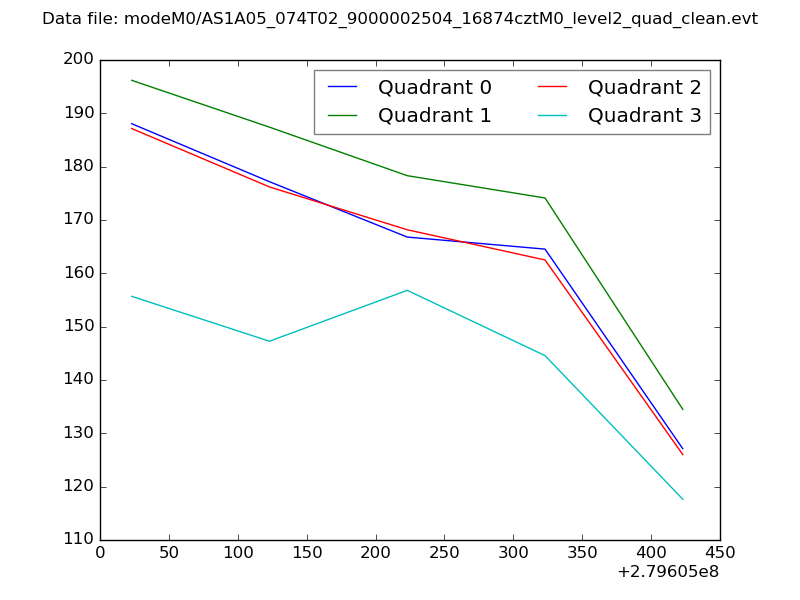
| Quadrant-wise count rates Data is divided into 100 sec bins |
 |
|
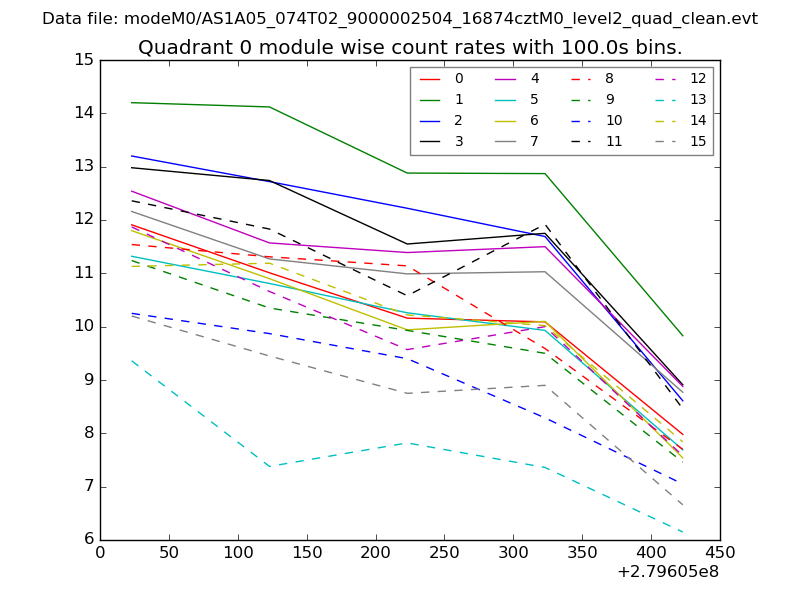
| Module-wise count rates for Quadrant A Data is divided into 100 sec bins |
 |
 |
| Module-wise count rates for Quadrant B Data is divided into 100 sec bins |
 |
 |
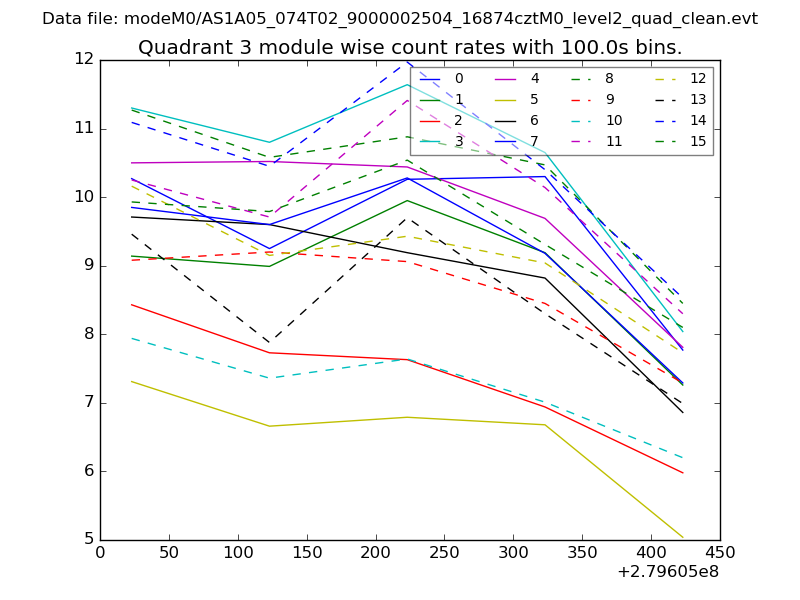
| Module-wise count rates for Quadrant C Data is divided into 100 sec bins |
 |
 |
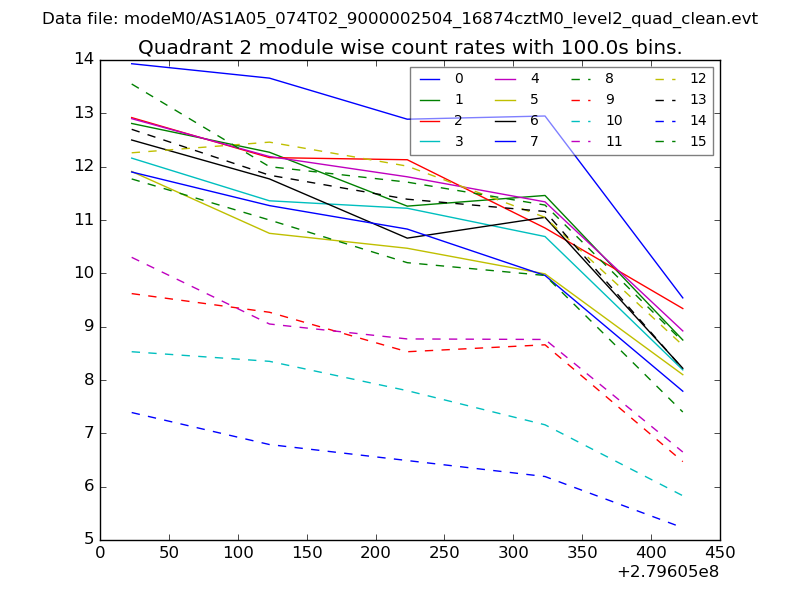
| Module-wise count rates for Quadrant D Data is divided into 100 sec bins |
 |
 |
| Parameter | Plot |
|---|---|
| CZT HV Monitor | 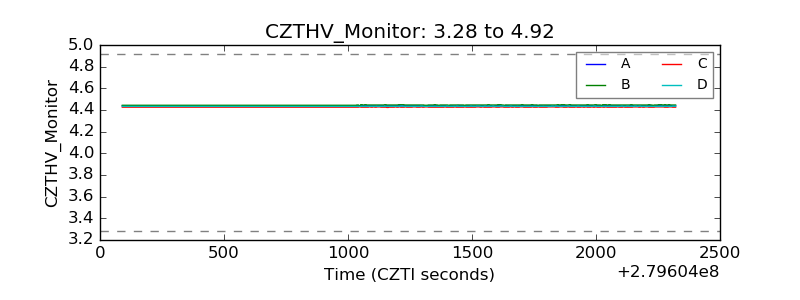 |
| D_VDD | 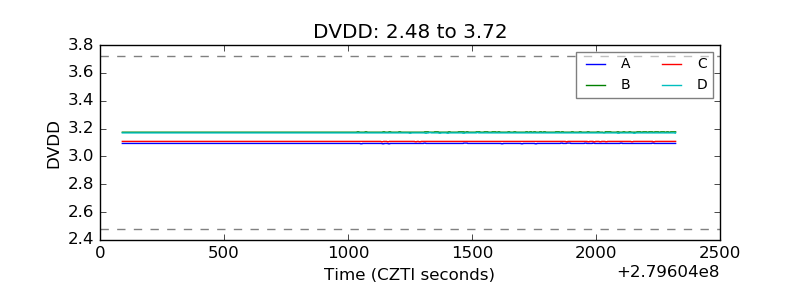 |
| Temperature 1 | 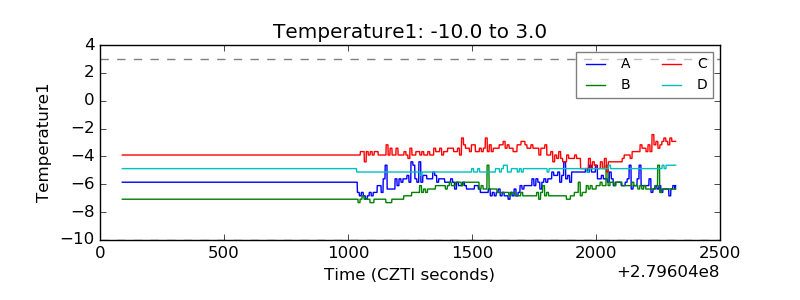 |
| Veto HV Monitor | 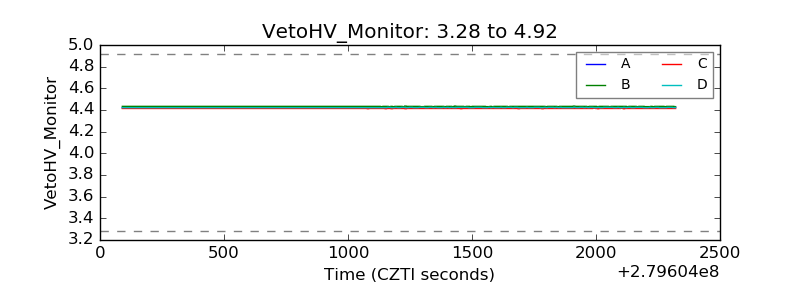 |
| Veto LLD | 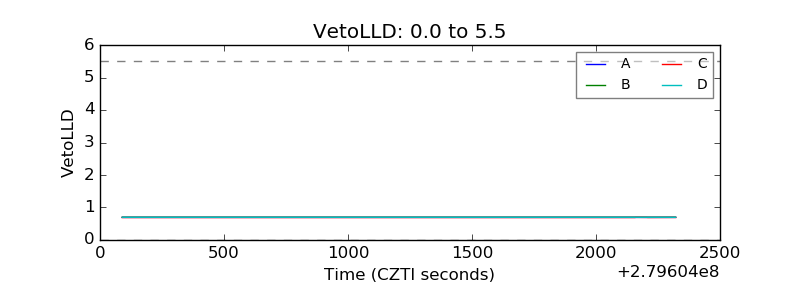 |
| Alpha Counter | 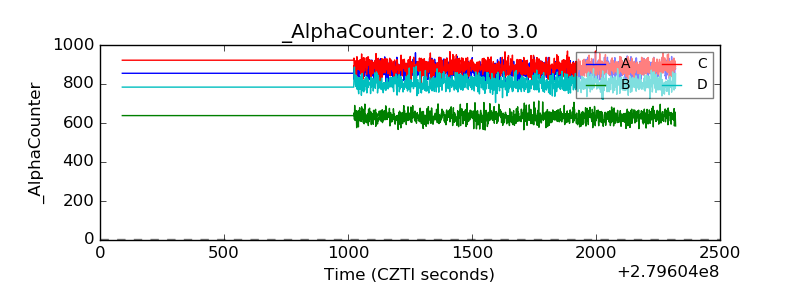 |
| _CPM_Rate | 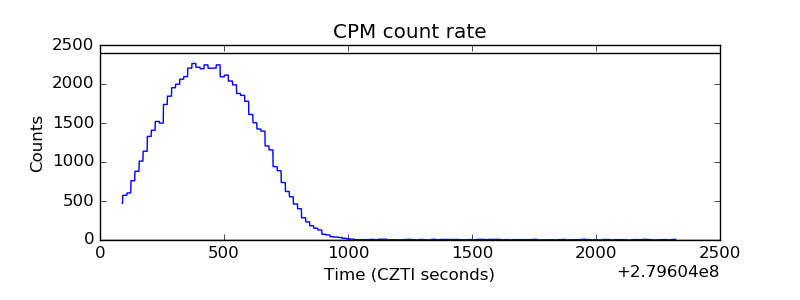 |
| CZT Counter | 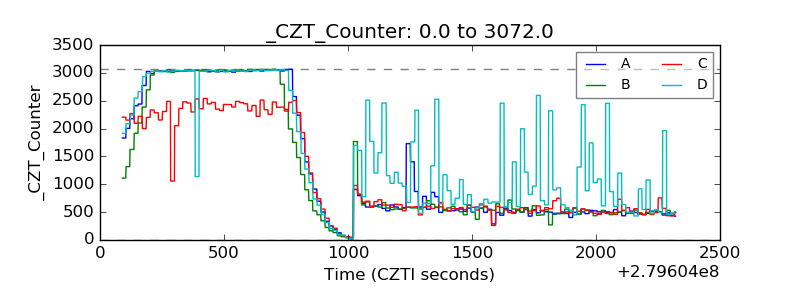 |
| +2.5 Volts monitor |  |
| +5 Volts monitor |  |
| _ROLL_ROT | 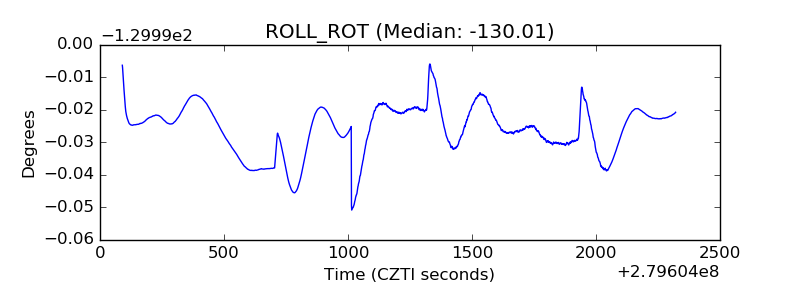 |
| _Roll_DEC | 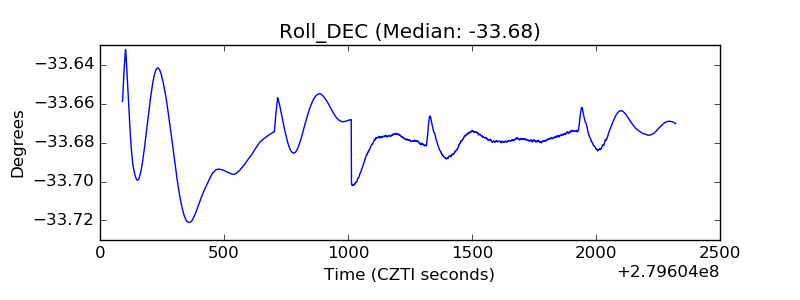 |
| _Roll_RA | 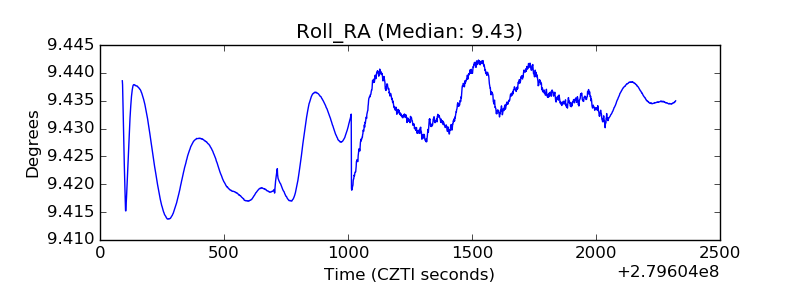 |
| Veto Counter | 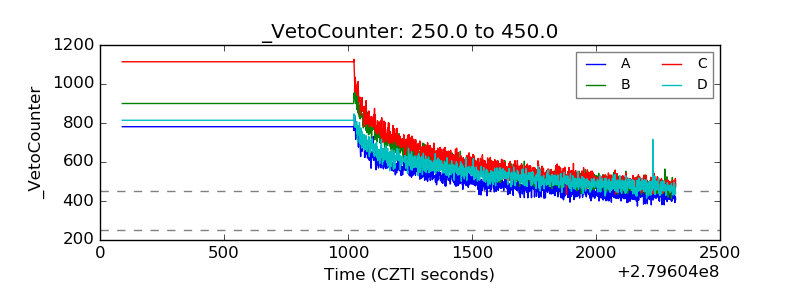 |