| Param | Original file | Final file |
|---|---|---|
| Filename | modeM0/AS1A05_074T02_9000002504_16877cztM0_level2.evt | modeM0/AS1A05_074T02_9000002504_16877cztM0_level2_quad_clean.evt |
| Size (bytes) | 524,088,000 | 71,663,040 |
| Size | 499.8 MB | 68.3 MB |
| Events in quadrant A | 3,335,938 | 440,318 |
| Events in quadrant B | 3,416,772 | 447,936 |
| Events in quadrant C | 3,377,862 | 431,116 |
| Events in quadrant D | 5,315,520 | 412,057 |
| Mode M9 | |||
|---|---|---|---|
| Quadrant | BADHDUFLAG | Total packets | Discarded packets |
| A | 0 | 15 | 0 |
| B | 0 | 15 | 0 |
| C | 0 | 15 | 0 |
| D | 0 | 16 | 0 |
| Mode SS | |||
|---|---|---|---|
| Quadrant | BADHDUFLAG | Total packets | Discarded packets |
| A | 0 | 128 | 0 |
| B | 0 | 128 | 0 |
| C | 0 | 128 | 0 |
| D | 0 | 128 | 0 |
| Mode M0 | |||
|---|---|---|---|
| Quadrant | BADHDUFLAG | Total packets | Discarded packets |
| A | 0 | 13666 | 3 |
| B | 0 | 13945 | 2 |
| C | 0 | 13943 | 2 |
| D | 0 | 20089 | 2 |
| Quadrant | Total seconds | Saturated seconds | Saturation percentage |
|---|---|---|---|
| A | 6279 | 128 | 2.038541% |
| B | 6279 | 148 | 2.357063% |
| C | 6279 | 172 | 2.739290% |
| D | 6279 | 476 | 7.580825% |
Noise dominated data is calculated using 1-second bins in cleaned event files. If a bin has >2000 counts, and if more than 50% of those come from <1% of pixels, then it is considered to be noise-dominated and hence unusable.
| Quadrant | # 1 sec bins | Bins with >0 counts | Bins with >2000 counts | High rate bins dominated by noise | Noise dominated (total time) | Noise dominated (detector-on time) | Marked lightcurve |
|---|---|---|---|---|---|---|---|
| A | 7530 | 6280 | 0 | 0 | 0.00% | 0.00% | 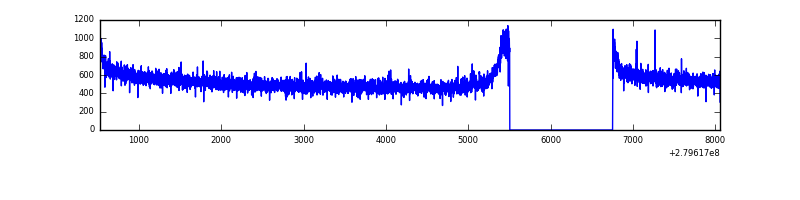 |
| B | 7530 | 6280 | 4 | 4 | 0.05% | 0.06% | 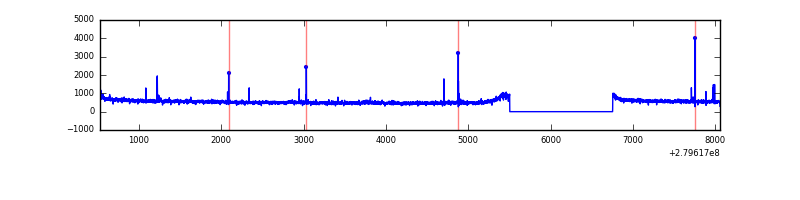 |
| C | 7530 | 6281 | 0 | 0 | 0.00% | 0.00% | 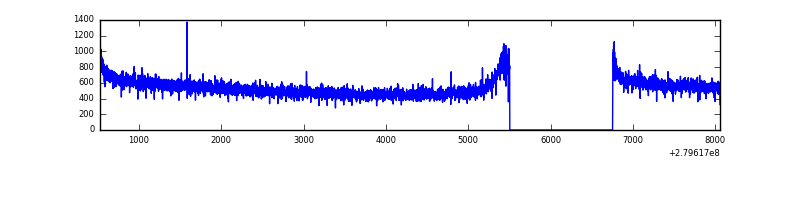 |
| D | 7530 | 6281 | 279 | 279 | 3.71% | 4.44% | 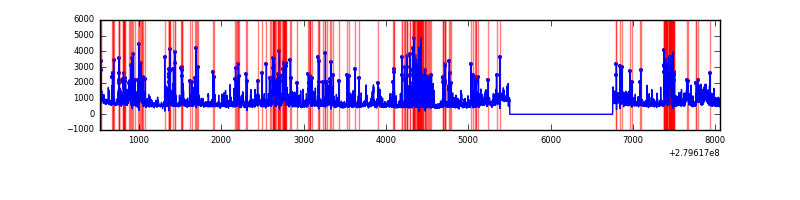 |
Top three noisy pixels from each quadrant. If the there are fewer than three noisy pixels in the level2.evt file, extra rows are filled as -1
| Pixel properties | Quadrant properties | ||||||
|---|---|---|---|---|---|---|---|
| Quadrant | DetID | PixID | Counts | Sigma | Mean | Median | Sigma |
| A | 12 | 189 | 15098 | 82.52 | 863 | 848 | 172.7 |
| A | 0 | 226 | 7942 | 41.08 | 863 | 848 | 172.7 |
| A | 12 | 194 | 6291 | 31.52 | 863 | 848 | 172.7 |
| B | 12 | 111 | 18704 | 111.06 | 862 | 842 | 160.8 |
| B | 11 | 111 | 16140 | 95.12 | 862 | 842 | 160.8 |
| B | 14 | 111 | 14140 | 82.68 | 862 | 842 | 160.8 |
| C | 14 | 238 | 131308 | 681.74 | 831 | 839 | 191.4 |
| C | 13 | 61 | 5950 | 26.71 | 831 | 839 | 191.4 |
| C | 3 | 233 | 3984 | 16.43 | 831 | 839 | 191.4 |
| D | 1 | 52 | 2032933 | 10284.03 | 825 | 802 | 197.6 |
| D | 7 | 207 | 101104 | 507.6 | 825 | 802 | 197.6 |
| D | 11 | 66 | 37742 | 186.94 | 825 | 802 | 197.6 |
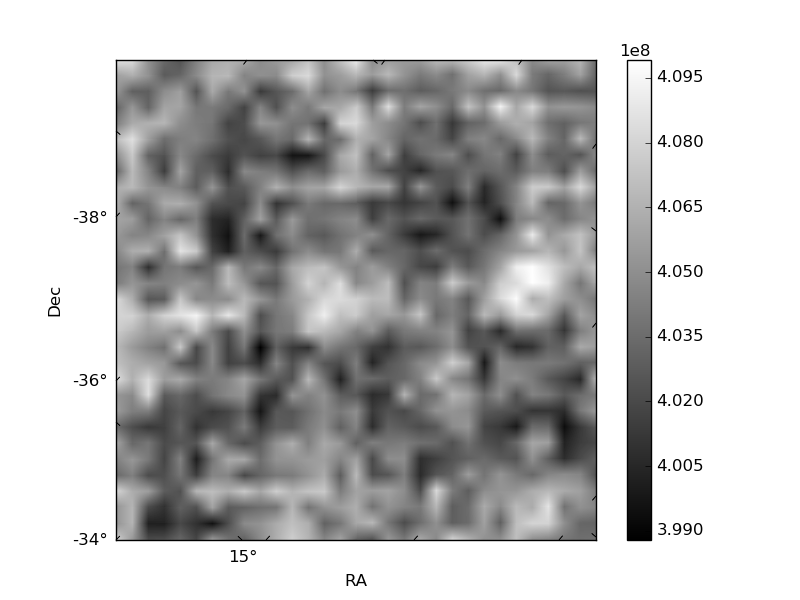
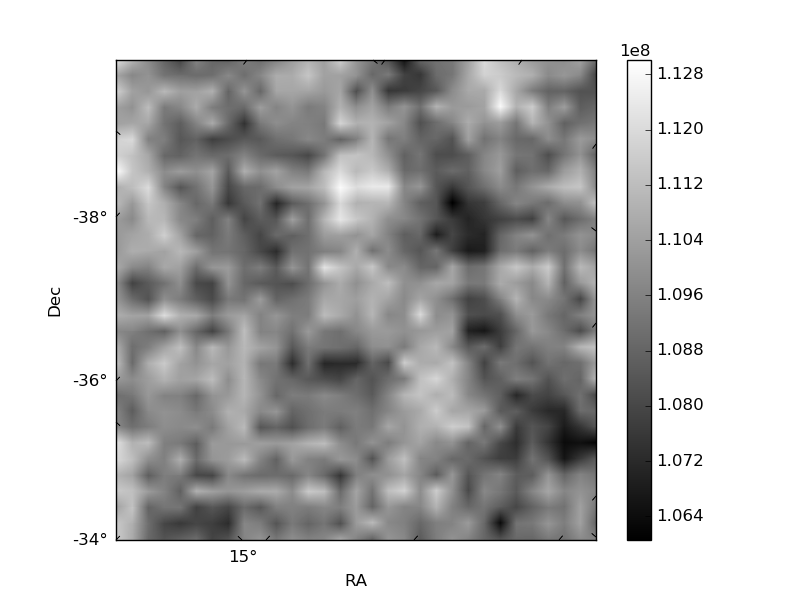
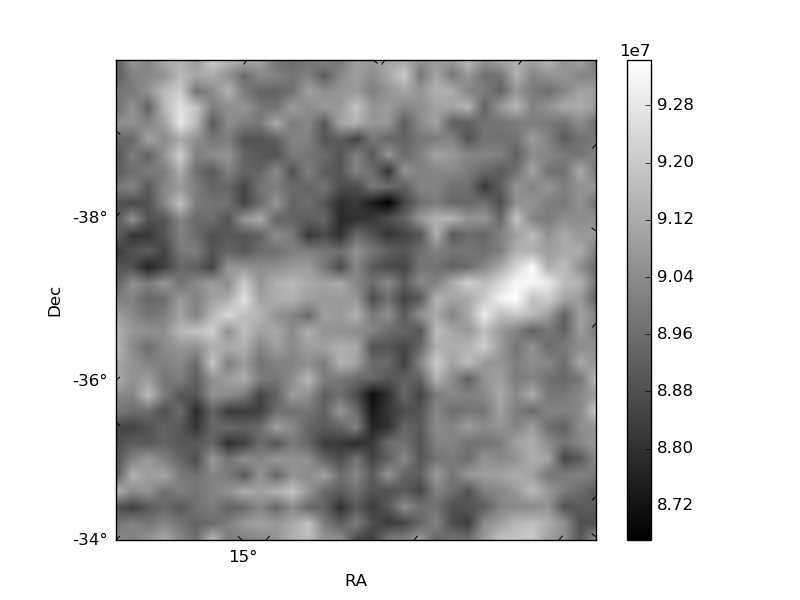
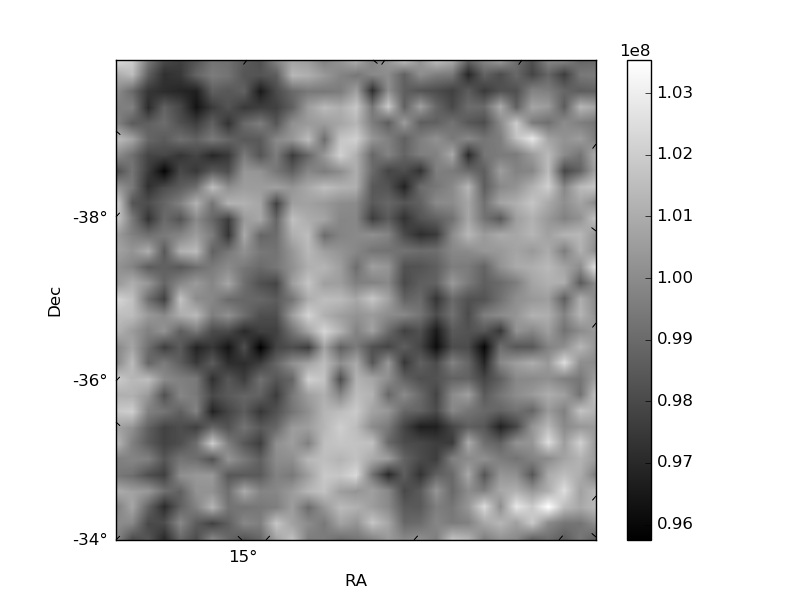
Histogram calculated using DETX and DETY for each event in the final _common_clean file
| Quadrant A | 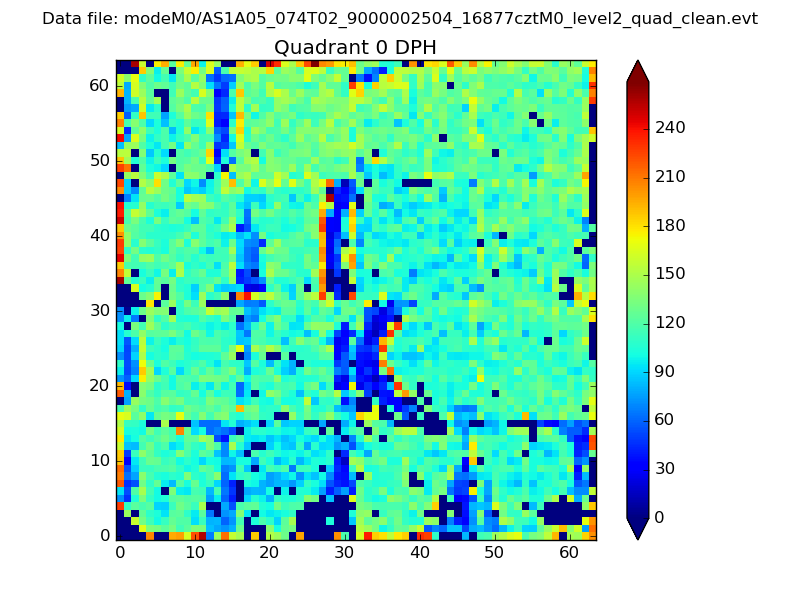 |
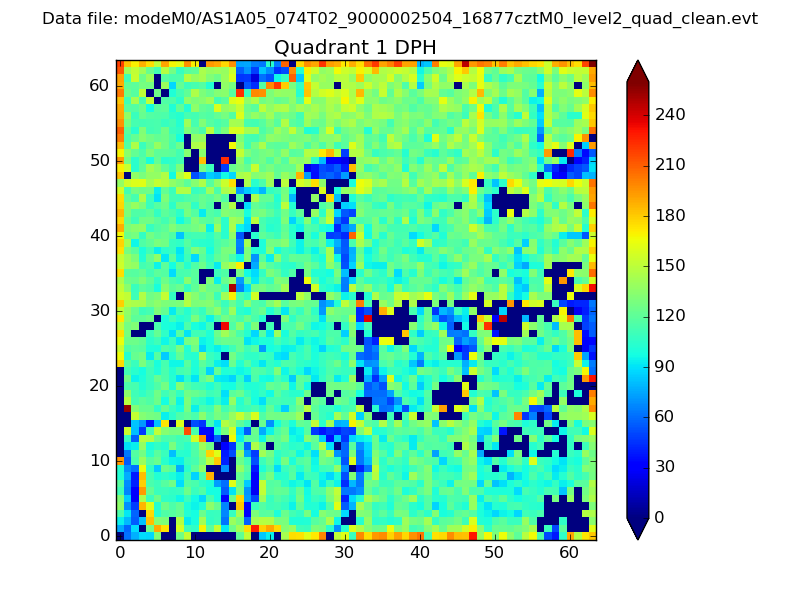 |
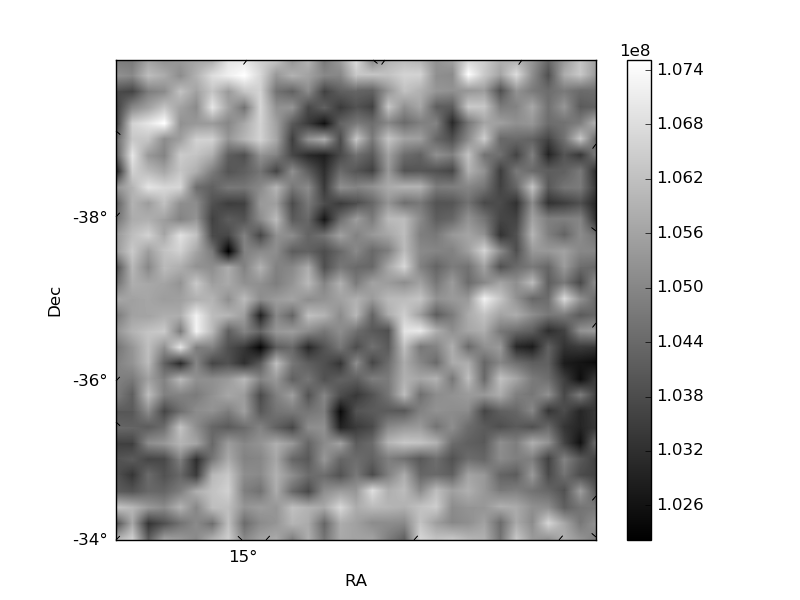
Quadrant B |
|---|---|---|---|
| Quadrant D |  |
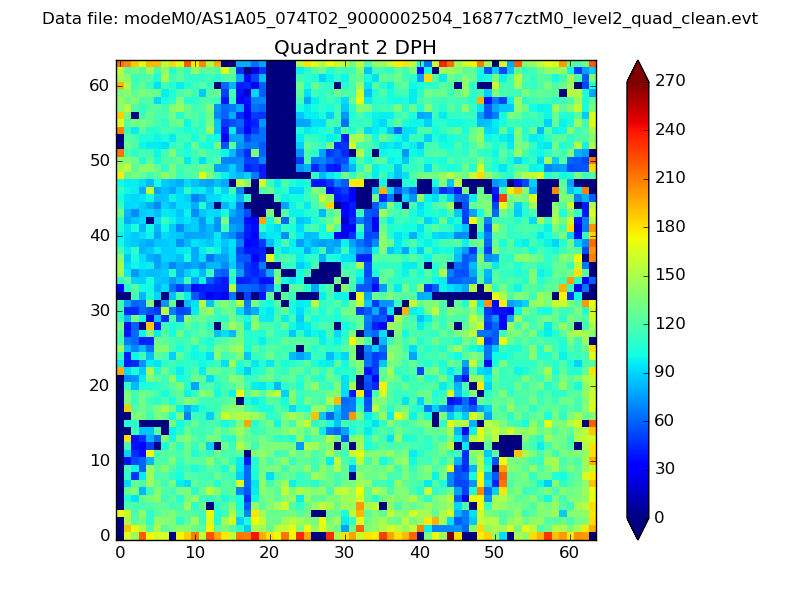 |
Quadrant C |
| Plot type | Count rate plots | Images |
|---|---|---|
| Comparison with Poisson distribution Blue bars denote a histogram of data divided into 1 sec bins. Red curve is a Poisson curve with rate = median count rate of data. |
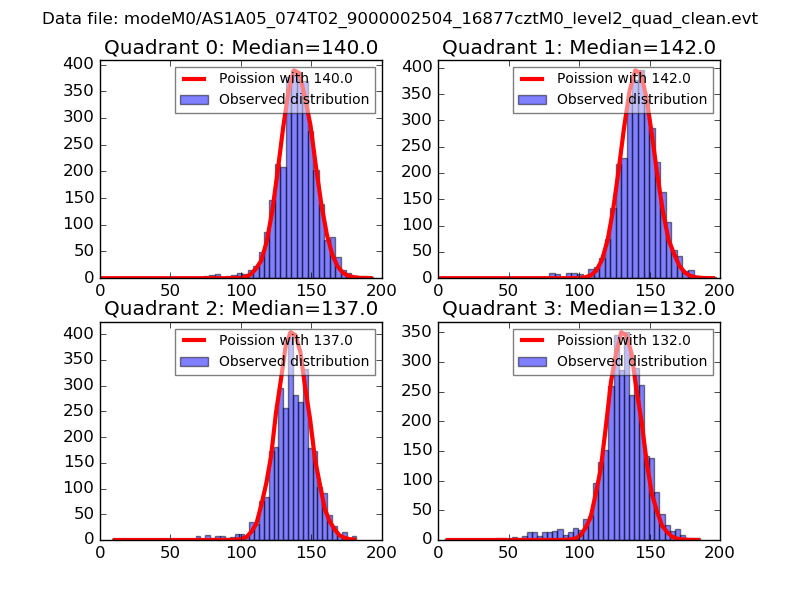 |
 |
| Quadrant-wise count rates Data is divided into 100 sec bins |
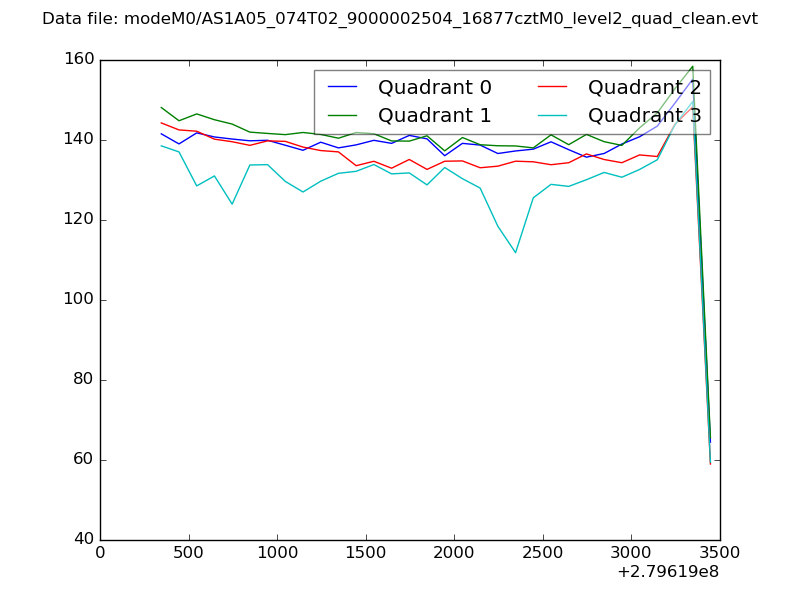 |
|
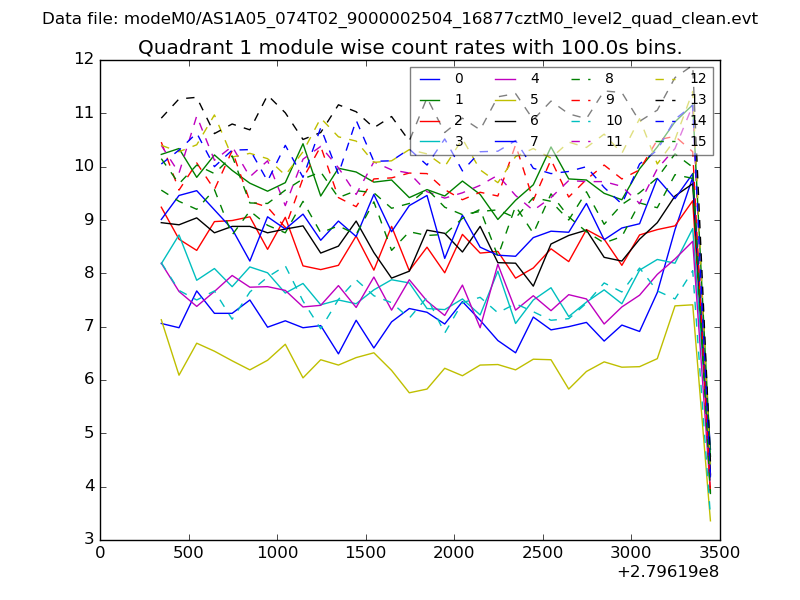
| Module-wise count rates for Quadrant A Data is divided into 100 sec bins |
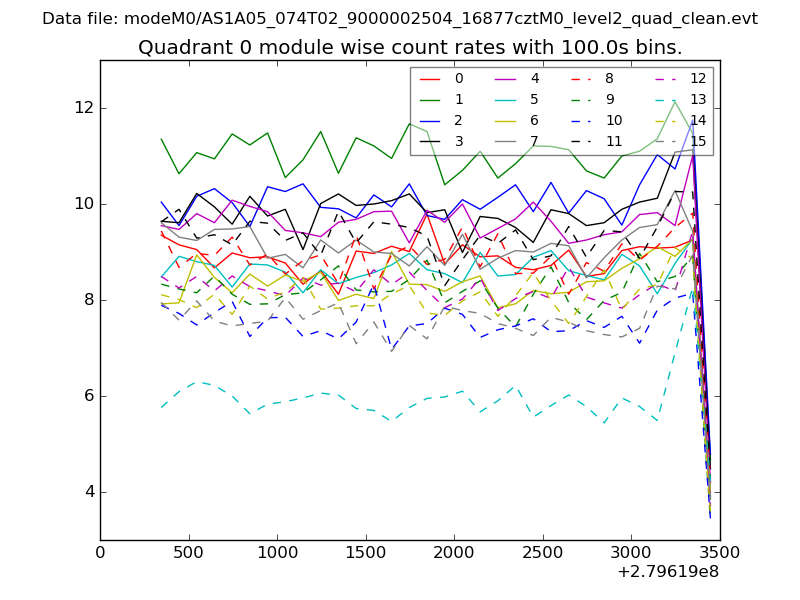 |
 |
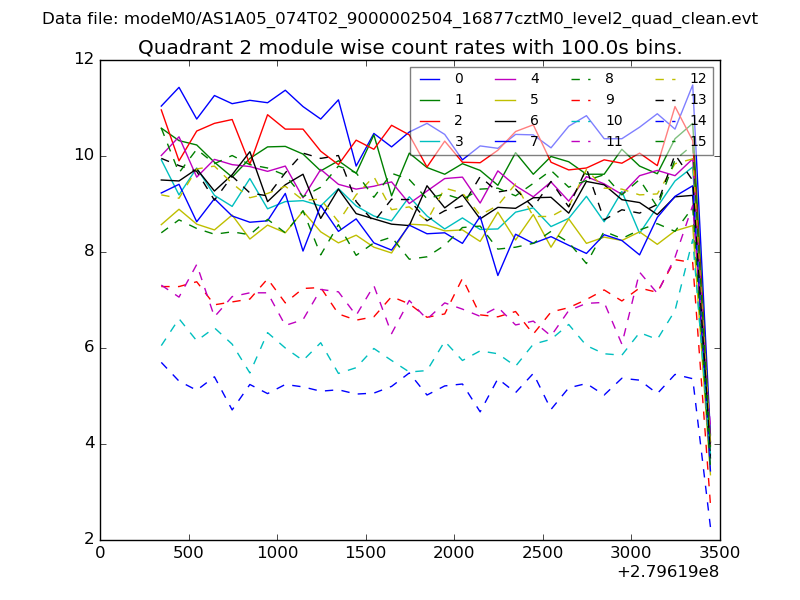
| Module-wise count rates for Quadrant B Data is divided into 100 sec bins |
 |
 |
| Module-wise count rates for Quadrant C Data is divided into 100 sec bins |
 |
 |
| Module-wise count rates for Quadrant D Data is divided into 100 sec bins |
 |
 |
| Parameter | Plot |
|---|---|
| CZT HV Monitor | 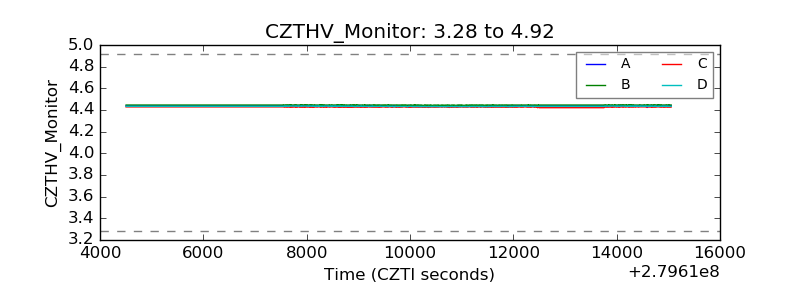 |
| D_VDD | 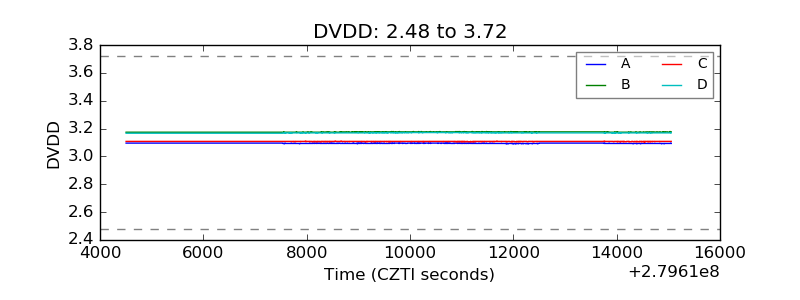 |
| Temperature 1 | 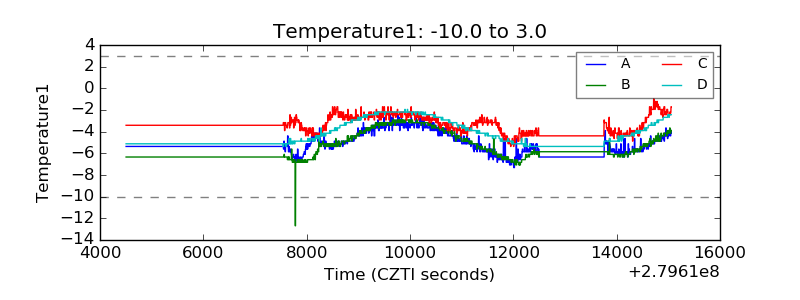 |
| Veto HV Monitor | 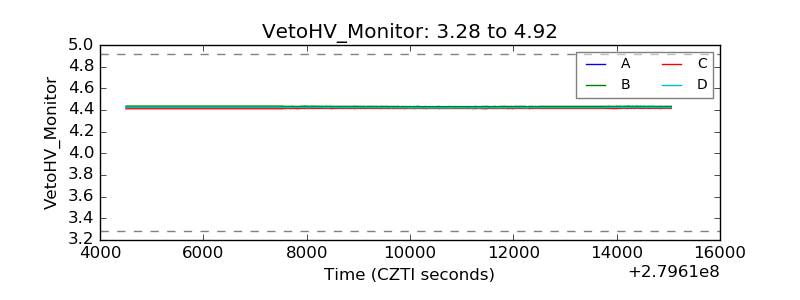 |
| Veto LLD |  |
| Alpha Counter |  |
| _CPM_Rate | 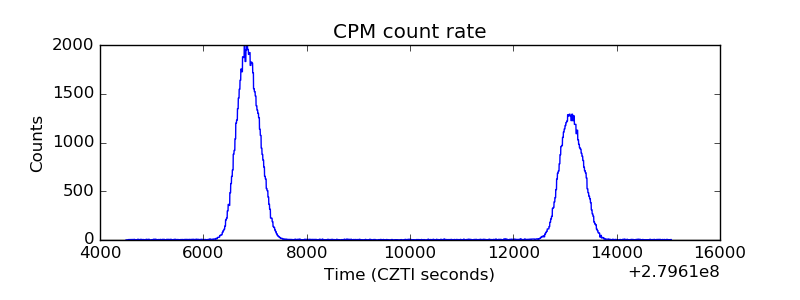 |
| CZT Counter | 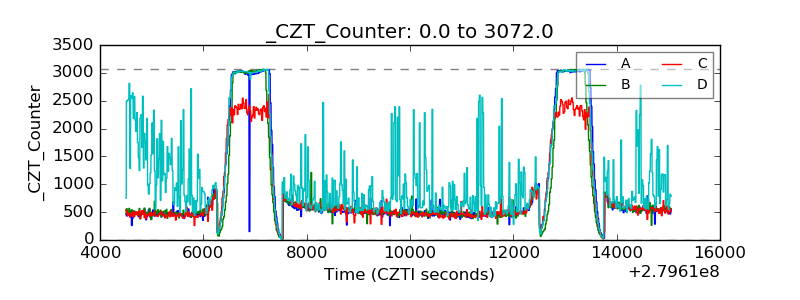 |
| +2.5 Volts monitor |  |
| +5 Volts monitor | 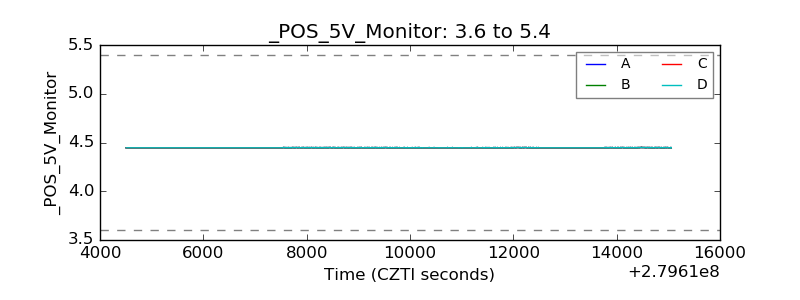 |
| _ROLL_ROT | 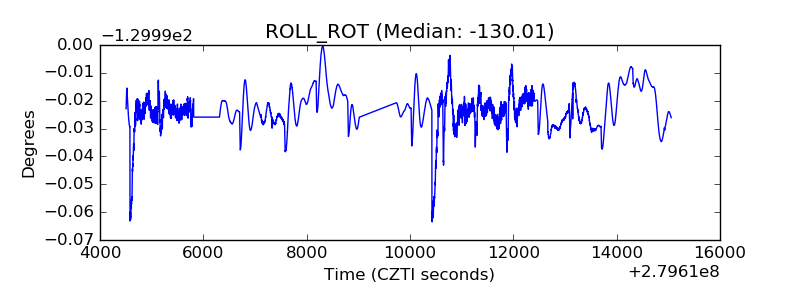 |
| _Roll_DEC |  |
| _Roll_RA | 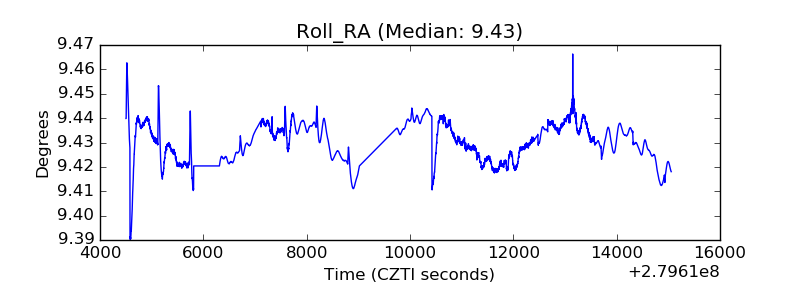 |
| Veto Counter | 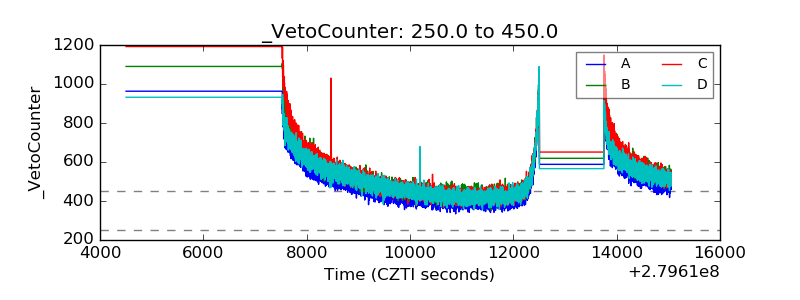 |