| Param | Original file | Final file |
|---|---|---|
| Filename | modeM0/AS1A05_074T02_9000002504_16878cztM0_level2.evt | modeM0/AS1A05_074T02_9000002504_16878cztM0_level2_quad_clean.evt |
| Size (bytes) | 580,674,240 | 87,963,840 |
| Size | 553.8 MB | 83.9 MB |
| Events in quadrant A | 3,478,352 | 569,456 |
| Events in quadrant B | 3,552,582 | 582,911 |
| Events in quadrant C | 3,487,672 | 557,122 |
| Events in quadrant D | 6,619,969 | 493,594 |
| Mode M9 | |||
|---|---|---|---|
| Quadrant | BADHDUFLAG | Total packets | Discarded packets |
| A | 0 | 24 | 0 |
| B | 0 | 24 | 0 |
| C | 0 | 24 | 0 |
| D | 0 | 24 | 0 |
| Mode SS | |||
|---|---|---|---|
| Quadrant | BADHDUFLAG | Total packets | Discarded packets |
| A | 0 | 136 | 0 |
| B | 0 | 136 | 0 |
| C | 0 | 136 | 0 |
| D | 0 | 136 | 0 |
| Mode M0 | |||
|---|---|---|---|
| Quadrant | BADHDUFLAG | Total packets | Discarded packets |
| A | 0 | 14338 | 3 |
| B | 0 | 14496 | 2 |
| C | 0 | 14451 | 2 |
| D | 0 | 24211 | 2 |
| Quadrant | Total seconds | Saturated seconds | Saturation percentage |
|---|---|---|---|
| A | 6596 | 225 | 3.411158% |
| B | 6596 | 256 | 3.881140% |
| C | 6596 | 281 | 4.260158% |
| D | 6596 | 1036 | 15.706489% |
Noise dominated data is calculated using 1-second bins in cleaned event files. If a bin has >2000 counts, and if more than 50% of those come from <1% of pixels, then it is considered to be noise-dominated and hence unusable.
| Quadrant | # 1 sec bins | Bins with >0 counts | Bins with >2000 counts | High rate bins dominated by noise | Noise dominated (total time) | Noise dominated (detector-on time) | Marked lightcurve |
|---|---|---|---|---|---|---|---|
| A | 9062 | 6598 | 0 | 0 | 0.00% | 0.00% | 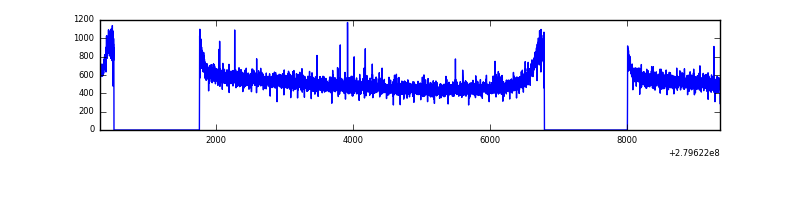 |
| B | 9062 | 6598 | 2 | 2 | 0.02% | 0.03% | 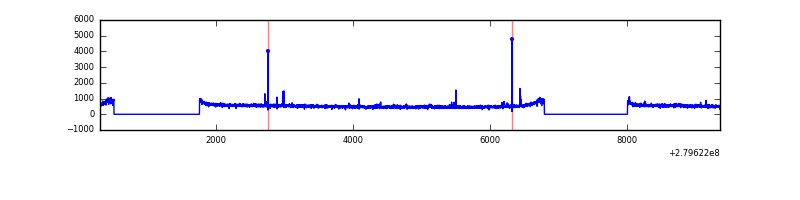 |
| C | 9062 | 6599 | 0 | 0 | 0.00% | 0.00% |  |
| D | 9062 | 6599 | 671 | 671 | 7.40% | 10.17% | 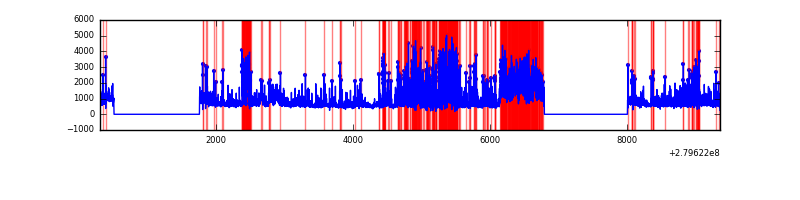 |
Top three noisy pixels from each quadrant. If the there are fewer than three noisy pixels in the level2.evt file, extra rows are filled as -1
| Pixel properties | Quadrant properties | ||||||
|---|---|---|---|---|---|---|---|
| Quadrant | DetID | PixID | Counts | Sigma | Mean | Median | Sigma |
| A | 12 | 189 | 12452 | 64.55 | 898 | 880 | 179.3 |
| A | 0 | 23 | 10412 | 53.17 | 898 | 880 | 179.3 |
| A | 0 | 226 | 8494 | 42.47 | 898 | 880 | 179.3 |
| B | 12 | 111 | 20118 | 113.69 | 892 | 871 | 169.3 |
| B | 11 | 111 | 17446 | 97.91 | 892 | 871 | 169.3 |
| B | 15 | 35 | 16156 | 90.29 | 892 | 871 | 169.3 |
| C | 14 | 238 | 133442 | 663.69 | 859 | 864 | 199.8 |
| C | 13 | 61 | 6056 | 25.99 | 859 | 864 | 199.8 |
| C | 3 | 233 | 4641 | 18.91 | 859 | 864 | 199.8 |
| D | 1 | 52 | 3043142 | 15263.56 | 825 | 801 | 199.3 |
| D | 11 | 66 | 310876 | 1555.66 | 825 | 801 | 199.3 |
| D | 7 | 207 | 101847 | 506.95 | 825 | 801 | 199.3 |
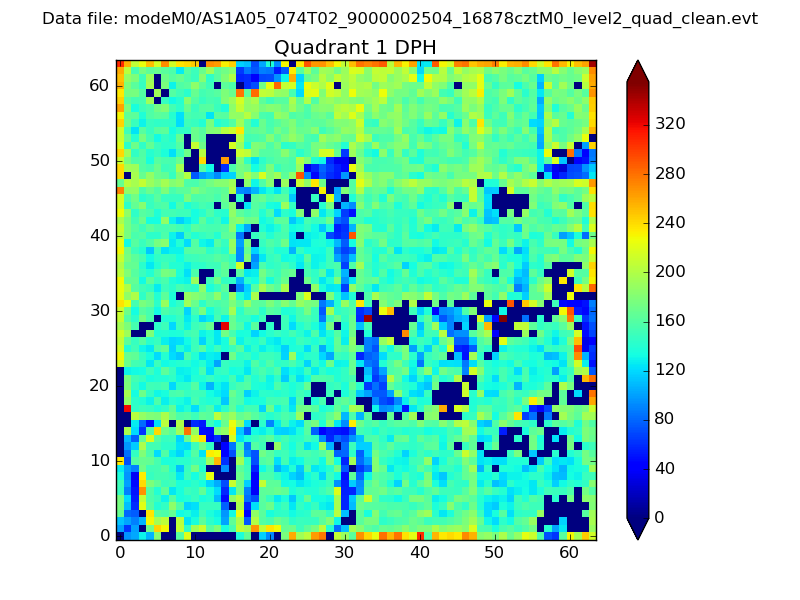
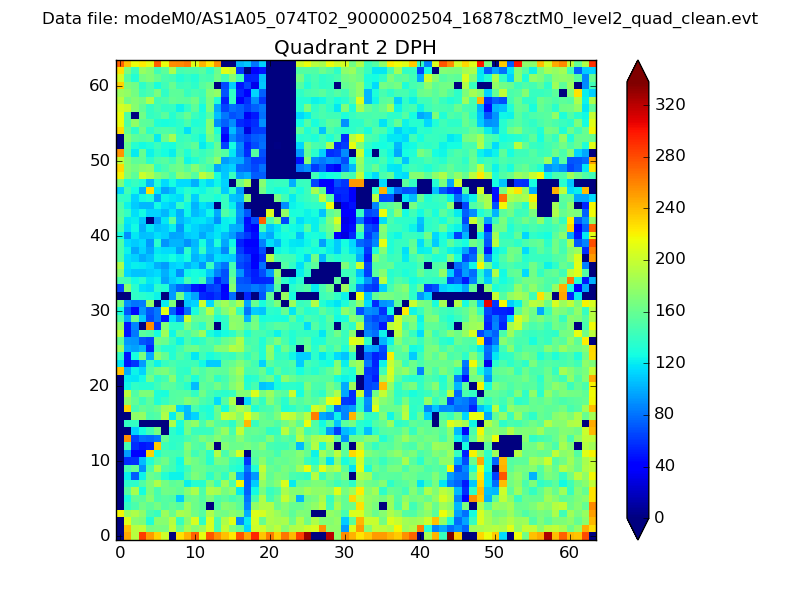
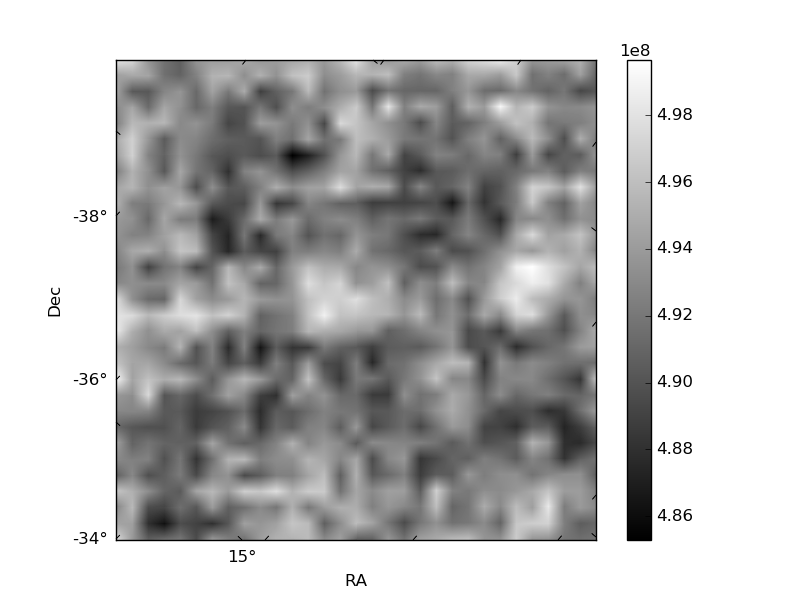
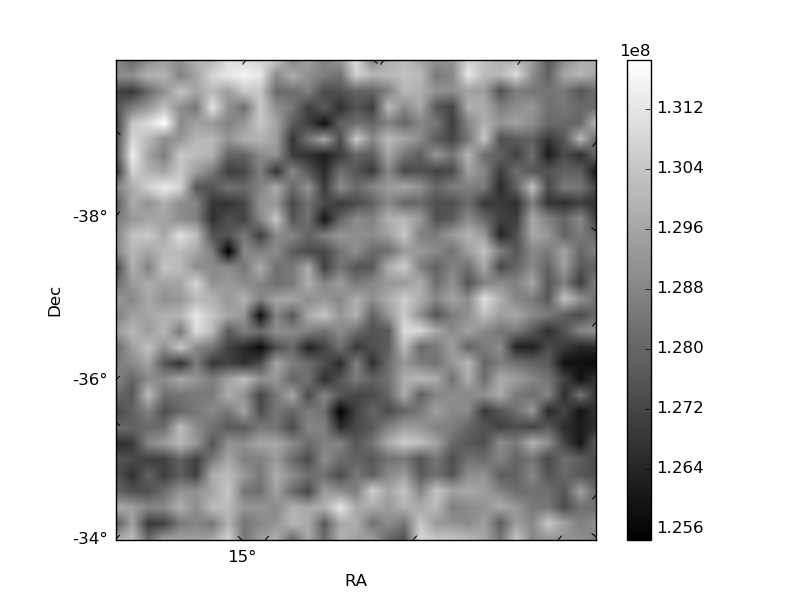
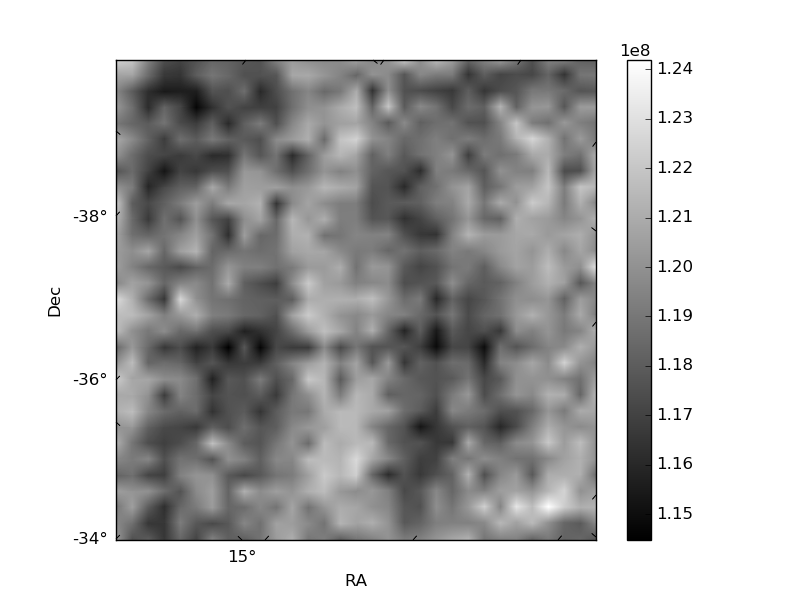
Histogram calculated using DETX and DETY for each event in the final _common_clean file
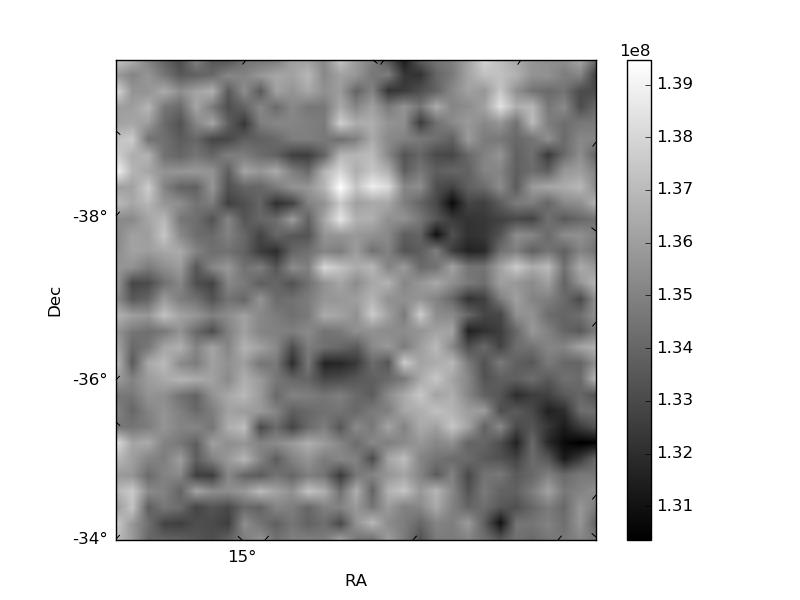
| Quadrant A | 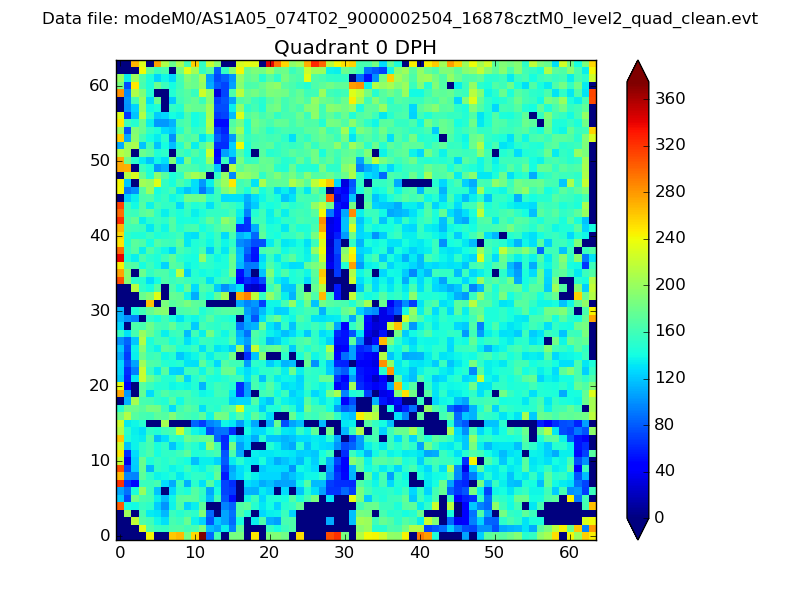 |
 |
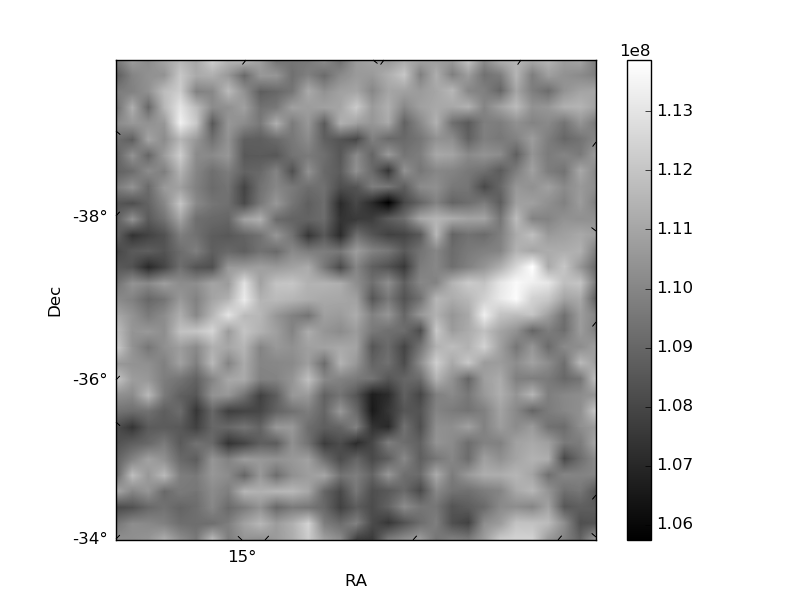
Quadrant B |
|---|---|---|---|
| Quadrant D | 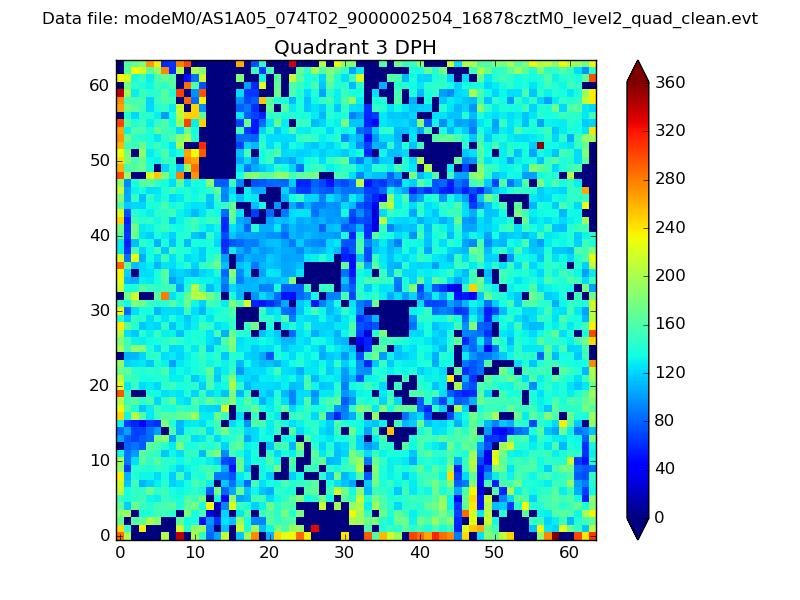 |
 |
Quadrant C |
| Plot type | Count rate plots | Images |
|---|---|---|
| Comparison with Poisson distribution Blue bars denote a histogram of data divided into 1 sec bins. Red curve is a Poisson curve with rate = median count rate of data. |
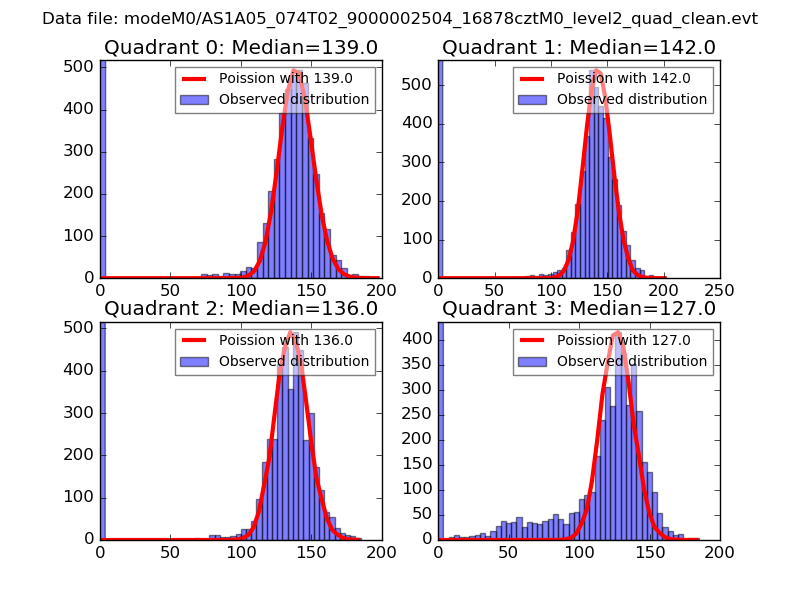 |
 |
| Quadrant-wise count rates Data is divided into 100 sec bins |
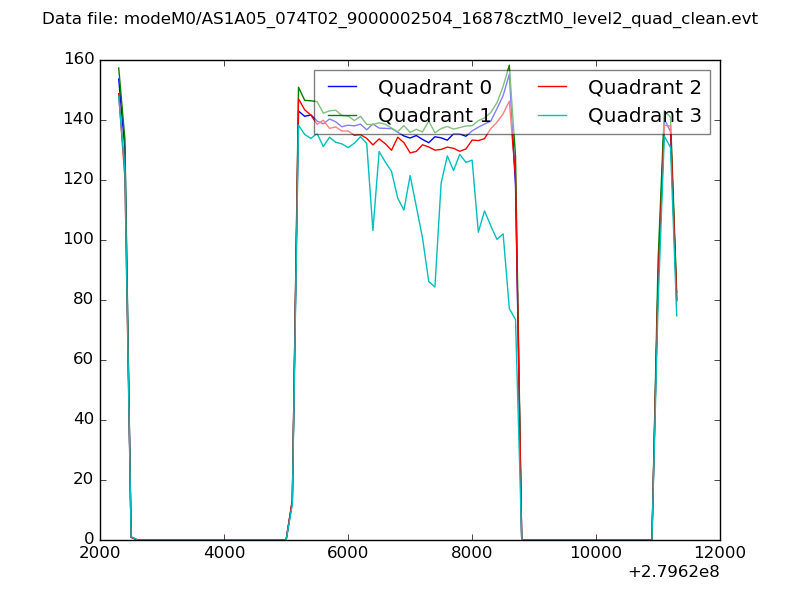 |
|
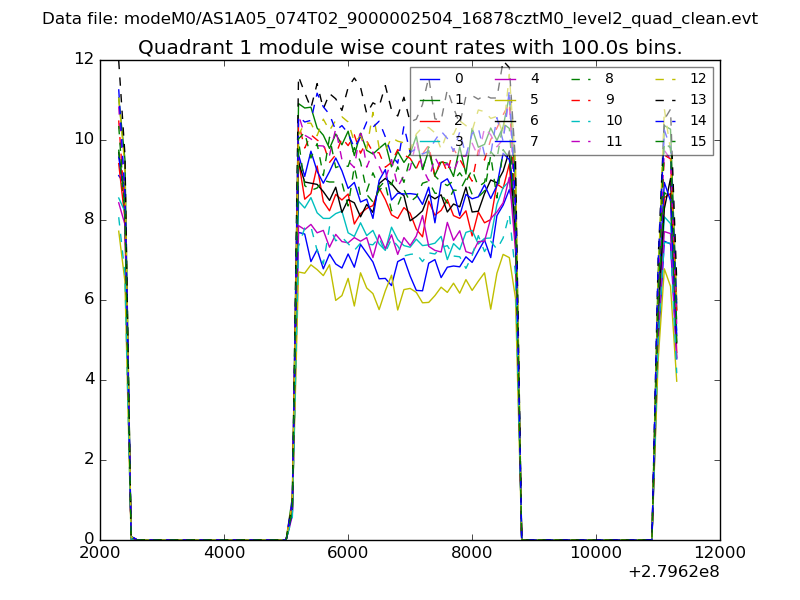
| Module-wise count rates for Quadrant A Data is divided into 100 sec bins |
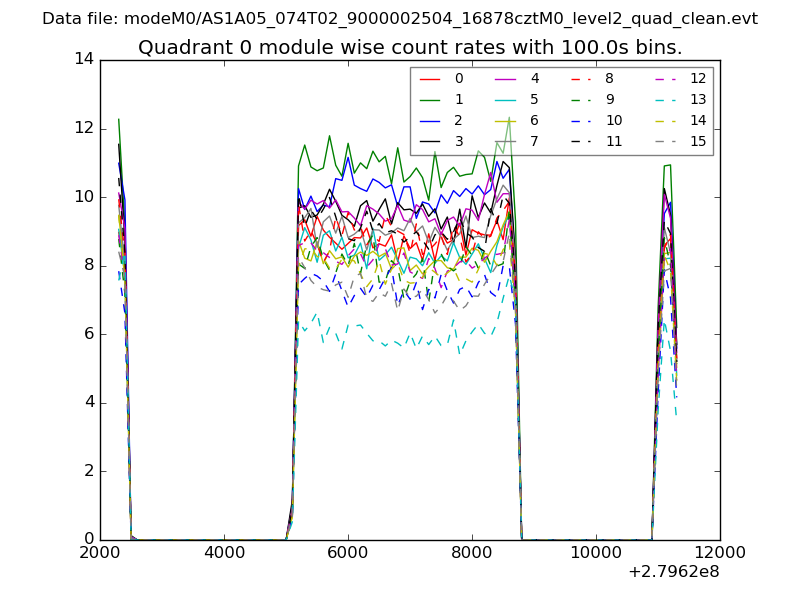 |
 |
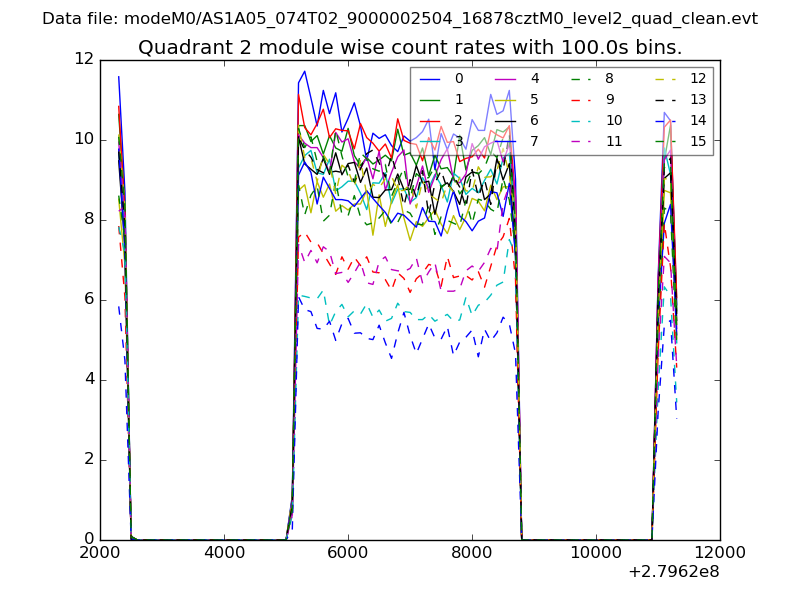
| Module-wise count rates for Quadrant B Data is divided into 100 sec bins |
 |
 |
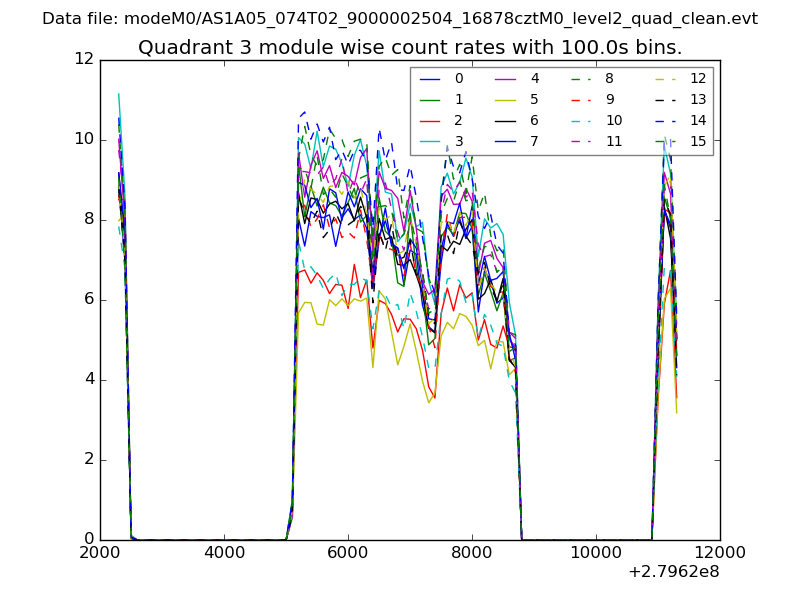
| Module-wise count rates for Quadrant C Data is divided into 100 sec bins |
 |
 |
| Module-wise count rates for Quadrant D Data is divided into 100 sec bins |
 |
 |
| Parameter | Plot |
|---|---|
| CZT HV Monitor | 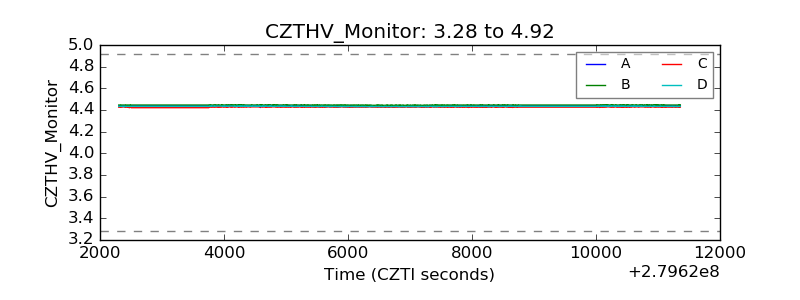 |
| D_VDD | 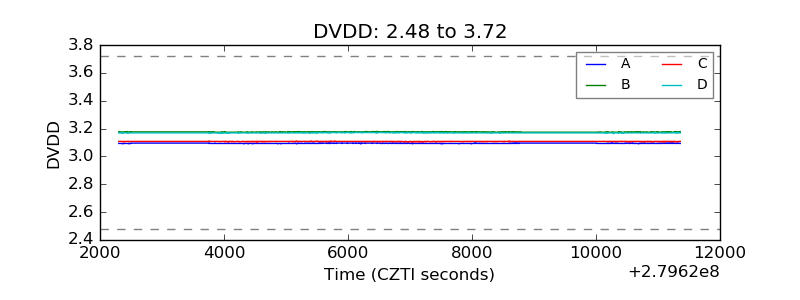 |
| Temperature 1 | 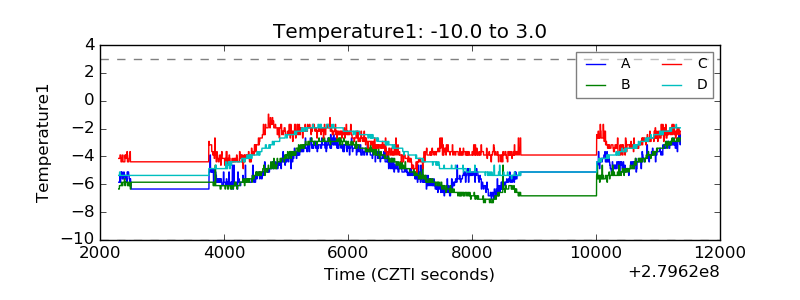 |
| Veto HV Monitor | 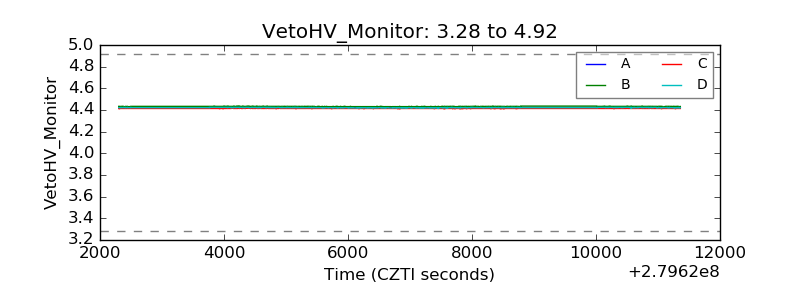 |
| Veto LLD | 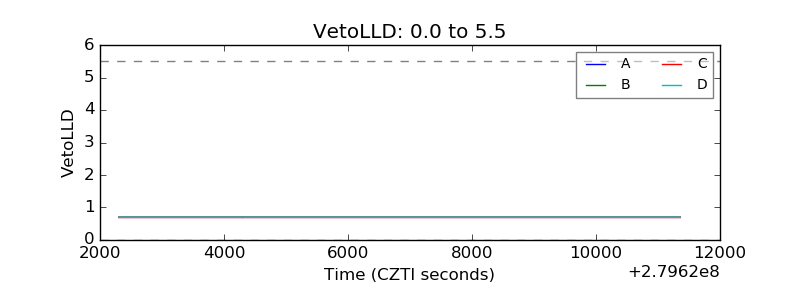 |
| Alpha Counter | 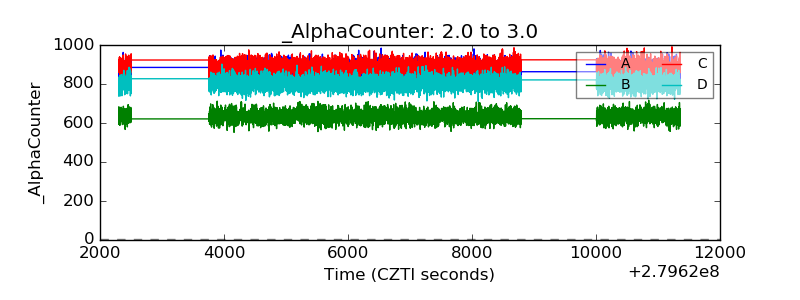 |
| _CPM_Rate | 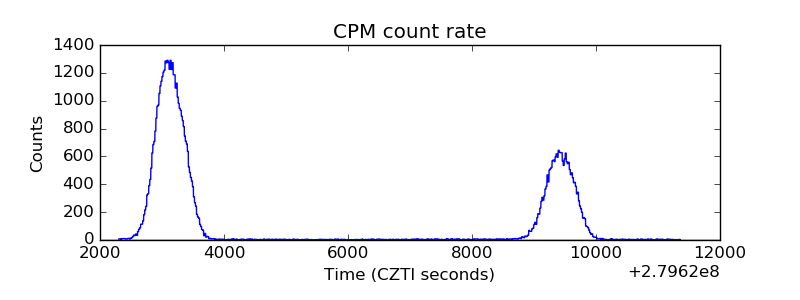 |
| CZT Counter | 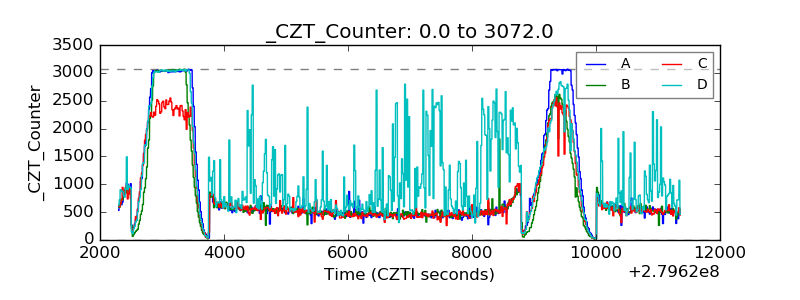 |
| +2.5 Volts monitor |  |
| +5 Volts monitor |  |
| _ROLL_ROT | 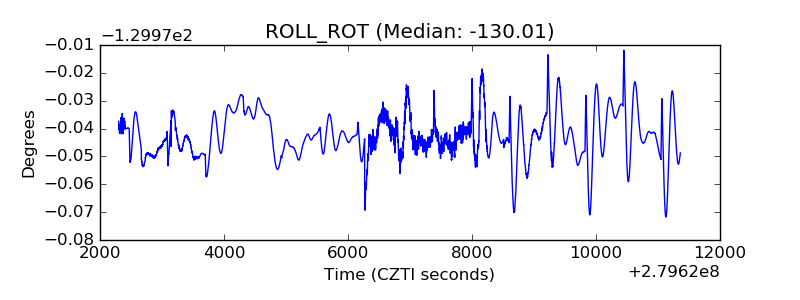 |
| _Roll_DEC | 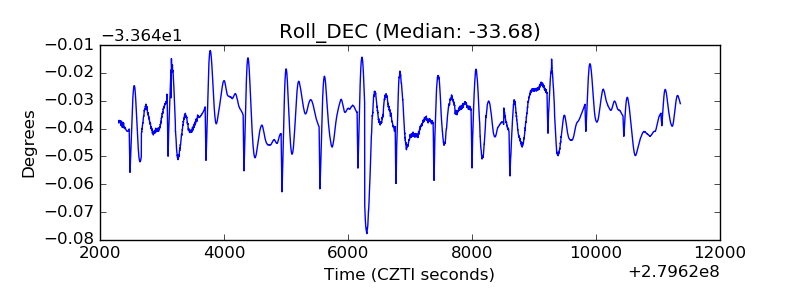 |
| _Roll_RA | 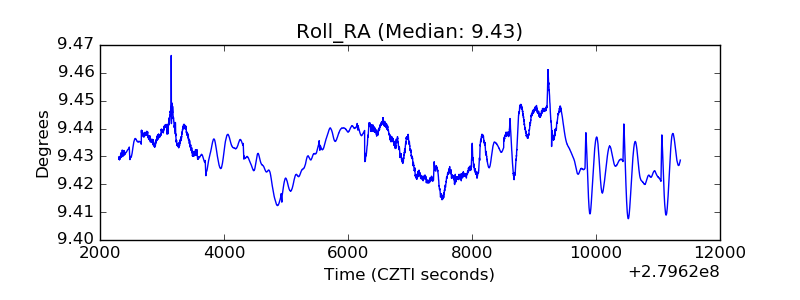 |
| Veto Counter | 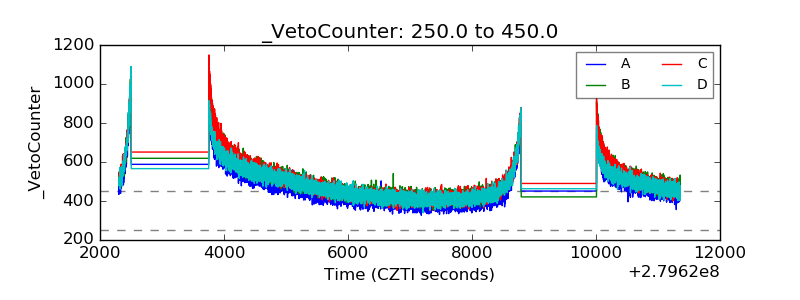 |