| Param | Original file | Final file |
|---|---|---|
| Filename | modeM0/AS1A05_074T02_9000002504_16879cztM0_level2.evt | modeM0/AS1A05_074T02_9000002504_16879cztM0_level2_quad_clean.evt |
| Size (bytes) | 579,703,680 | 77,281,920 |
| Size | 552.8 MB | 73.7 MB |
| Events in quadrant A | 3,272,987 | 487,427 |
| Events in quadrant B | 3,525,837 | 493,797 |
| Events in quadrant C | 3,294,050 | 471,449 |
| Events in quadrant D | 7,012,645 | 423,396 |
| Mode M9 | |||
|---|---|---|---|
| Quadrant | BADHDUFLAG | Total packets | Discarded packets |
| A | 0 | 19 | 0 |
| B | 0 | 19 | 0 |
| C | 0 | 19 | 0 |
| D | 0 | 20 | 0 |
| Mode SS | |||
|---|---|---|---|
| Quadrant | BADHDUFLAG | Total packets | Discarded packets |
| A | 0 | 134 | 0 |
| B | 0 | 134 | 0 |
| C | 0 | 134 | 0 |
| D | 0 | 134 | 0 |
| Mode M0 | |||
|---|---|---|---|
| Quadrant | BADHDUFLAG | Total packets | Discarded packets |
| A | 0 | 13901 | 3 |
| B | 0 | 14566 | 2 |
| C | 0 | 14012 | 2 |
| D | 0 | 25334 | 2 |
| Quadrant | Total seconds | Saturated seconds | Saturation percentage |
|---|---|---|---|
| A | 6654 | 130 | 1.953712% |
| B | 6654 | 169 | 2.539826% |
| C | 6654 | 183 | 2.750225% |
| D | 6654 | 928 | 13.946498% |
Noise dominated data is calculated using 1-second bins in cleaned event files. If a bin has >2000 counts, and if more than 50% of those come from <1% of pixels, then it is considered to be noise-dominated and hence unusable.
| Quadrant | # 1 sec bins | Bins with >0 counts | Bins with >2000 counts | High rate bins dominated by noise | Noise dominated (total time) | Noise dominated (detector-on time) | Marked lightcurve |
|---|---|---|---|---|---|---|---|
| A | 7625 | 6656 | 0 | 0 | 0.00% | 0.00% | 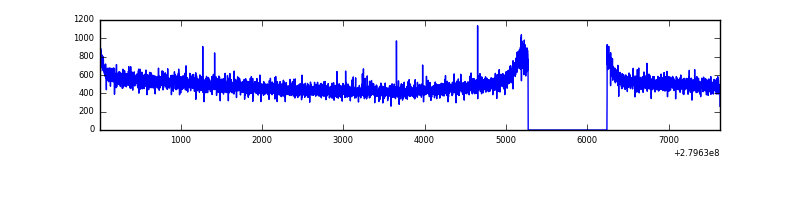 |
| B | 7625 | 6656 | 2 | 2 | 0.03% | 0.03% | 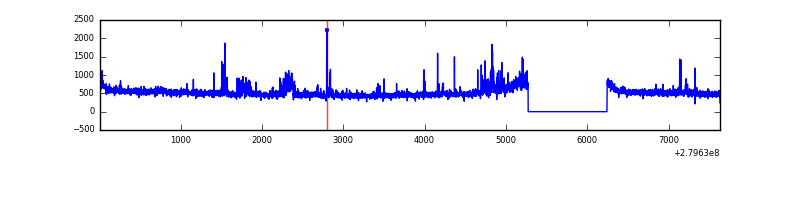 |
| C | 7625 | 6656 | 0 | 0 | 0.00% | 0.00% | 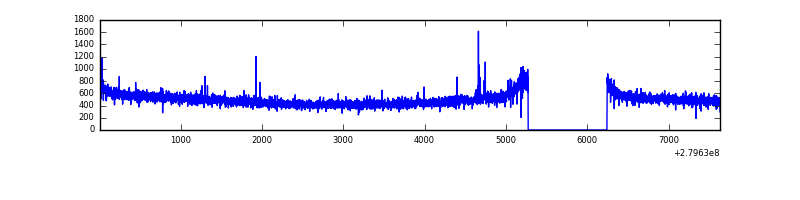 |
| D | 7625 | 6655 | 720 | 720 | 9.44% | 10.82% | 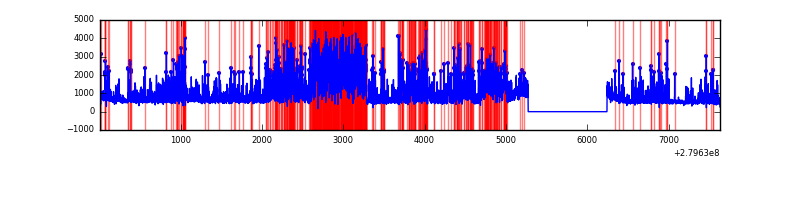 |
Top three noisy pixels from each quadrant. If the there are fewer than three noisy pixels in the level2.evt file, extra rows are filled as -1
| Pixel properties | Quadrant properties | ||||||
|---|---|---|---|---|---|---|---|
| Quadrant | DetID | PixID | Counts | Sigma | Mean | Median | Sigma |
| A | 0 | 226 | 7644 | 39.81 | 850 | 832 | 171.1 |
| A | 3 | 137 | 6181 | 31.26 | 850 | 832 | 171.1 |
| A | 12 | 194 | 6177 | 31.24 | 850 | 832 | 171.1 |
| B | 10 | 16 | 81992 | 503.4 | 847 | 827 | 161.2 |
| B | 4 | 216 | 52966 | 323.37 | 847 | 827 | 161.2 |
| B | 15 | 35 | 29821 | 179.82 | 847 | 827 | 161.2 |
| C | 14 | 238 | 125665 | 662.48 | 809 | 815 | 188.5 |
| C | 5 | 112 | 9450 | 45.82 | 809 | 815 | 188.5 |
| C | 3 | 233 | 5731 | 26.09 | 809 | 815 | 188.5 |
| D | 1 | 52 | 3814204 | 20027.93 | 788 | 765 | 190.4 |
| D | 11 | 66 | 164717 | 861.07 | 788 | 765 | 190.4 |
| D | 2 | 234 | 26667 | 136.04 | 788 | 765 | 190.4 |
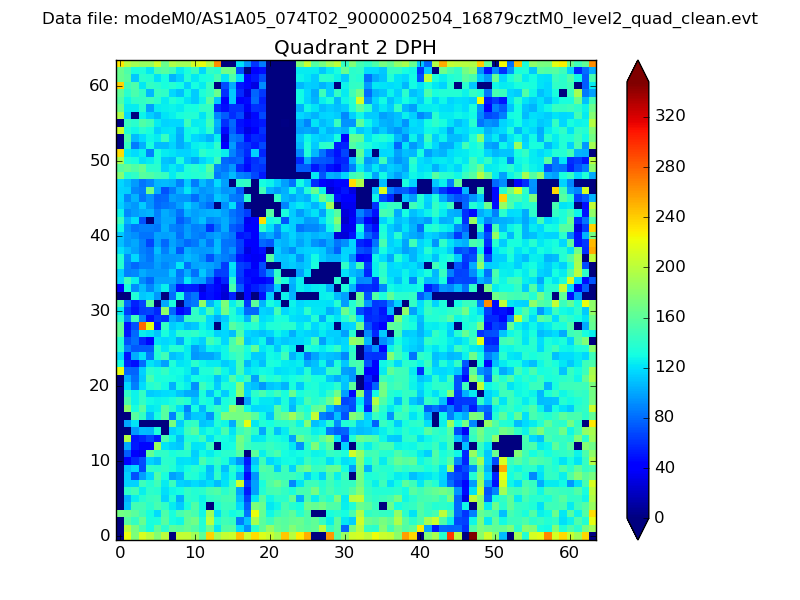
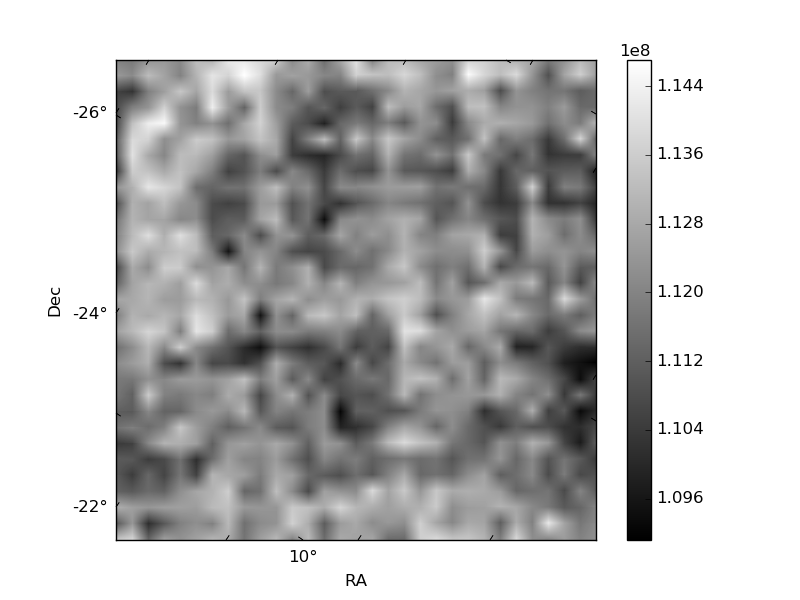
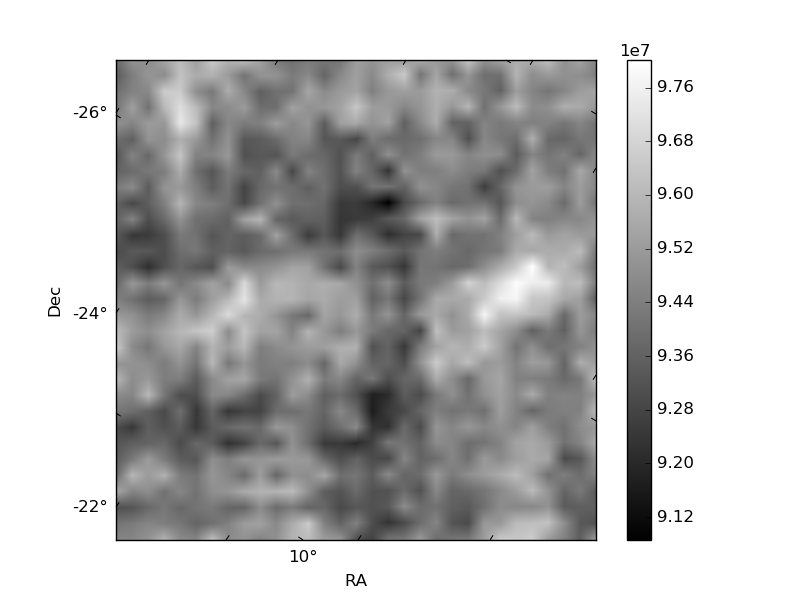
Histogram calculated using DETX and DETY for each event in the final _common_clean file
| Quadrant A | 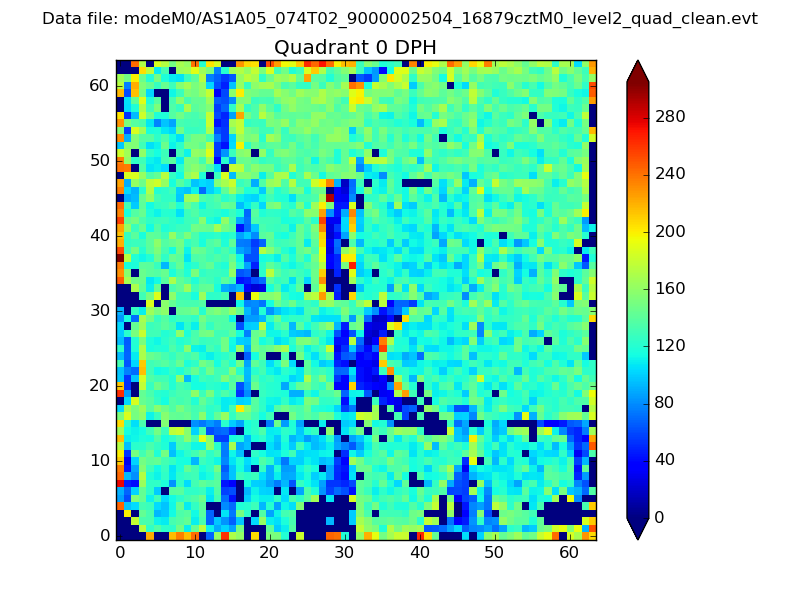 |
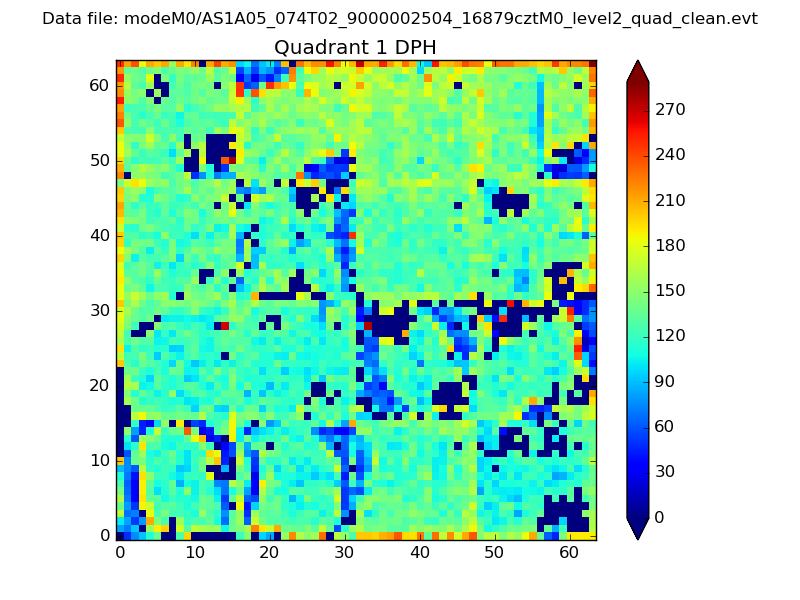 |
Quadrant B |
|---|---|---|---|
| Quadrant D | 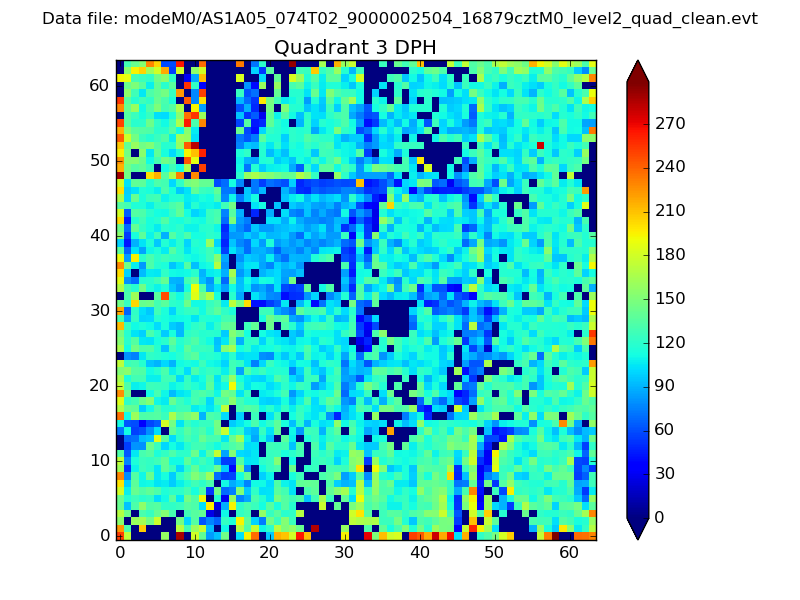 |
 |
Quadrant C |
| Plot type | Count rate plots | Images |
|---|---|---|
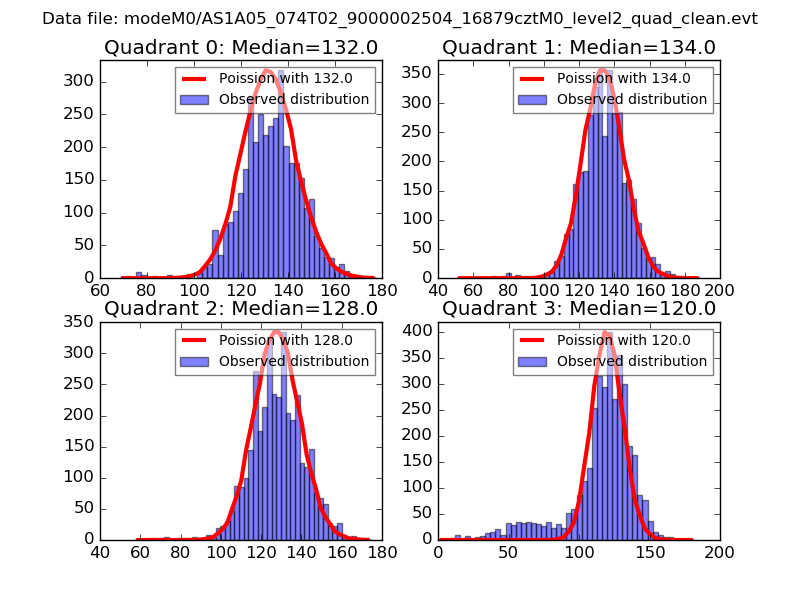
| Comparison with Poisson distribution Blue bars denote a histogram of data divided into 1 sec bins. Red curve is a Poisson curve with rate = median count rate of data. |
 |
 |
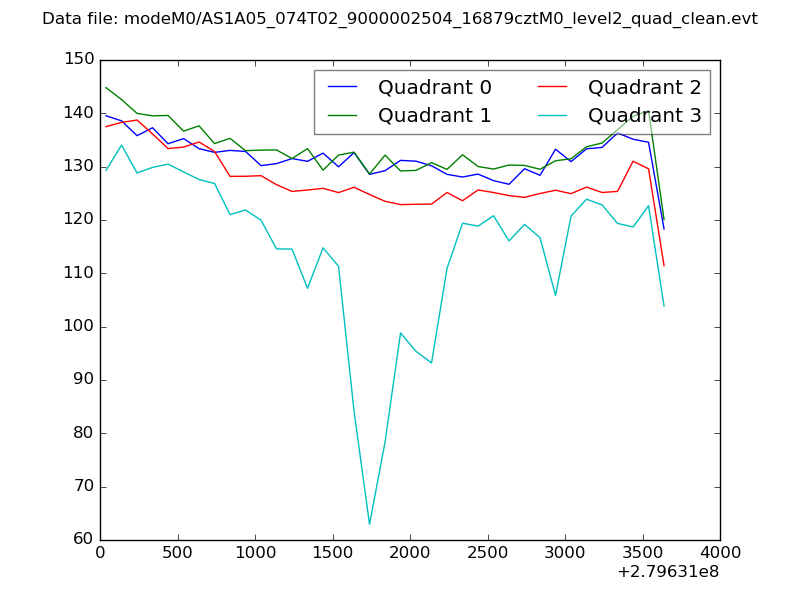
| Quadrant-wise count rates Data is divided into 100 sec bins |
 |
|
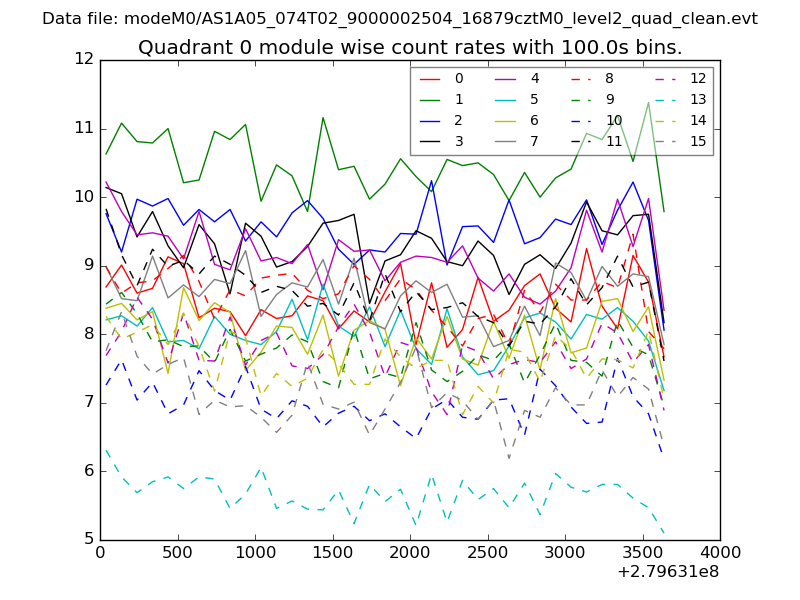
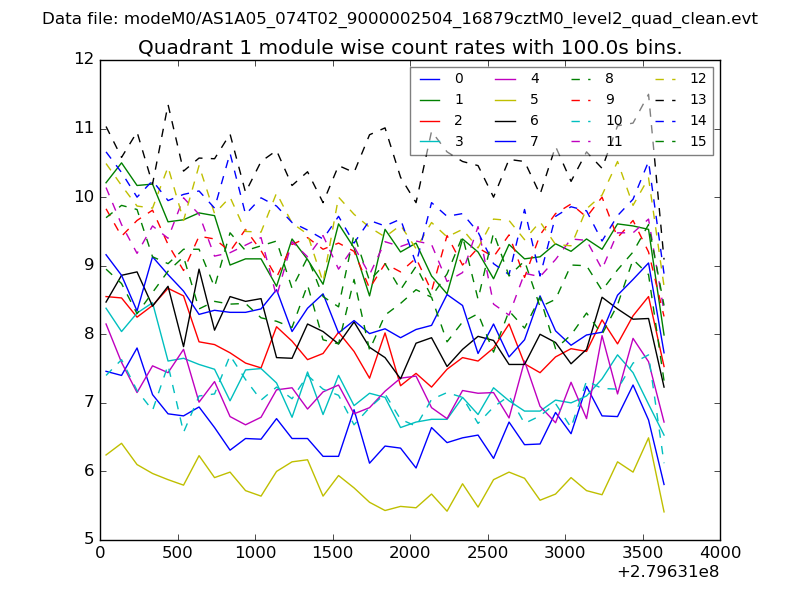
| Module-wise count rates for Quadrant A Data is divided into 100 sec bins |
 |
 |
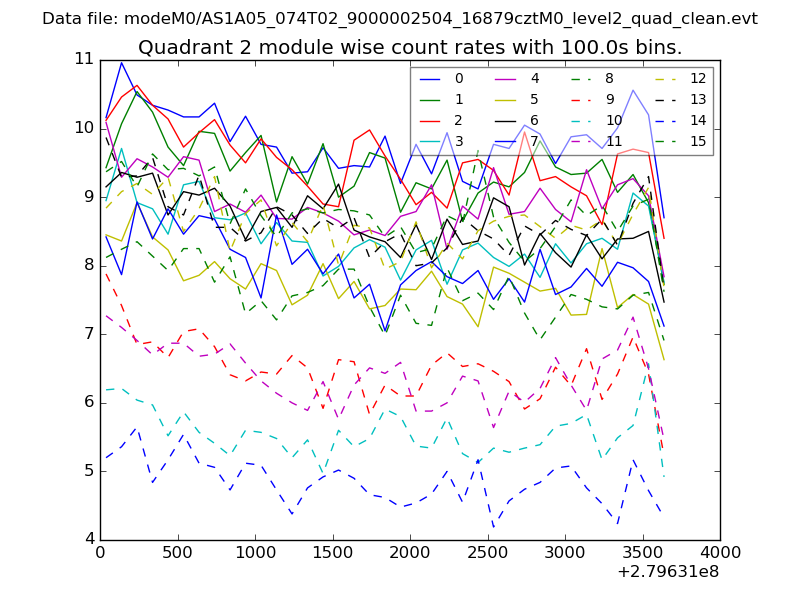
| Module-wise count rates for Quadrant B Data is divided into 100 sec bins |
 |
 |
| Module-wise count rates for Quadrant C Data is divided into 100 sec bins |
 |
 |
| Module-wise count rates for Quadrant D Data is divided into 100 sec bins |
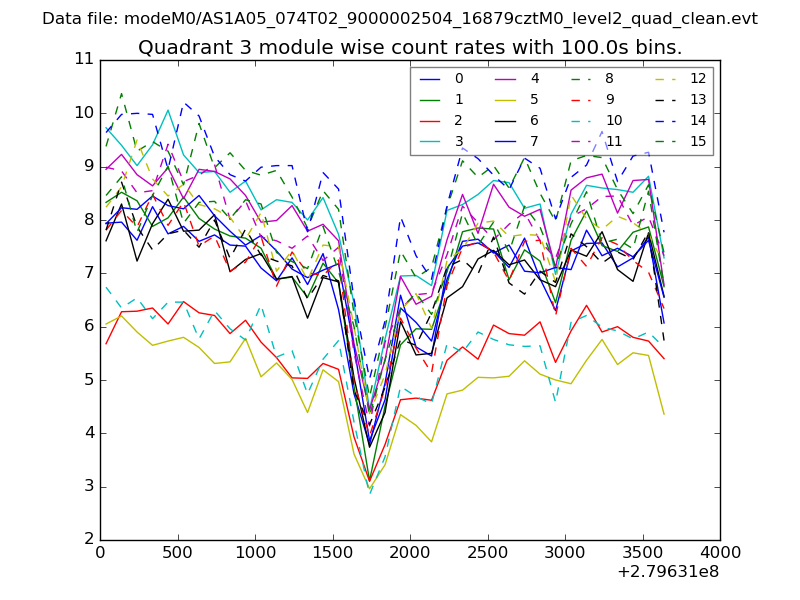 |
 |
| Parameter | Plot |
|---|---|
| CZT HV Monitor | 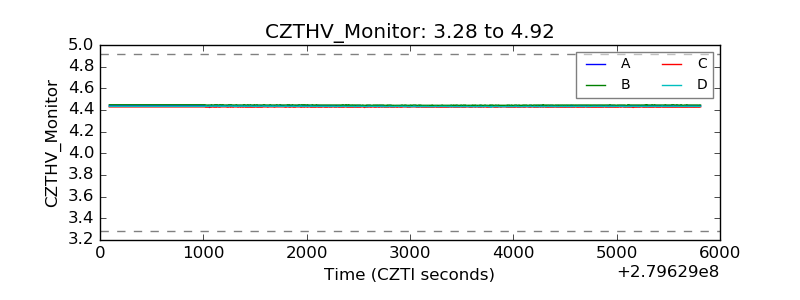 |
| D_VDD | 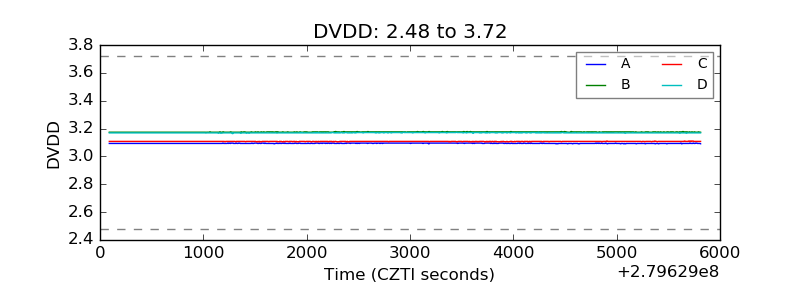 |
| Temperature 1 | 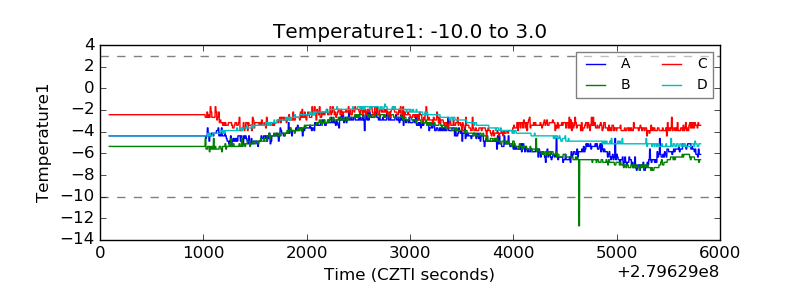 |
| Veto HV Monitor | 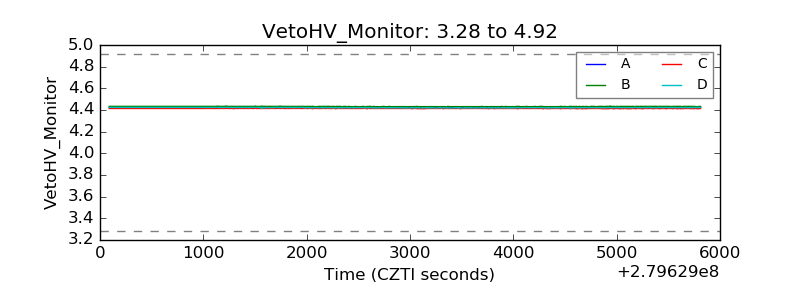 |
| Veto LLD | 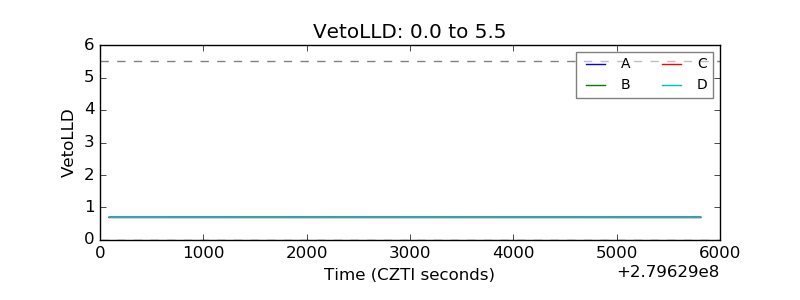 |
| Alpha Counter | 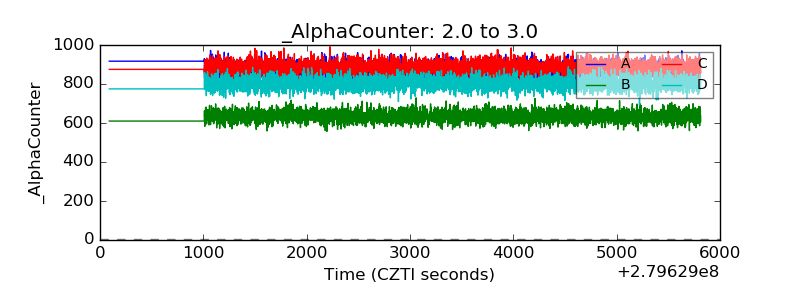 |
| _CPM_Rate | 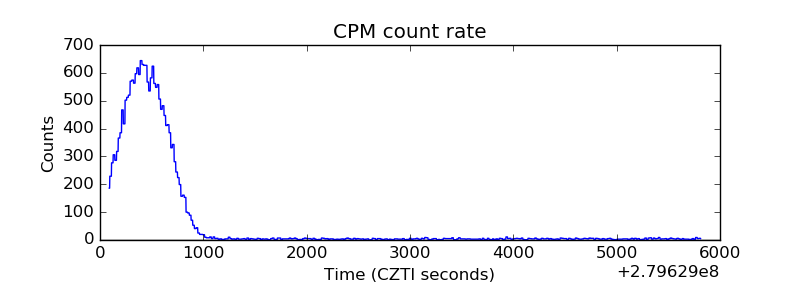 |
| CZT Counter | 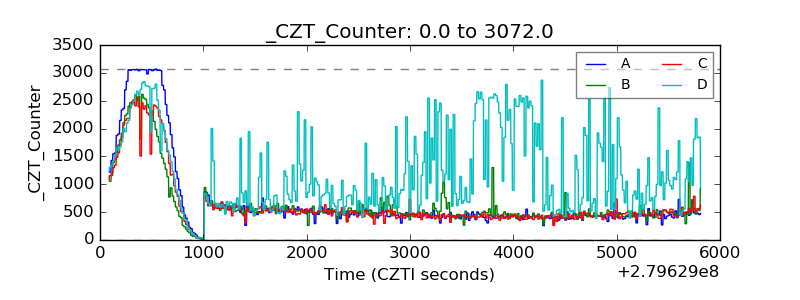 |
| +2.5 Volts monitor |  |
| +5 Volts monitor | 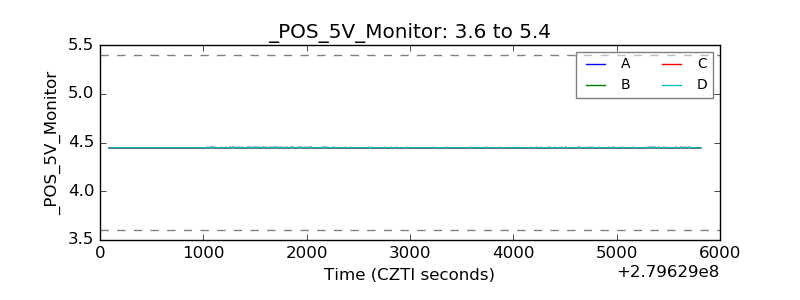 |
| _ROLL_ROT | 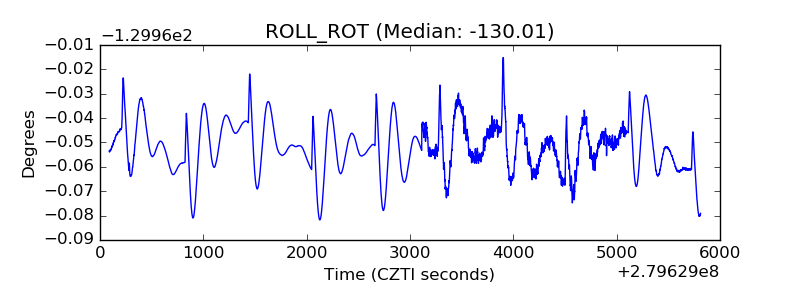 |
| _Roll_DEC | 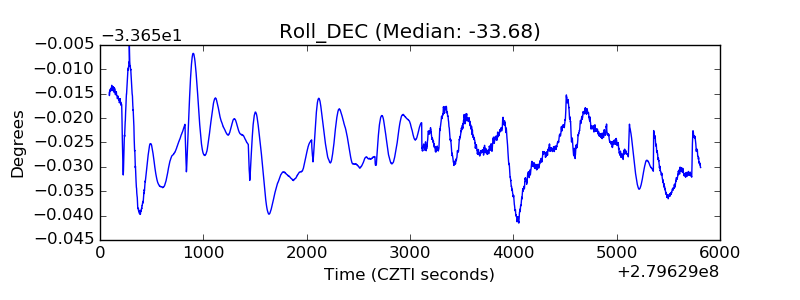 |
| _Roll_RA | 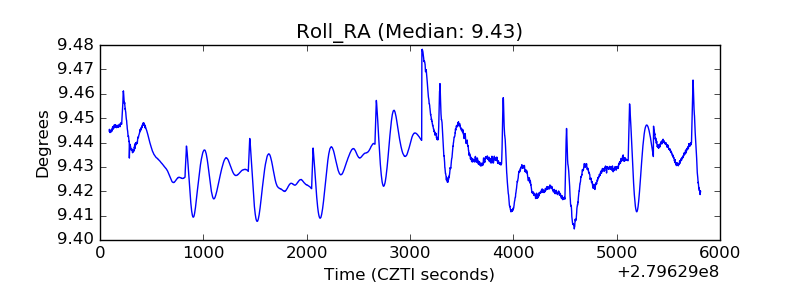 |
| Veto Counter | 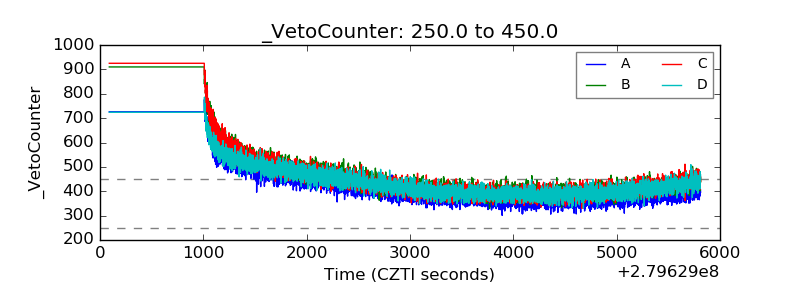 |