| Param | Original file | Final file |
|---|---|---|
| Filename | modeM0/AS1A05_004T03_9000002508cztM0_level2.fits | modeM0/AS1A05_004T03_9000002508cztM0_level2_quad_clean.evt |
| Size (bytes) | 642,358,080 | 608,970,240 |
| Size | 612.6 MB | 580.8 MB |
| Events in quadrant A | 3,695,706 | 3,196,873 |
| Events in quadrant B | 3,868,070 | 3,786,139 |
| Events in quadrant C | 3,876,814 | 3,582,505 |
| Events in quadrant D | 3,366,298 | 3,235,326 |
| Mode M0 | |||
|---|---|---|---|
| Quadrant | BADHDUFLAG | Total packets | Discarded packets |
| A | 0 | 238355 | 0 |
| B | 0 | 146539 | 0 |
| C | 0 | 143737 | 0 |
| D | 0 | 175704 | 0 |
| Mode SS | |||
|---|---|---|---|
| Quadrant | BADHDUFLAG | Total packets | Discarded packets |
| A | 0 | 1384 | 0 |
| B | 0 | 1384 | 0 |
| C | 0 | 1384 | 0 |
| D | 0 | 1384 | 0 |
| Mode M9 | |||
|---|---|---|---|
| Quadrant | BADHDUFLAG | Total packets | Discarded packets |
| A | 0 | 111 | 0 |
| B | 0 | 111 | 0 |
| C | 0 | 111 | 0 |
| D | 0 | 111 | 0 |
| Quadrant | Total seconds | Saturated seconds | Saturation percentage |
|---|---|---|---|
| A | 67664 | 11840 | 17.498227% |
| B | 67664 | 944 | 1.395129% |
| C | 67664 | 958 | 1.415819% |
| D | 67664 | 2499 | 3.693249% |
Noise dominated data is calculated using 1-second bins in cleaned event files. If a bin has >2000 counts, and if more than 50% of those come from <1% of pixels, then it is considered to be noise-dominated and hence unusable.
| Quadrant | # 1 sec bins | Bins with >0 counts | Bins with >2000 counts | High rate bins dominated by noise | Noise dominated (total time) | Noise dominated (detector-on time) | Marked lightcurve |
|---|---|---|---|---|---|---|---|
| A | 78875 | 67619 | 0 | 0 | 0.00% | 0.00% | 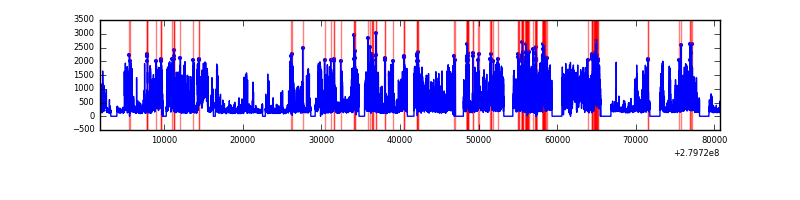 |
| B | 78875 | 67664 | 0 | 0 | 0.00% | 0.00% | 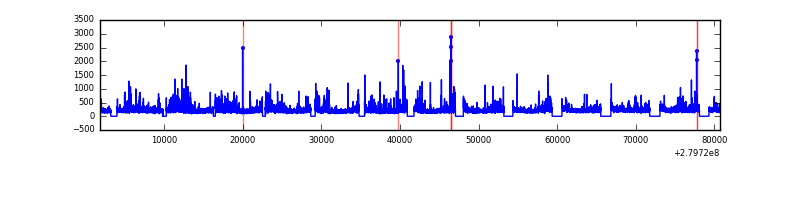 |
| C | 78875 | 67664 | 0 | 0 | 0.00% | 0.00% |  |
| D | 78875 | 67594 | 0 | 0 | 0.00% | 0.00% | 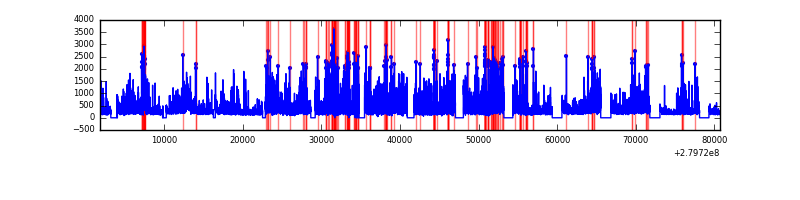 |
Top three noisy pixels from each quadrant. If the there are fewer than three noisy pixels in the level2.evt file, extra rows are filled as -1
| Pixel properties | Quadrant properties | ||||||
|---|---|---|---|---|---|---|---|
| Quadrant | DetID | PixID | Counts | Sigma | Mean | Median | Sigma |
| A | 0 | 29 | 3395 | 10.59 | 962 | 903 | 235.4 |
| A | 7 | 110 | 2930 | 8.61 | 962 | 903 | 235.4 |
| A | 0 | 30 | 2742 | 7.81 | 962 | 903 | 235.4 |
| B | 2 | 9 | 3012 | 10.12 | 1023 | 977 | 201.1 |
| B | 2 | 8 | 2664 | 8.39 | 1023 | 977 | 201.1 |
| B | 3 | 17 | 2574 | 7.94 | 1023 | 977 | 201.1 |
| C | 12 | 241 | 2733 | 6.76 | 1025 | 953 | 263.3 |
| C | 3 | 126 | 2681 | 6.56 | 1025 | 953 | 263.3 |
| C | 2 | 191 | 2624 | 6.35 | 1025 | 953 | 263.3 |
| D | 3 | 14 | 2456 | 6.2 | 959 | 875 | 254.9 |
| D | 6 | 38 | 2399 | 5.98 | 959 | 875 | 254.9 |
| D | 6 | 231 | 2397 | 5.97 | 959 | 875 | 254.9 |
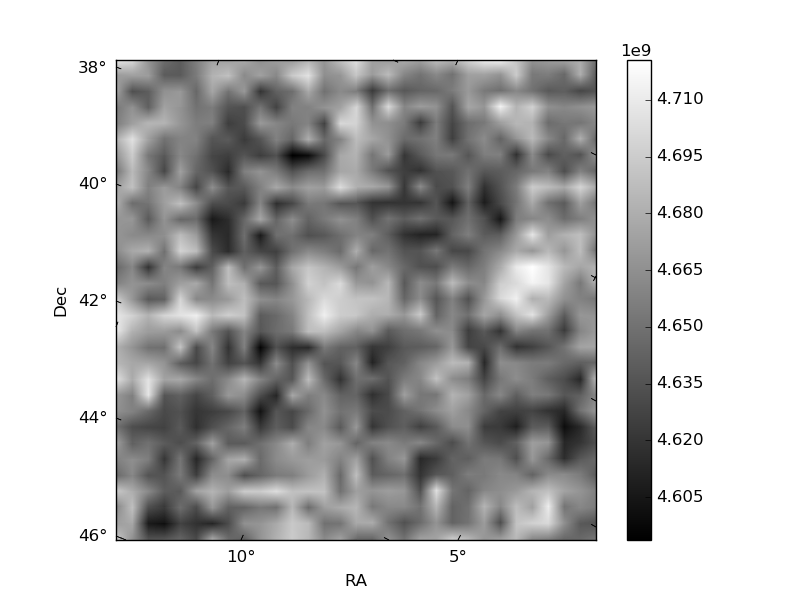
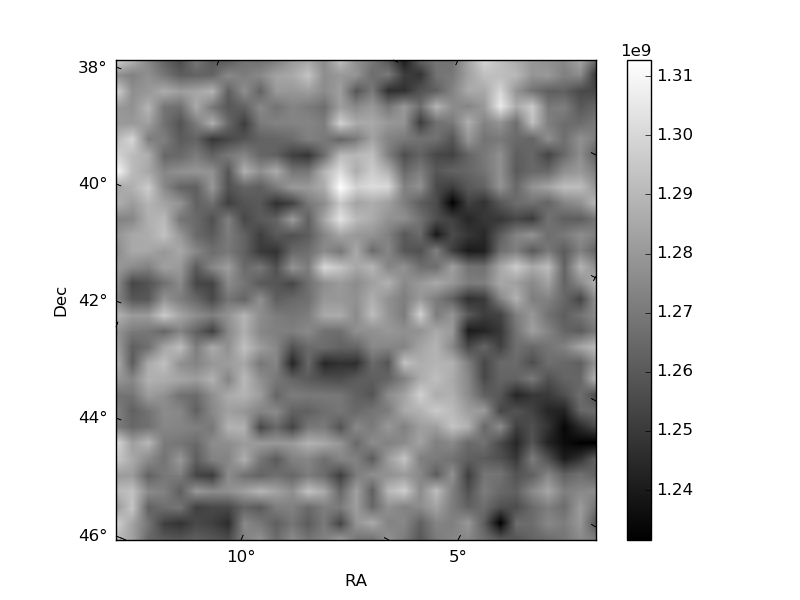
Histogram calculated using DETX and DETY for each event in the final _common_clean file
| Quadrant A |  |
 |
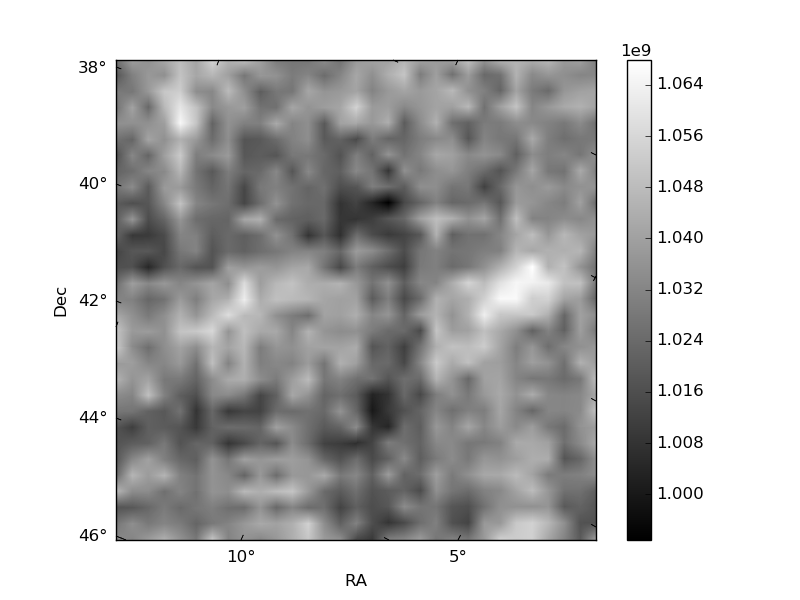
Quadrant B |
|---|---|---|---|
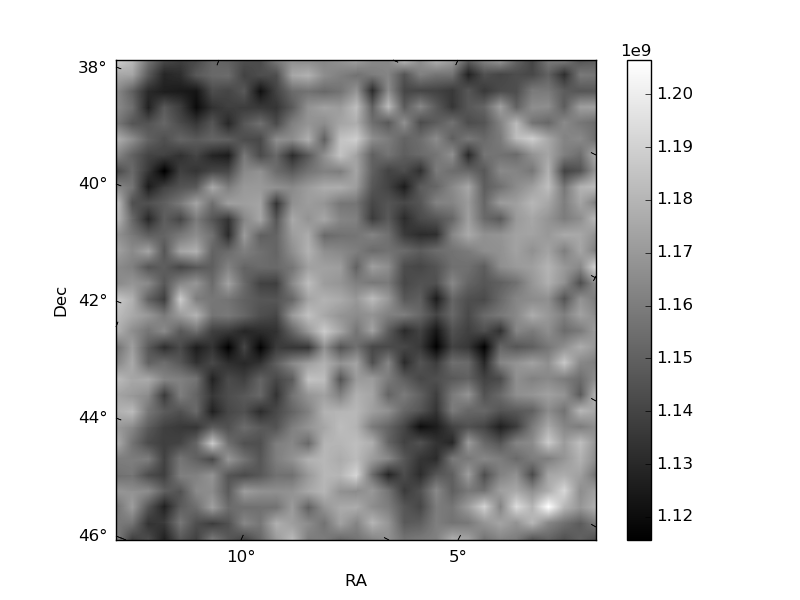
| Quadrant D |  |
 |
Quadrant C |
| Plot type | Count rate plots | Images |
|---|---|---|
| Comparison with Poisson distribution Blue bars denote a histogram of data divided into 1 sec bins. Red curve is a Poisson curve with rate = median count rate of data. |
 |
 |
| Quadrant-wise count rates Data is divided into 100 sec bins |
 |
|
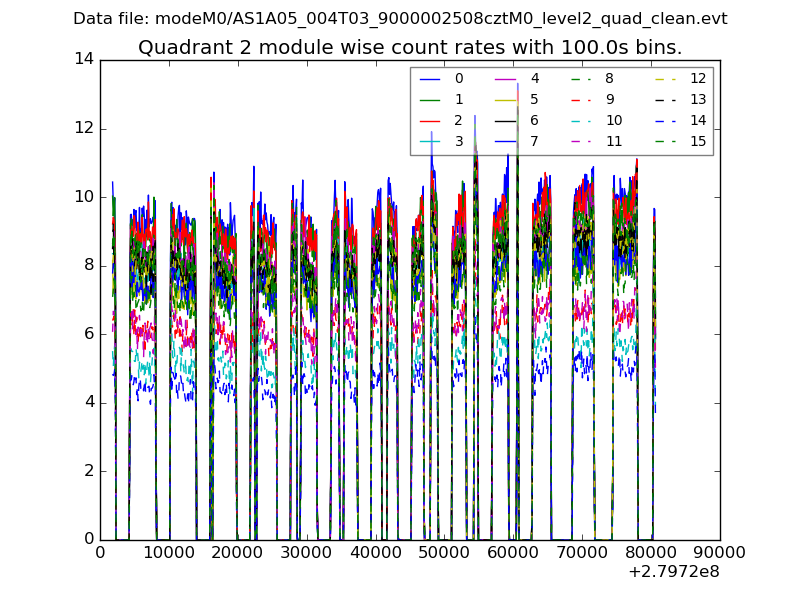
| Module-wise count rates for Quadrant A Data is divided into 100 sec bins |
 |
 |
| Module-wise count rates for Quadrant B Data is divided into 100 sec bins |
 |
 |
| Module-wise count rates for Quadrant C Data is divided into 100 sec bins |
 |
 |
| Module-wise count rates for Quadrant D Data is divided into 100 sec bins |
 |
 |
| Parameter | Plot |
|---|---|
| CZT HV Monitor |  |
| D_VDD |  |
| Temperature 1 | 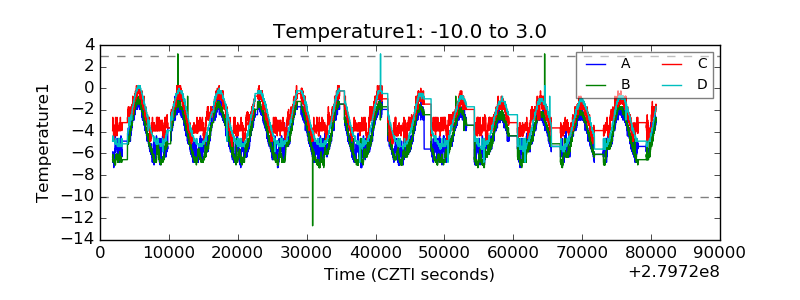 |
| Veto HV Monitor | 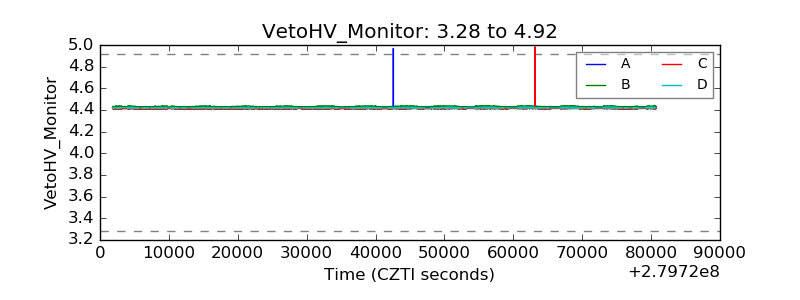 |
| Veto LLD |  |
| Alpha Counter |  |
| _CPM_Rate |  |
| CZT Counter |  |
| +2.5 Volts monitor |  |
| +5 Volts monitor |  |
| _ROLL_ROT |  |
| _Roll_DEC |  |
| _Roll_RA |  |
| Veto Counter | 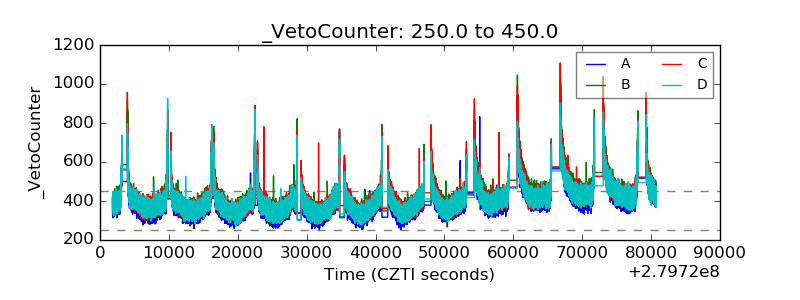 |