| Param | Original file | Final file |
|---|---|---|
| Filename | modeM0/AS1A05_004T03_9000002508_16894cztM0_level2.evt | modeM0/AS1A05_004T03_9000002508_16894cztM0_level2_quad_clean.evt |
| Size (bytes) | 233,599,680 | 31,544,640 |
| Size | 222.8 MB | 30.1 MB |
| Events in quadrant A | 2,328,688 | 177,470 |
| Events in quadrant B | 1,470,624 | 200,295 |
| Events in quadrant C | 1,437,446 | 189,691 |
| Events in quadrant D | 1,644,907 | 186,206 |
| Mode M0 | |||
|---|---|---|---|
| Quadrant | BADHDUFLAG | Total packets | Discarded packets |
| A | 0 | 8719 | 1 |
| B | 0 | 6021 | 1 |
| C | 0 | 5972 | 1 |
| D | 0 | 6653 | 1 |
| Mode SS | |||
|---|---|---|---|
| Quadrant | BADHDUFLAG | Total packets | Discarded packets |
| A | 0 | 60 | 0 |
| B | 0 | 60 | 0 |
| C | 0 | 60 | 0 |
| D | 0 | 60 | 0 |
| Mode M9 | |||
|---|---|---|---|
| Quadrant | BADHDUFLAG | Total packets | Discarded packets |
| A | 0 | 7 | 0 |
| B | 0 | 7 | 0 |
| C | 0 | 7 | 0 |
| D | 0 | 7 | 0 |
| Quadrant | Total seconds | Saturated seconds | Saturation percentage |
|---|---|---|---|
| A | 2805 | 454 | 16.185383% |
| B | 2805 | 135 | 4.812834% |
| C | 2805 | 155 | 5.525847% |
| D | 2805 | 140 | 4.991087% |
Noise dominated data is calculated using 1-second bins in cleaned event files. If a bin has >2000 counts, and if more than 50% of those come from <1% of pixels, then it is considered to be noise-dominated and hence unusable.
| Quadrant | # 1 sec bins | Bins with >0 counts | Bins with >2000 counts | High rate bins dominated by noise | Noise dominated (total time) | Noise dominated (detector-on time) | Marked lightcurve |
|---|---|---|---|---|---|---|---|
| A | 3591 | 2807 | 198 | 198 | 5.51% | 7.05% | 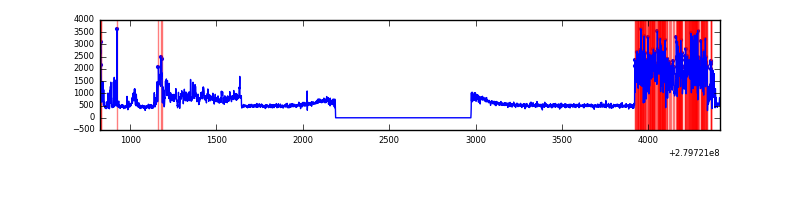 |
| B | 3591 | 2807 | 0 | 0 | 0.00% | 0.00% | 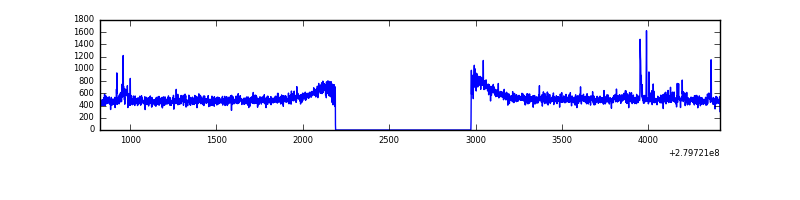 |
| C | 3591 | 2807 | 5 | 5 | 0.14% | 0.18% | 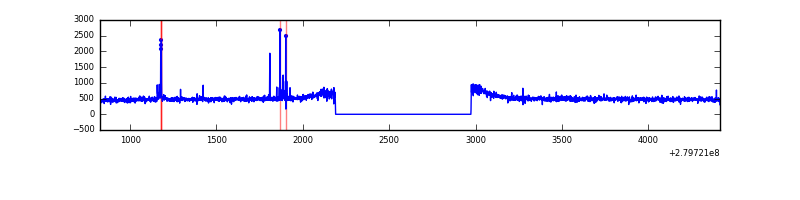 |
| D | 3591 | 2807 | 17 | 17 | 0.47% | 0.61% | 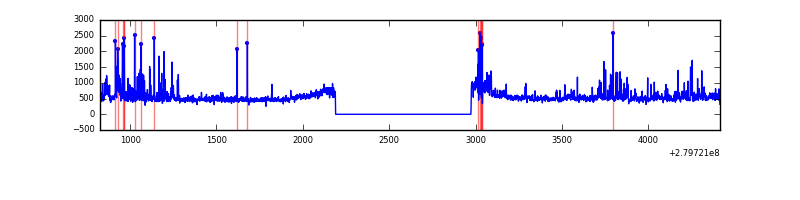 |
Top three noisy pixels from each quadrant. If the there are fewer than three noisy pixels in the level2.evt file, extra rows are filled as -1
| Pixel properties | Quadrant properties | ||||||
|---|---|---|---|---|---|---|---|
| Quadrant | DetID | PixID | Counts | Sigma | Mean | Median | Sigma |
| A | 15 | 174 | 966221 | 13207.42 | 349 | 340 | 73.1 |
| A | 12 | 189 | 19789 | 265.94 | 349 | 340 | 73.1 |
| A | 0 | 226 | 3047 | 37.02 | 349 | 340 | 73.1 |
| B | 15 | 35 | 25833 | 350.13 | 364 | 353 | 72.8 |
| B | 0 | 219 | 11020 | 146.58 | 364 | 353 | 72.8 |
| B | 12 | 111 | 8578 | 113.02 | 364 | 353 | 72.8 |
| C | 14 | 238 | 52700 | 633.27 | 346 | 346 | 82.7 |
| C | 5 | 112 | 18184 | 215.77 | 346 | 346 | 82.7 |
| C | 14 | 225 | 13200 | 155.48 | 346 | 346 | 82.7 |
| D | 1 | 52 | 307235 | 3529.11 | 349 | 337 | 87.0 |
| D | 2 | 234 | 10068 | 111.89 | 349 | 337 | 87.0 |
| D | 15 | 145 | 7225 | 79.2 | 349 | 337 | 87.0 |
Histogram calculated using DETX and DETY for each event in the final _common_clean file
| Quadrant A | 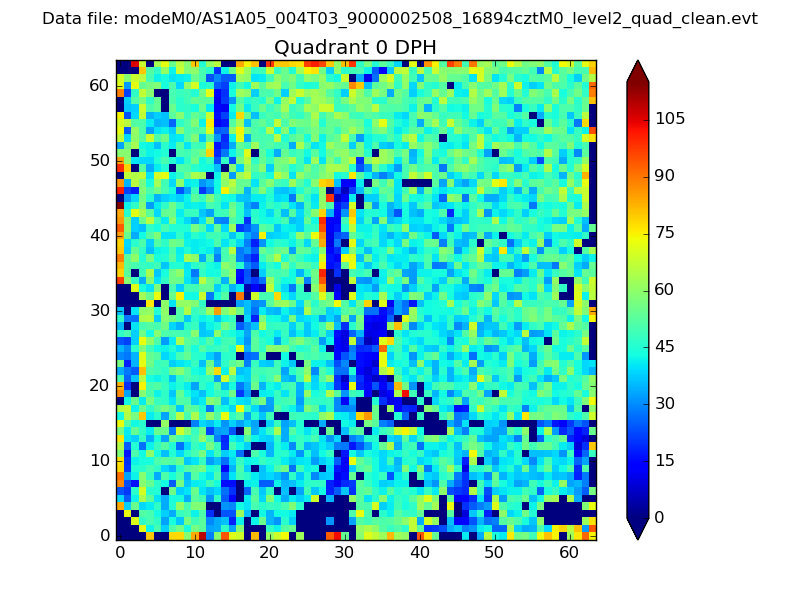 |
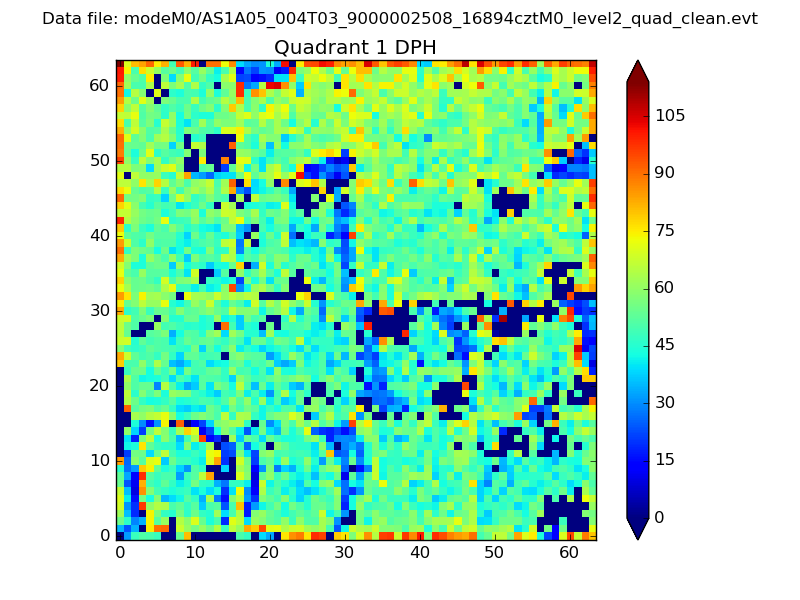 |
Quadrant B |
|---|---|---|---|
| Quadrant D | 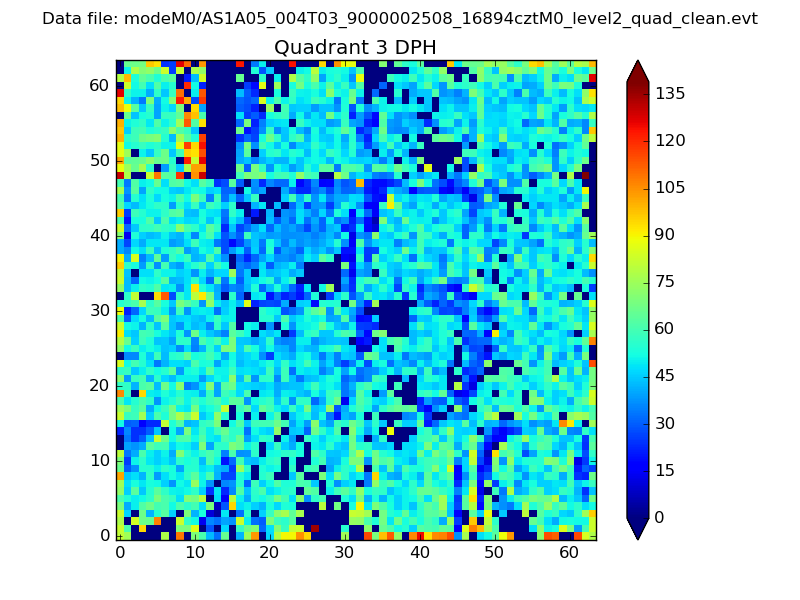 |
 |
Quadrant C |
| Plot type | Count rate plots | Images |
|---|---|---|
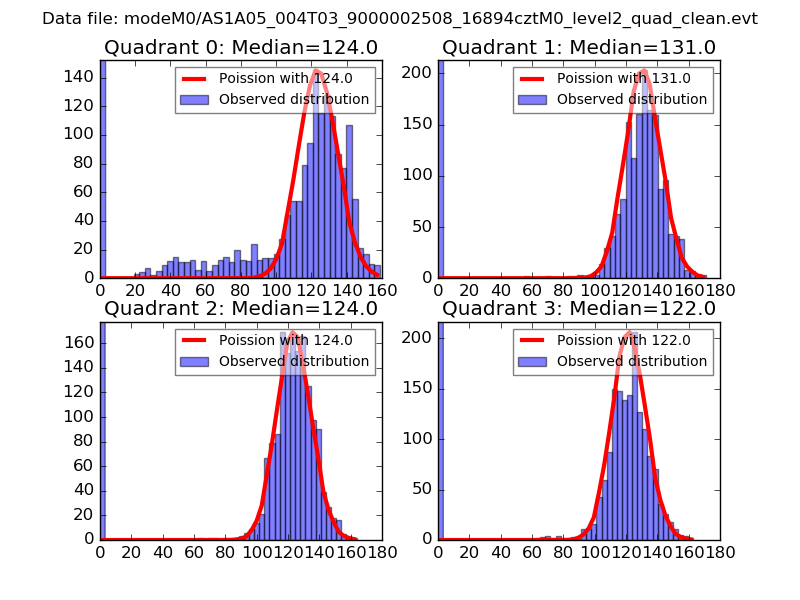
| Comparison with Poisson distribution Blue bars denote a histogram of data divided into 1 sec bins. Red curve is a Poisson curve with rate = median count rate of data. |
 |
 |
| Quadrant-wise count rates Data is divided into 100 sec bins |
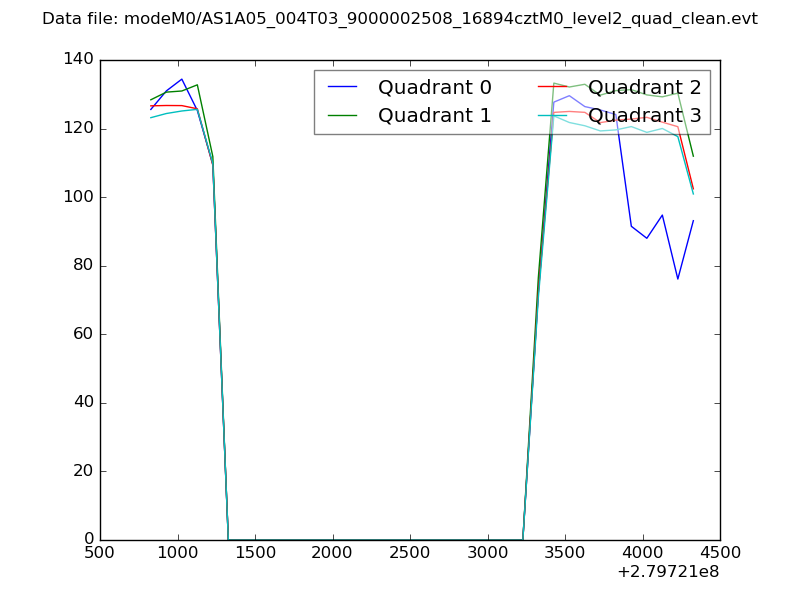 |
|
| Module-wise count rates for Quadrant A Data is divided into 100 sec bins |
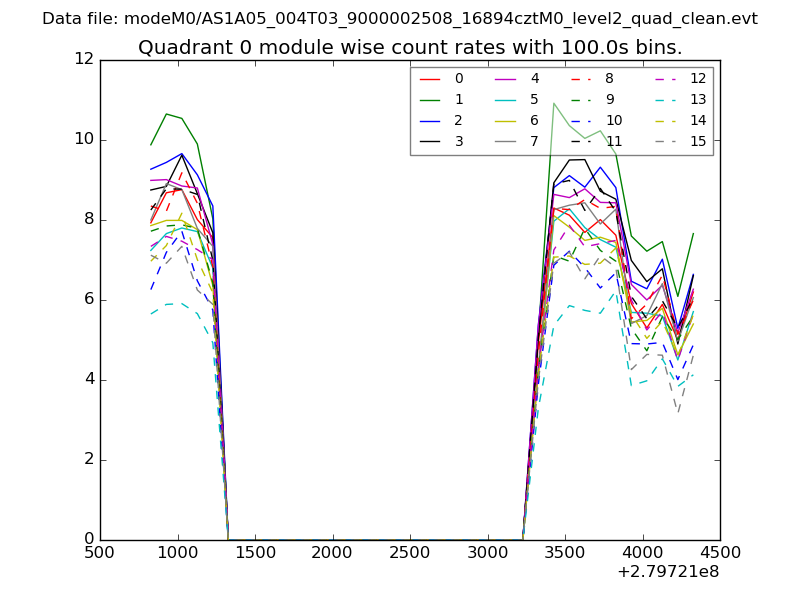 |
 |
| Module-wise count rates for Quadrant B Data is divided into 100 sec bins |
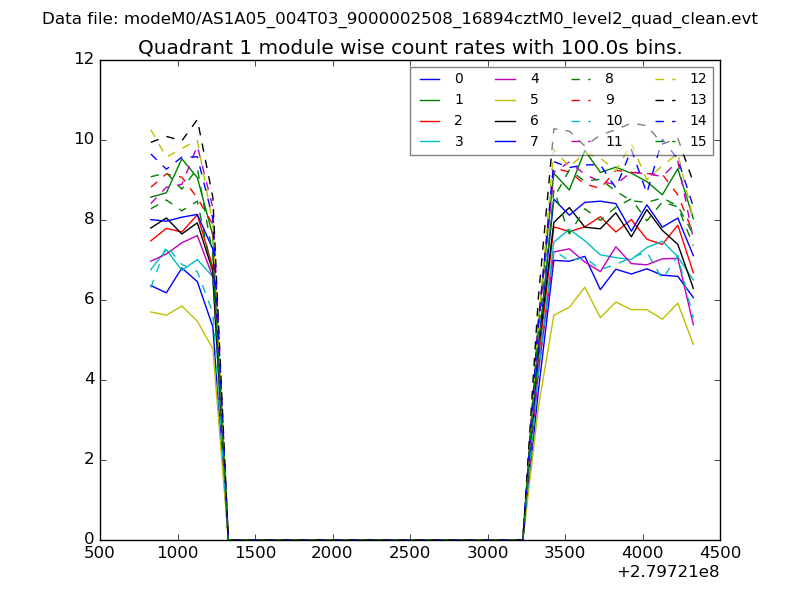 |
 |
| Module-wise count rates for Quadrant C Data is divided into 100 sec bins |
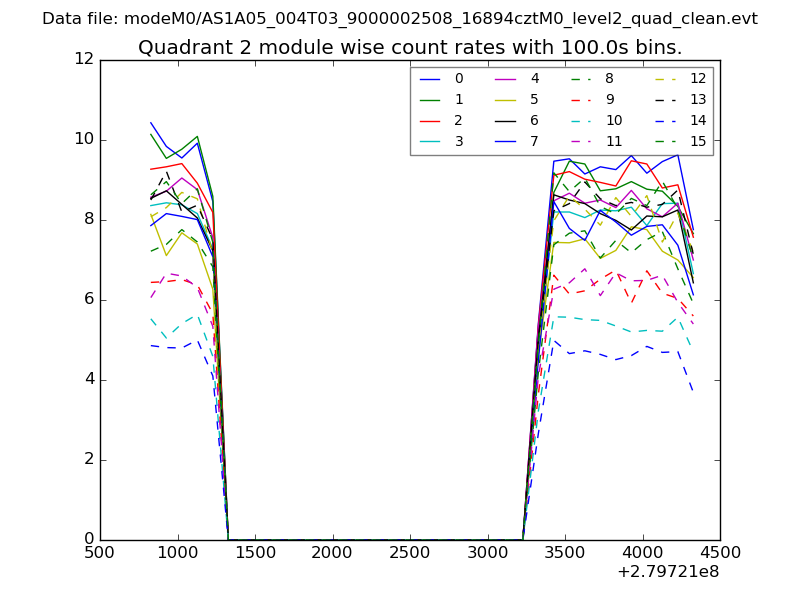 |
 |
| Module-wise count rates for Quadrant D Data is divided into 100 sec bins |
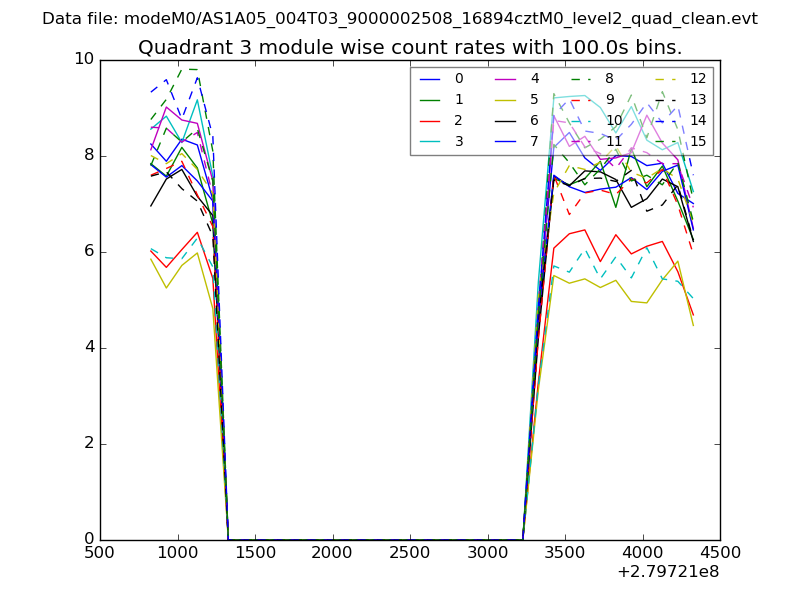 |
 |
| Parameter | Plot |
|---|---|
| CZT HV Monitor | 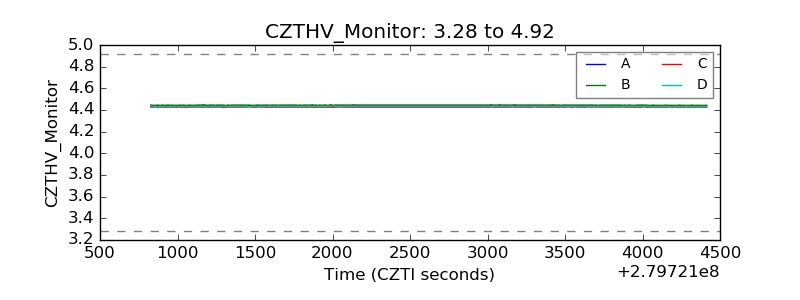 |
| D_VDD | 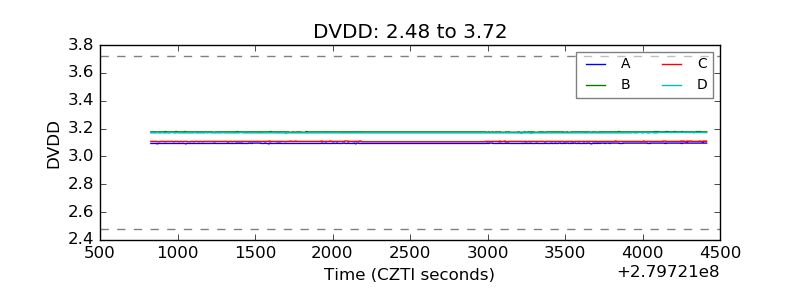 |
| Temperature 1 | 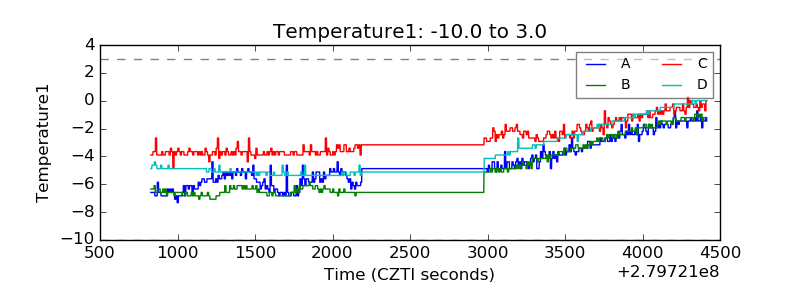 |
| Veto HV Monitor | 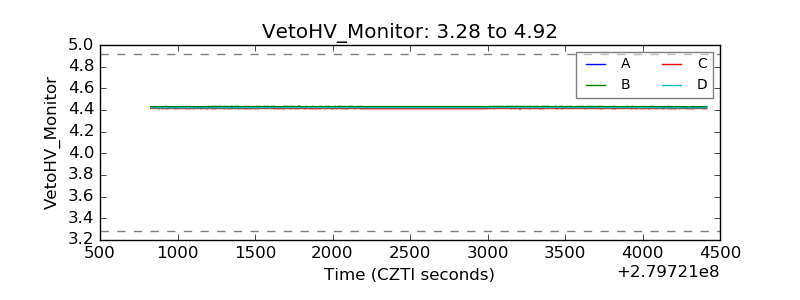 |
| Veto LLD | 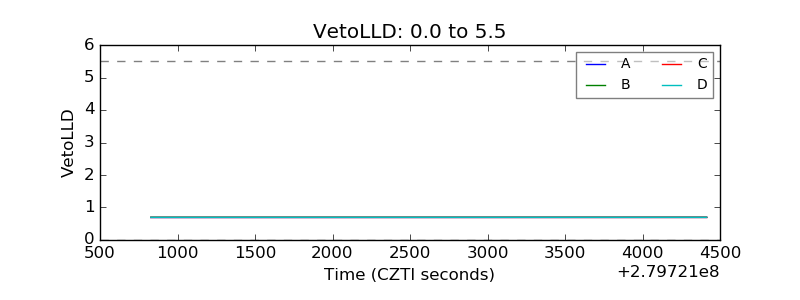 |
| Alpha Counter | 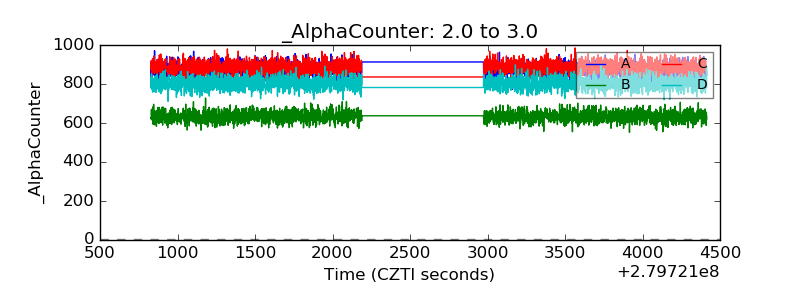 |
| _CPM_Rate | 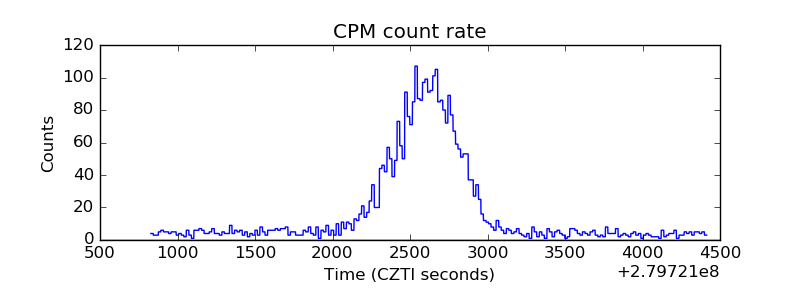 |
| CZT Counter |  |
| +2.5 Volts monitor |  |
| +5 Volts monitor |  |
| _ROLL_ROT | 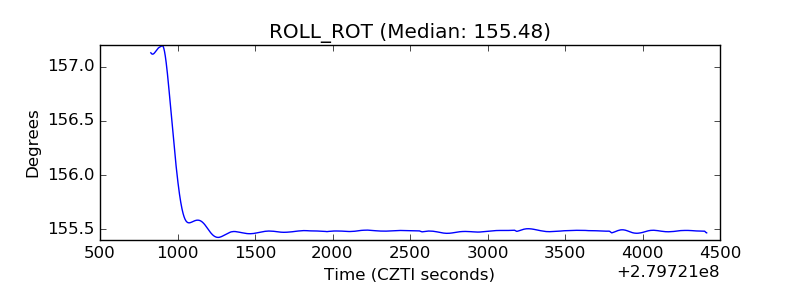 |
| _Roll_DEC | 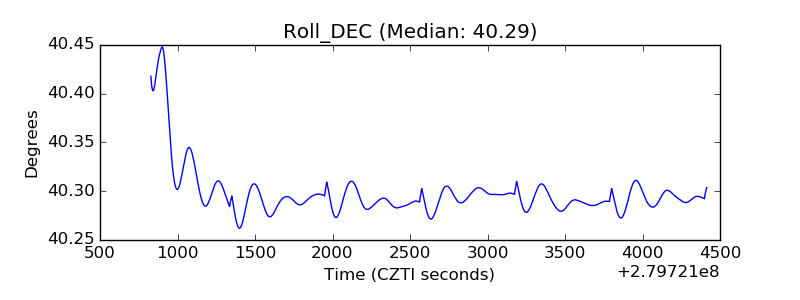 |
| _Roll_RA |  |
| Veto Counter | 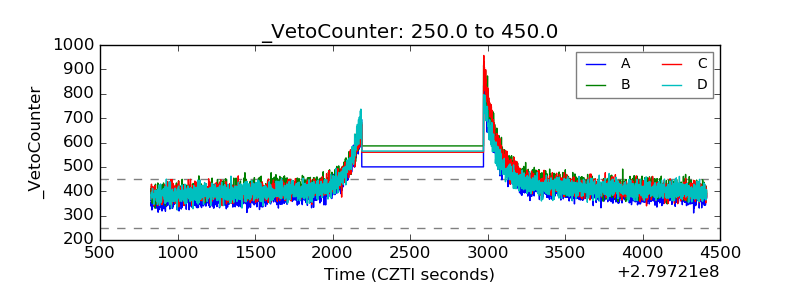 |