| Param | Original file | Final file |
|---|---|---|
| Filename | modeM0/AS1A05_004T03_9000002508_16895cztM0_level2.evt | modeM0/AS1A05_004T03_9000002508_16895cztM0_level2_quad_clean.evt |
| Size (bytes) | 636,511,680 | 104,100,480 |
| Size | 607.0 MB | 99.3 MB |
| Events in quadrant A | 7,098,569 | 642,011 |
| Events in quadrant B | 3,820,690 | 692,927 |
| Events in quadrant C | 3,435,079 | 664,316 |
| Events in quadrant D | 4,431,665 | 648,901 |
| Mode M0 | |||
|---|---|---|---|
| Quadrant | BADHDUFLAG | Total packets | Discarded packets |
| A | 0 | 26095 | 1 |
| B | 0 | 15842 | 1 |
| C | 0 | 14888 | 1 |
| D | 0 | 17781 | 1 |
| Mode SS | |||
|---|---|---|---|
| Quadrant | BADHDUFLAG | Total packets | Discarded packets |
| A | 0 | 148 | 0 |
| B | 0 | 148 | 0 |
| C | 0 | 148 | 0 |
| D | 0 | 148 | 0 |
| Mode M9 | |||
|---|---|---|---|
| Quadrant | BADHDUFLAG | Total packets | Discarded packets |
| A | 0 | 5 | 0 |
| B | 0 | 5 | 0 |
| C | 0 | 5 | 0 |
| D | 0 | 5 | 0 |
| Quadrant | Total seconds | Saturated seconds | Saturation percentage |
|---|---|---|---|
| A | 7243 | 1562 | 21.565650% |
| B | 7244 | 95 | 1.311430% |
| C | 7244 | 112 | 1.546107% |
| D | 7244 | 118 | 1.628934% |
Noise dominated data is calculated using 1-second bins in cleaned event files. If a bin has >2000 counts, and if more than 50% of those come from <1% of pixels, then it is considered to be noise-dominated and hence unusable.
| Quadrant | # 1 sec bins | Bins with >0 counts | Bins with >2000 counts | High rate bins dominated by noise | Noise dominated (total time) | Noise dominated (detector-on time) | Marked lightcurve |
|---|---|---|---|---|---|---|---|
| A | 7704 | 7246 | 898 | 898 | 11.66% | 12.39% | 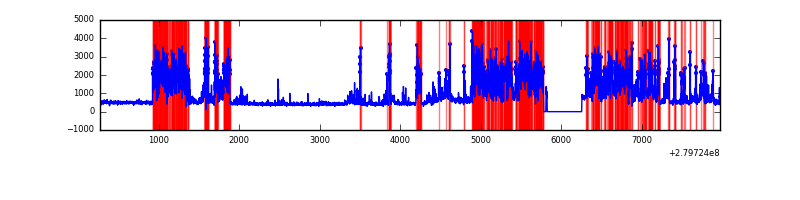 |
| B | 7705 | 7247 | 3 | 3 | 0.04% | 0.04% | 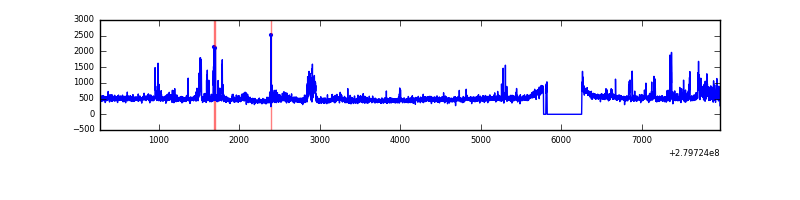 |
| C | 7705 | 7247 | 0 | 0 | 0.00% | 0.00% | 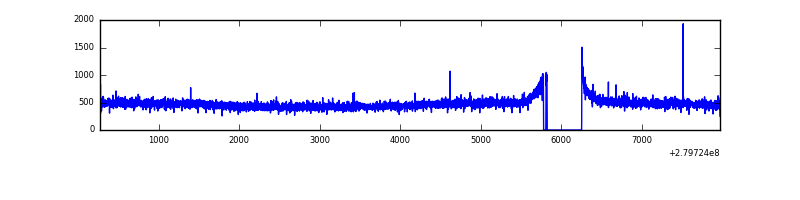 |
| D | 7705 | 7247 | 62 | 62 | 0.80% | 0.86% | 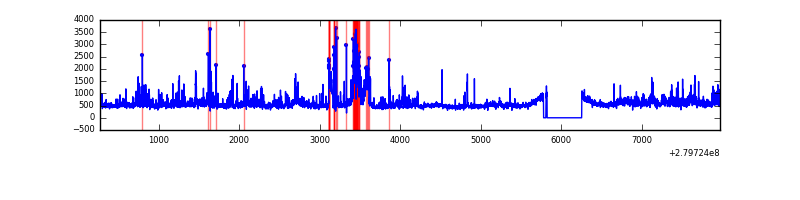 |
Top three noisy pixels from each quadrant. If the there are fewer than three noisy pixels in the level2.evt file, extra rows are filled as -1
| Pixel properties | Quadrant properties | ||||||
|---|---|---|---|---|---|---|---|
| Quadrant | DetID | PixID | Counts | Sigma | Mean | Median | Sigma |
| A | 15 | 174 | 3966882 | 24601.48 | 796 | 776 | 161.2 |
| A | 12 | 189 | 62953 | 385.68 | 796 | 776 | 161.2 |
| A | 0 | 226 | 7136 | 39.45 | 796 | 776 | 161.2 |
| B | 15 | 35 | 205450 | 1218.99 | 867 | 844 | 167.8 |
| B | 0 | 229 | 71688 | 422.07 | 867 | 844 | 167.8 |
| B | 4 | 216 | 32504 | 188.62 | 867 | 844 | 167.8 |
| C | 14 | 238 | 128470 | 658.56 | 832 | 834 | 193.8 |
| C | 3 | 233 | 48912 | 248.07 | 832 | 834 | 193.8 |
| C | 13 | 61 | 5943 | 26.36 | 832 | 834 | 193.8 |
| D | 1 | 52 | 899199 | 4334.95 | 847 | 821 | 207.2 |
| D | 15 | 0 | 192508 | 924.95 | 847 | 821 | 207.2 |
| D | 10 | 199 | 47192 | 223.75 | 847 | 821 | 207.2 |
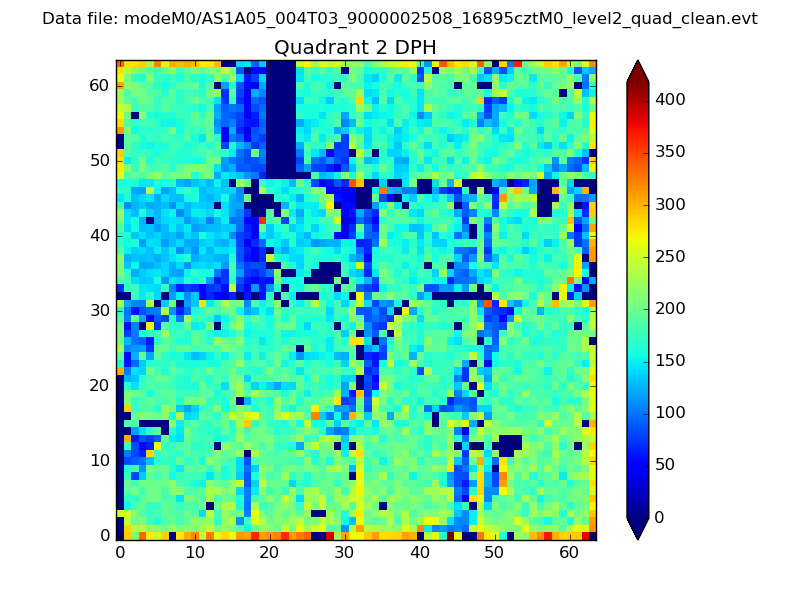
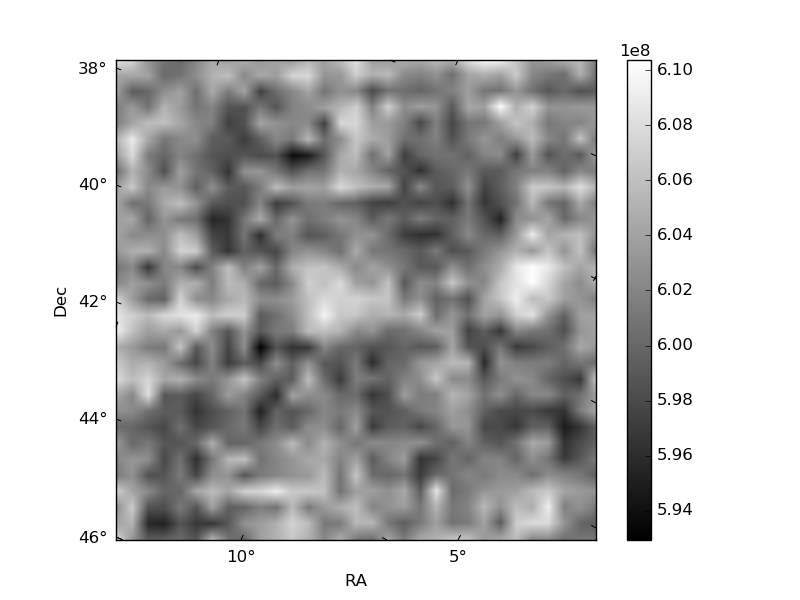
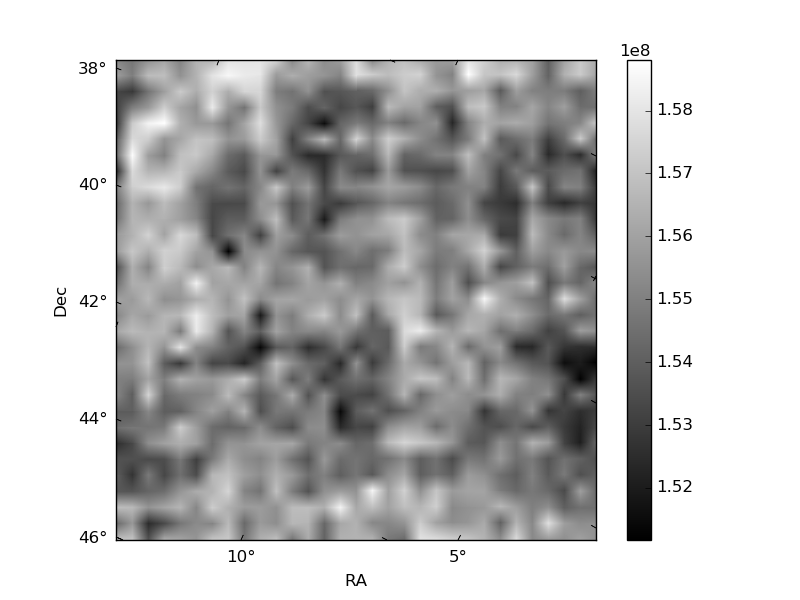
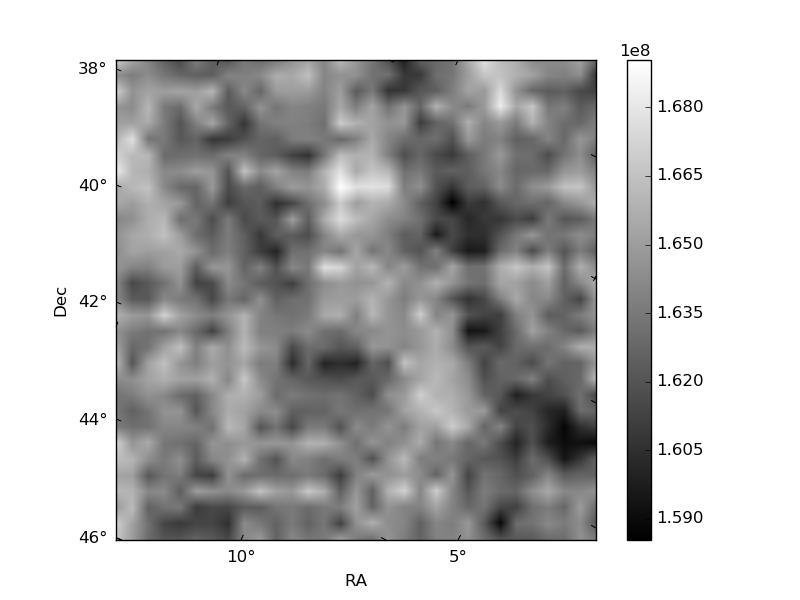
Histogram calculated using DETX and DETY for each event in the final _common_clean file
| Quadrant A | 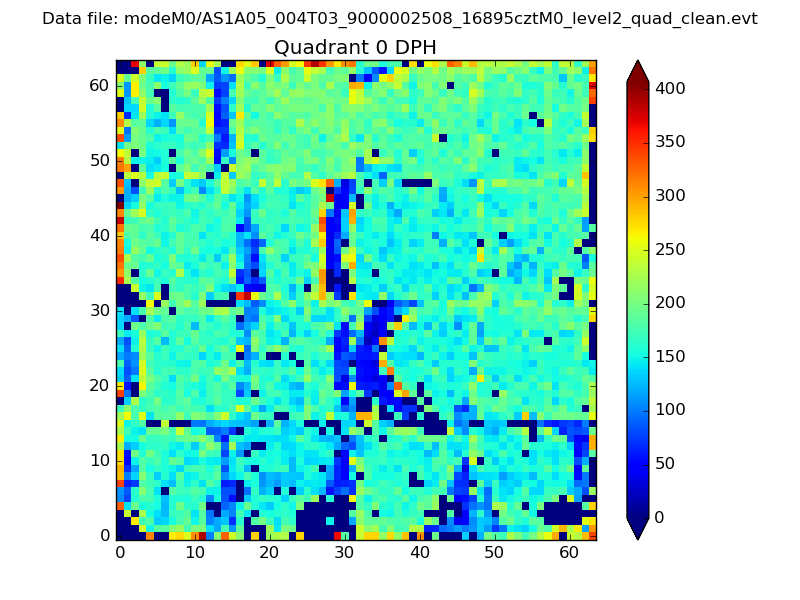 |
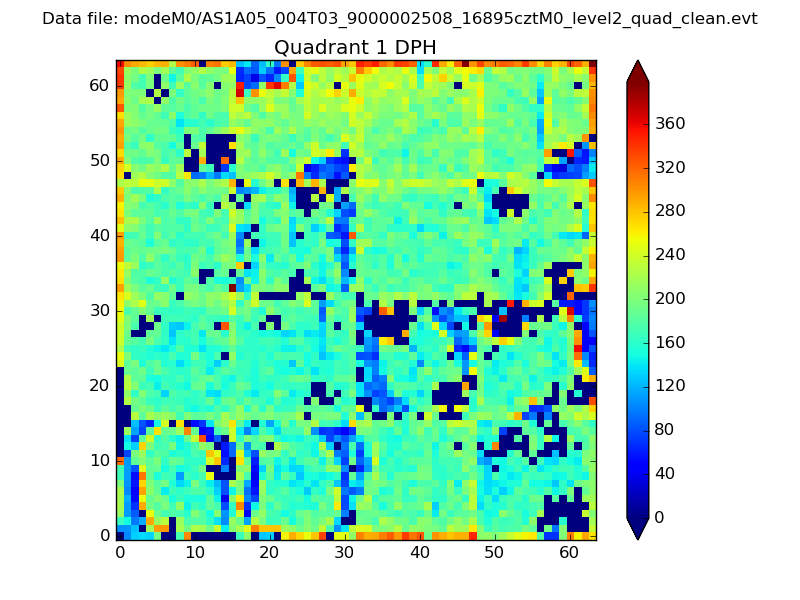 |
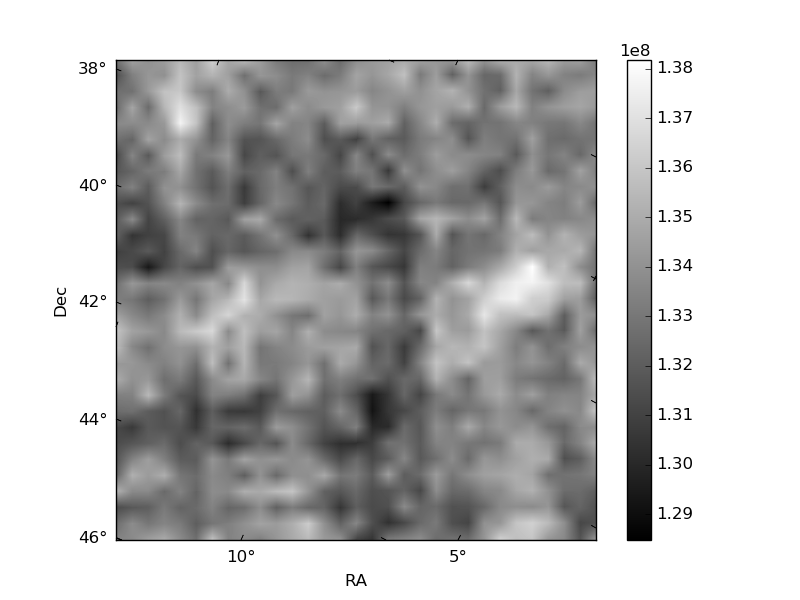
Quadrant B |
|---|---|---|---|
| Quadrant D | 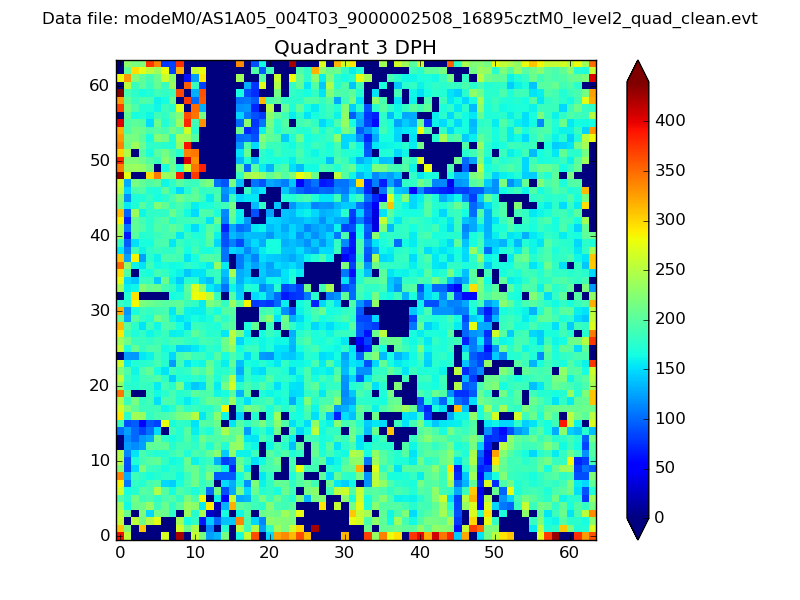 |
 |
Quadrant C |
| Plot type | Count rate plots | Images |
|---|---|---|
| Comparison with Poisson distribution Blue bars denote a histogram of data divided into 1 sec bins. Red curve is a Poisson curve with rate = median count rate of data. |
 |
 |
| Quadrant-wise count rates Data is divided into 100 sec bins |
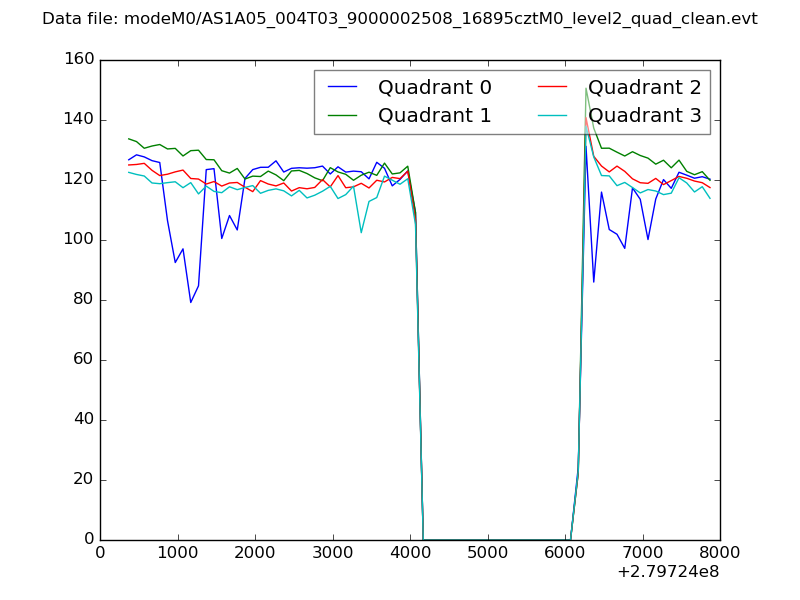 |
|
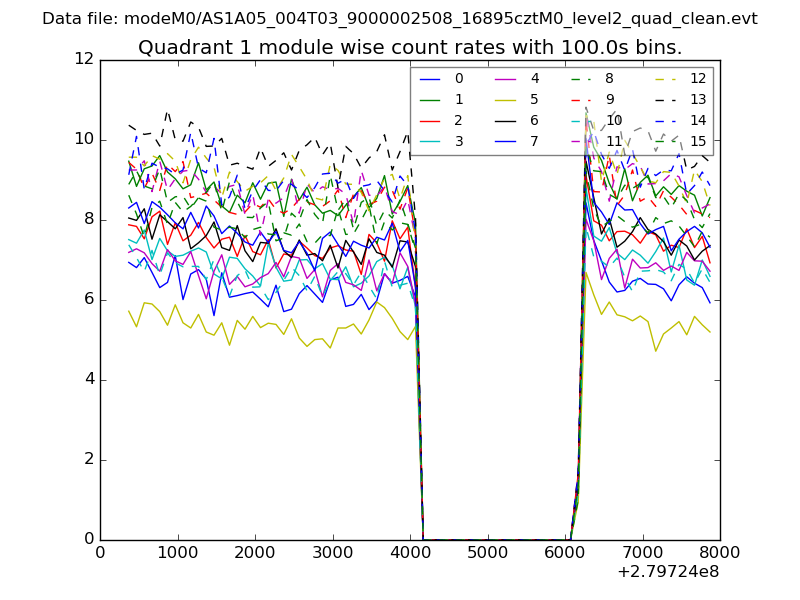
| Module-wise count rates for Quadrant A Data is divided into 100 sec bins |
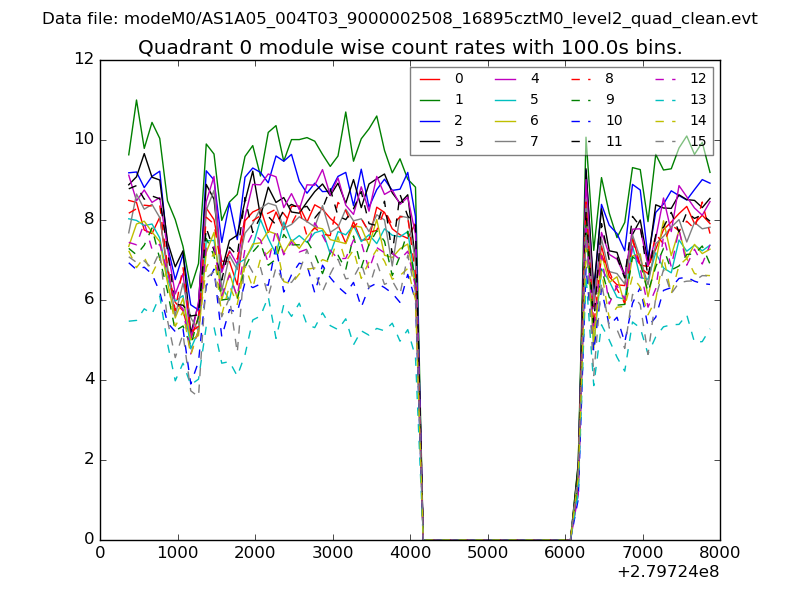 |
 |
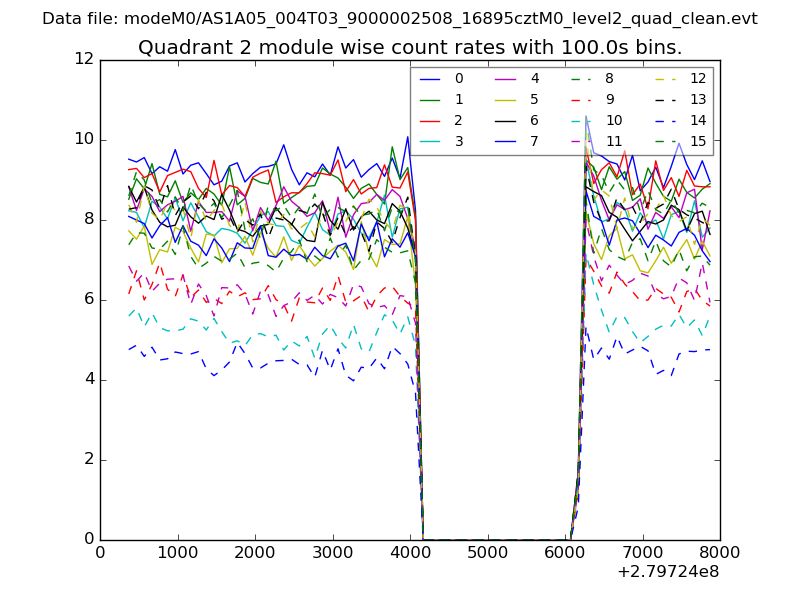
| Module-wise count rates for Quadrant B Data is divided into 100 sec bins |
 |
 |
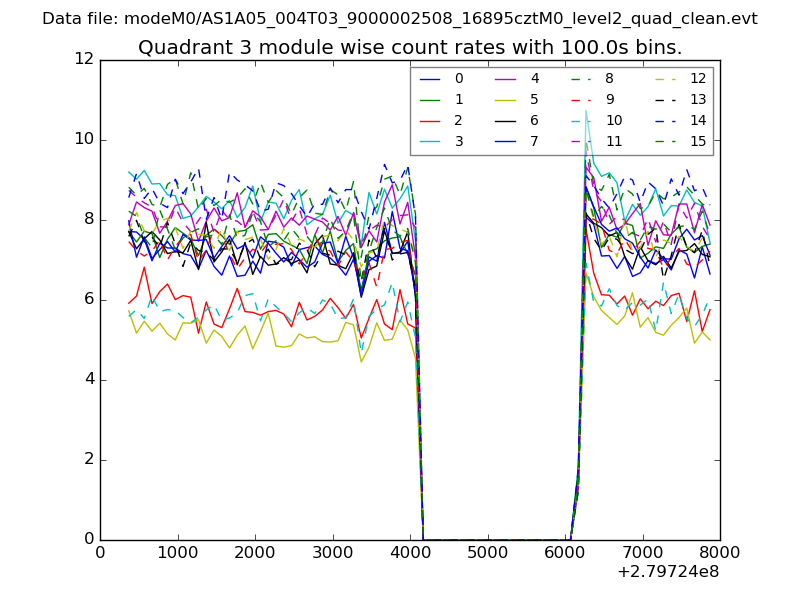
| Module-wise count rates for Quadrant C Data is divided into 100 sec bins |
 |
 |
| Module-wise count rates for Quadrant D Data is divided into 100 sec bins |
 |
 |
| Parameter | Plot |
|---|---|
| CZT HV Monitor | 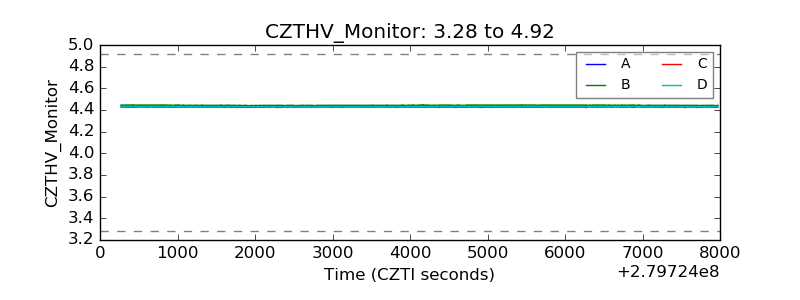 |
| D_VDD | 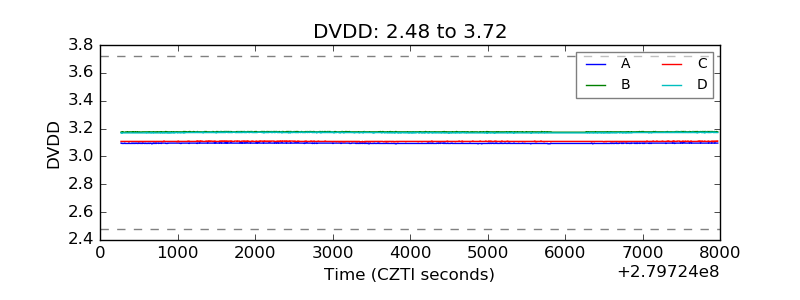 |
| Temperature 1 | 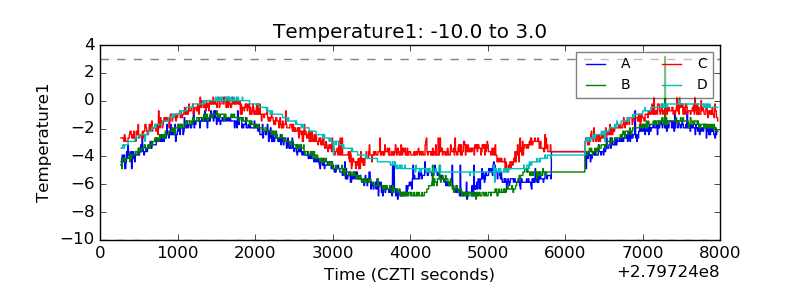 |
| Veto HV Monitor | 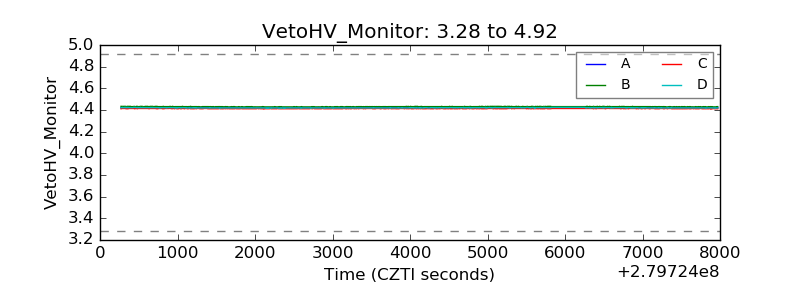 |
| Veto LLD | 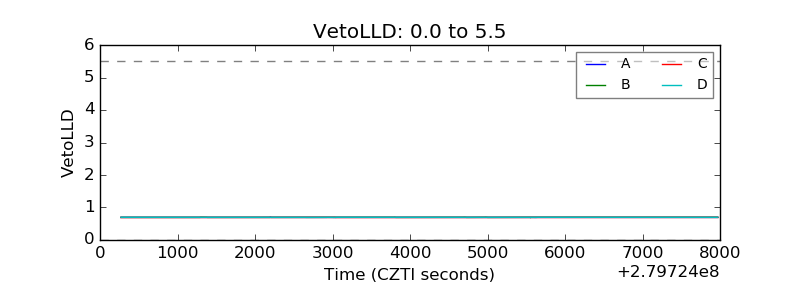 |
| Alpha Counter | 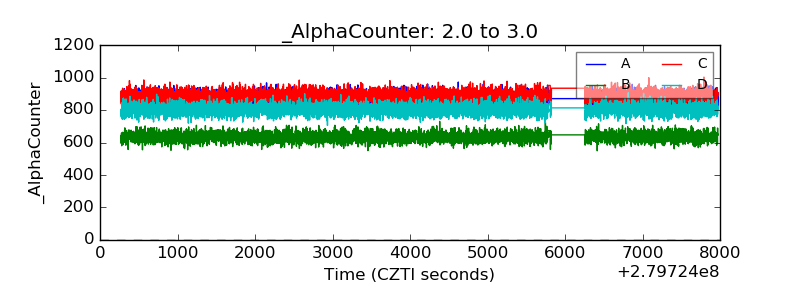 |
| _CPM_Rate | 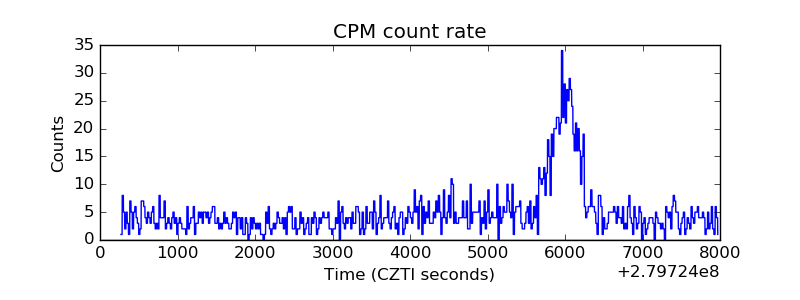 |
| CZT Counter | 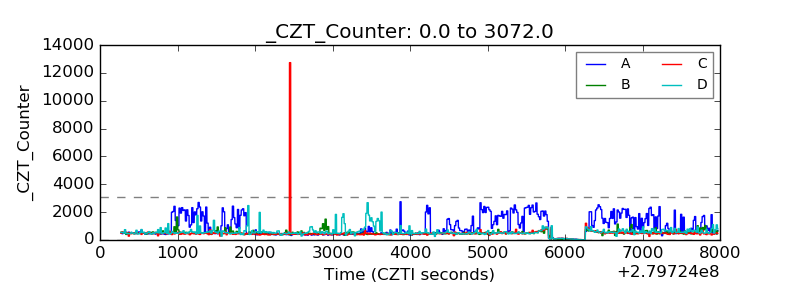 |
| +2.5 Volts monitor |  |
| +5 Volts monitor |  |
| _ROLL_ROT | 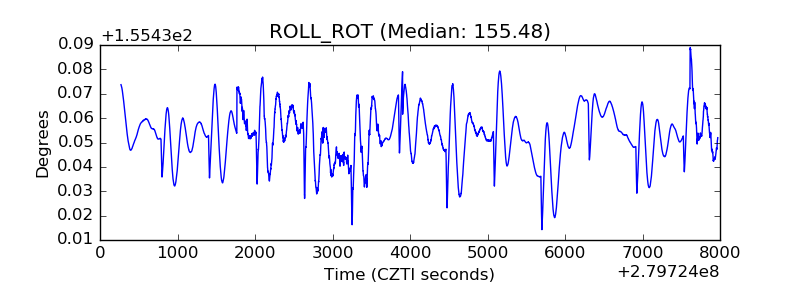 |
| _Roll_DEC | 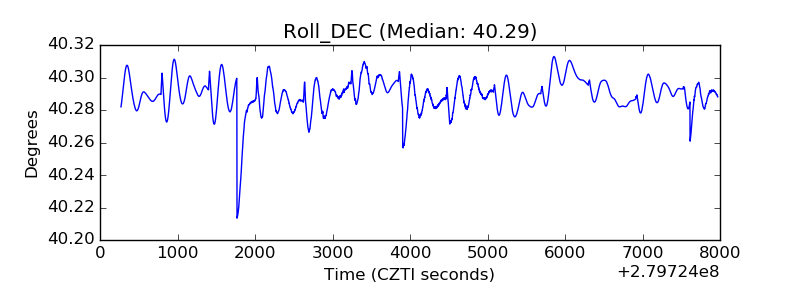 |
| _Roll_RA | 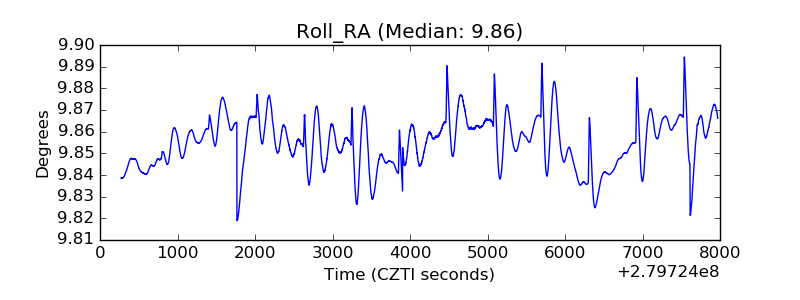 |
| Veto Counter | 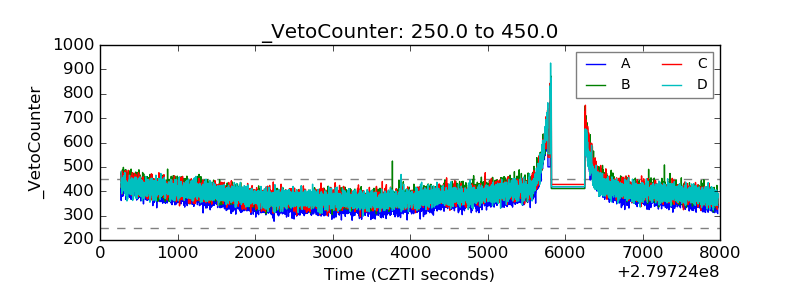 |