| Param | Original file | Final file |
|---|---|---|
| Filename | modeM0/AS1A05_004T03_9000002508_16900cztM0_level2.evt | modeM0/AS1A05_004T03_9000002508_16900cztM0_level2_quad_clean.evt |
| Size (bytes) | 1,629,843,840 | 188,737,920 |
| Size | 1.5 GB | 180.0 MB |
| Events in quadrant A | 16,382,887 | 1,094,040 |
| Events in quadrant B | 9,239,553 | 1,168,792 |
| Events in quadrant C | 8,779,747 | 1,127,595 |
| Events in quadrant D | 13,721,821 | 1,061,218 |
| Mode M0 | |||
|---|---|---|---|
| Quadrant | BADHDUFLAG | Total packets | Discarded packets |
| A | 0 | 61288 | 4 |
| B | 0 | 39714 | 4 |
| C | 0 | 38227 | 4 |
| D | 0 | 53186 | 5 |
| Mode SS | |||
|---|---|---|---|
| Quadrant | BADHDUFLAG | Total packets | Discarded packets |
| A | 0 | 374 | 0 |
| B | 0 | 374 | 0 |
| C | 0 | 374 | 0 |
| D | 0 | 374 | 0 |
| Mode M9 | |||
|---|---|---|---|
| Quadrant | BADHDUFLAG | Total packets | Discarded packets |
| A | 0 | 21 | 0 |
| B | 0 | 22 | 0 |
| C | 0 | 22 | 0 |
| D | 0 | 22 | 0 |
| Quadrant | Total seconds | Saturated seconds | Saturation percentage |
|---|---|---|---|
| A | 18327 | 2610 | 14.241283% |
| B | 18327 | 166 | 0.905767% |
| C | 18327 | 146 | 0.796639% |
| D | 18326 | 1338 | 7.301102% |
Noise dominated data is calculated using 1-second bins in cleaned event files. If a bin has >2000 counts, and if more than 50% of those come from <1% of pixels, then it is considered to be noise-dominated and hence unusable.
| Quadrant | # 1 sec bins | Bins with >0 counts | Bins with >2000 counts | High rate bins dominated by noise | Noise dominated (total time) | Noise dominated (detector-on time) | Marked lightcurve |
|---|---|---|---|---|---|---|---|
| A | 20463 | 18330 | 1738 | 1738 | 8.49% | 9.48% | 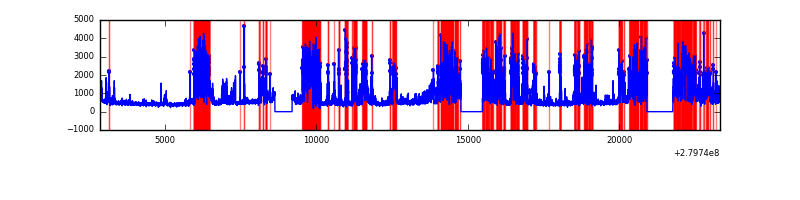 |
| B | 20463 | 18331 | 26 | 26 | 0.13% | 0.14% | 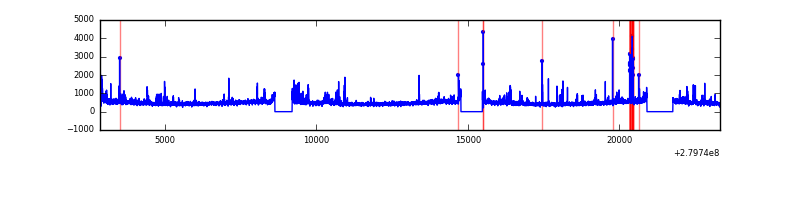 |
| C | 20463 | 18331 | 3 | 3 | 0.01% | 0.02% | 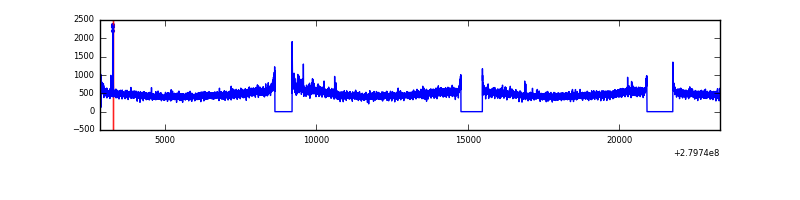 |
| D | 20462 | 18330 | 797 | 797 | 3.90% | 4.35% | 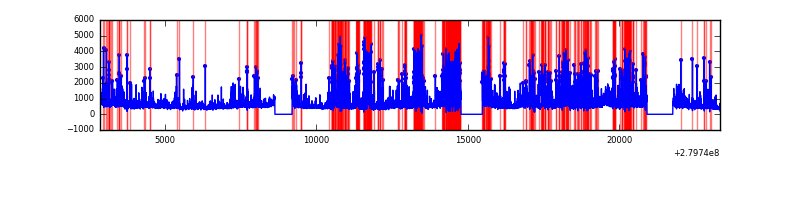 |
Top three noisy pixels from each quadrant. If the there are fewer than three noisy pixels in the level2.evt file, extra rows are filled as -1
| Pixel properties | Quadrant properties | ||||||
|---|---|---|---|---|---|---|---|
| Quadrant | DetID | PixID | Counts | Sigma | Mean | Median | Sigma |
| A | 15 | 174 | 8361001 | 20596.99 | 2028 | 1982 | 405.8 |
| A | 12 | 189 | 205536 | 501.57 | 2028 | 1982 | 405.8 |
| A | 4 | 2 | 21353 | 47.73 | 2028 | 1982 | 405.8 |
| B | 15 | 35 | 486241 | 1191.72 | 2135 | 2080 | 406.3 |
| B | 4 | 216 | 118022 | 285.38 | 2135 | 2080 | 406.3 |
| B | 0 | 229 | 91083 | 219.07 | 2135 | 2080 | 406.3 |
| C | 3 | 233 | 415334 | 857.11 | 2056 | 2068 | 482.2 |
| C | 14 | 238 | 315561 | 650.18 | 2056 | 2068 | 482.2 |
| C | 0 | 207 | 17569 | 32.15 | 2056 | 2068 | 482.2 |
| D | 1 | 52 | 5646592 | 11508.28 | 2007 | 1944 | 490.5 |
| D | 12 | 235 | 178775 | 360.52 | 2007 | 1944 | 490.5 |
| D | 10 | 199 | 118031 | 236.68 | 2007 | 1944 | 490.5 |
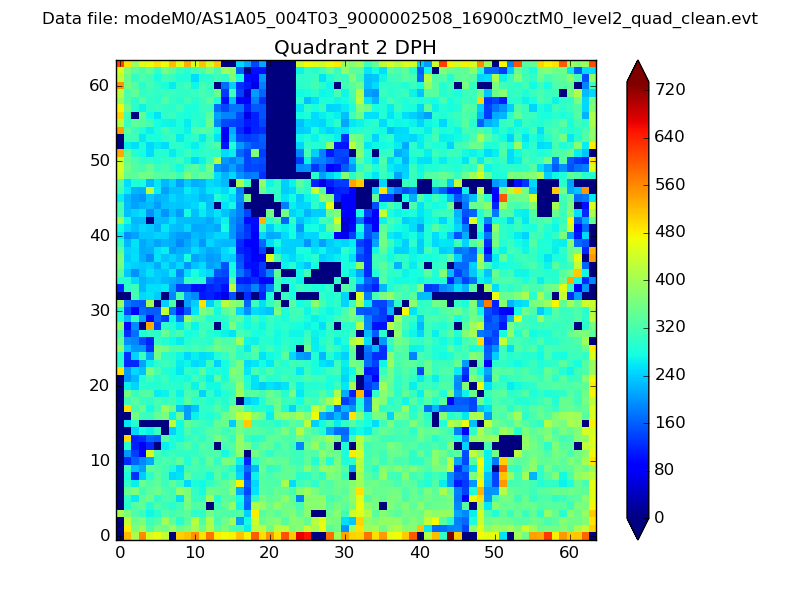
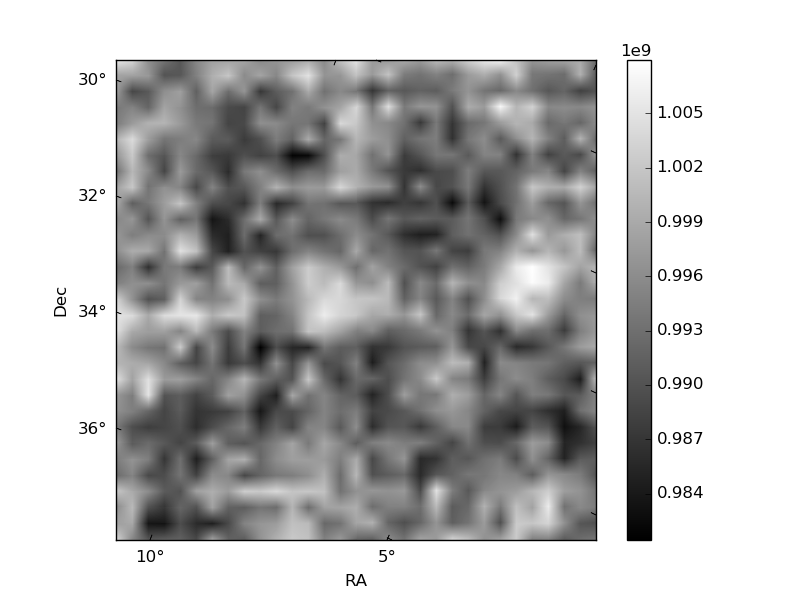
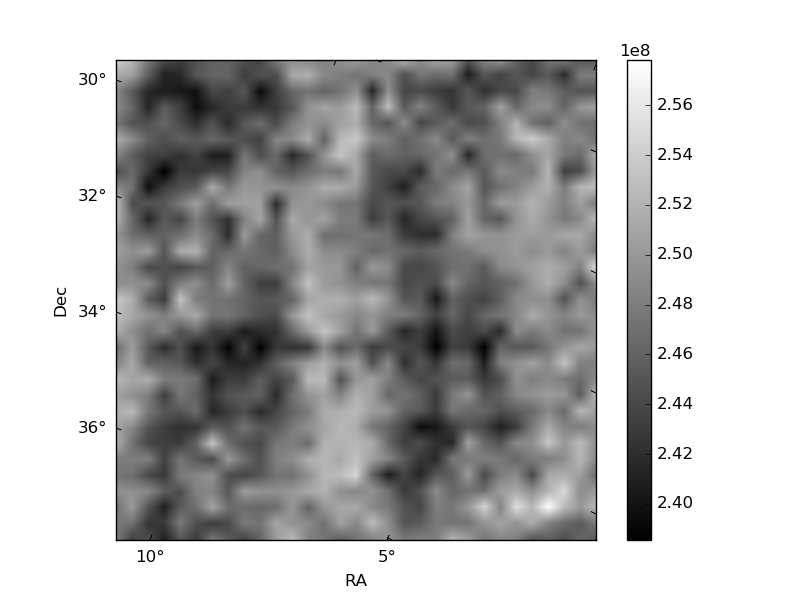
Histogram calculated using DETX and DETY for each event in the final _common_clean file
| Quadrant A | 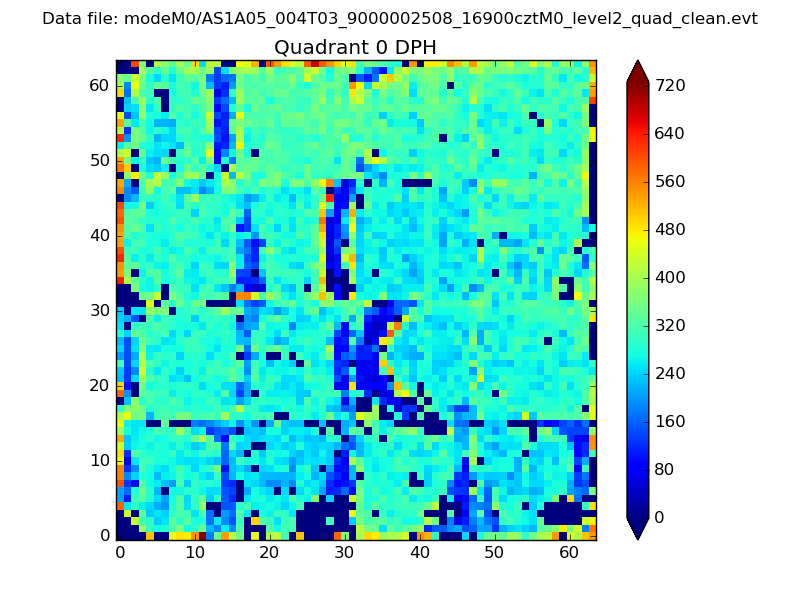 |
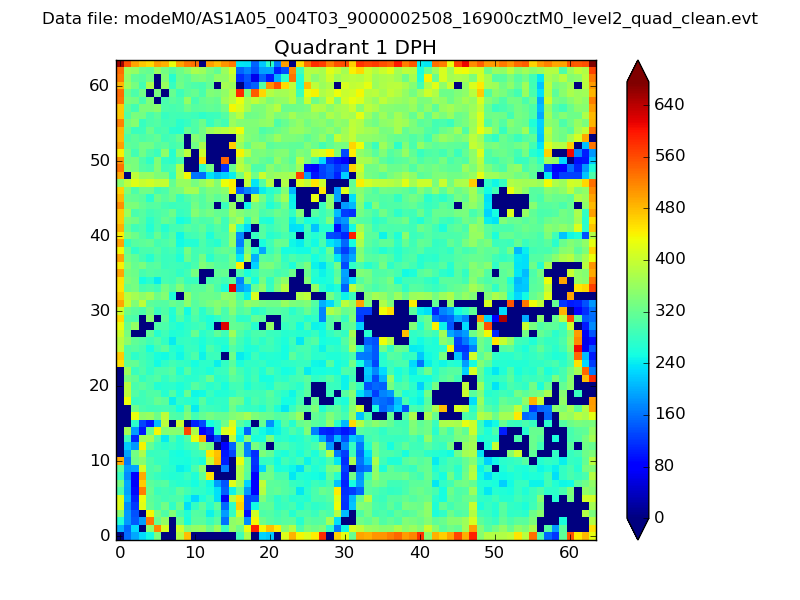 |
Quadrant B |
|---|---|---|---|
| Quadrant D | 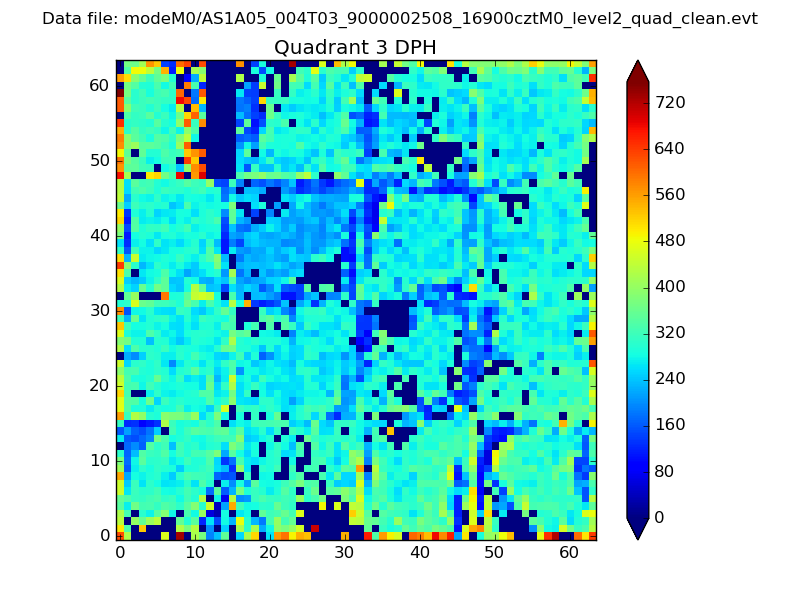 |
 |
Quadrant C |
| Plot type | Count rate plots | Images |
|---|---|---|
| Comparison with Poisson distribution Blue bars denote a histogram of data divided into 1 sec bins. Red curve is a Poisson curve with rate = median count rate of data. |
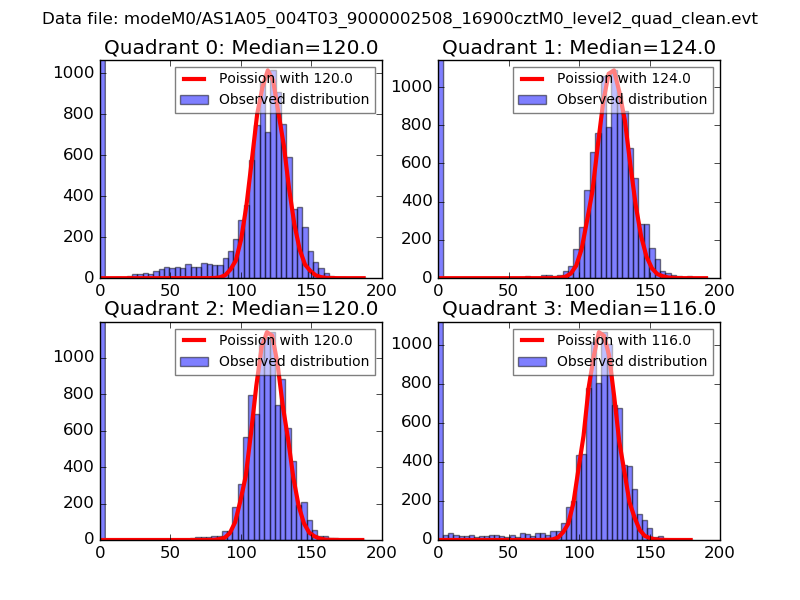 |
 |
| Quadrant-wise count rates Data is divided into 100 sec bins |
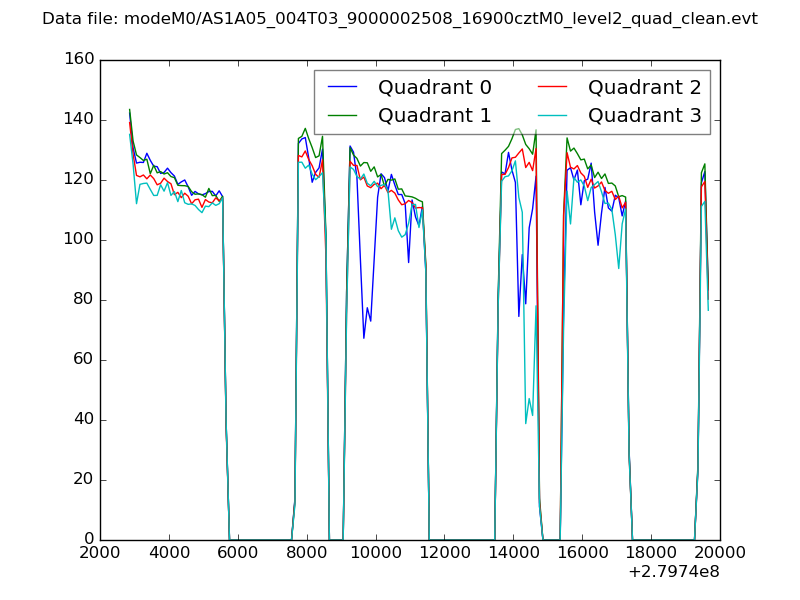 |
|
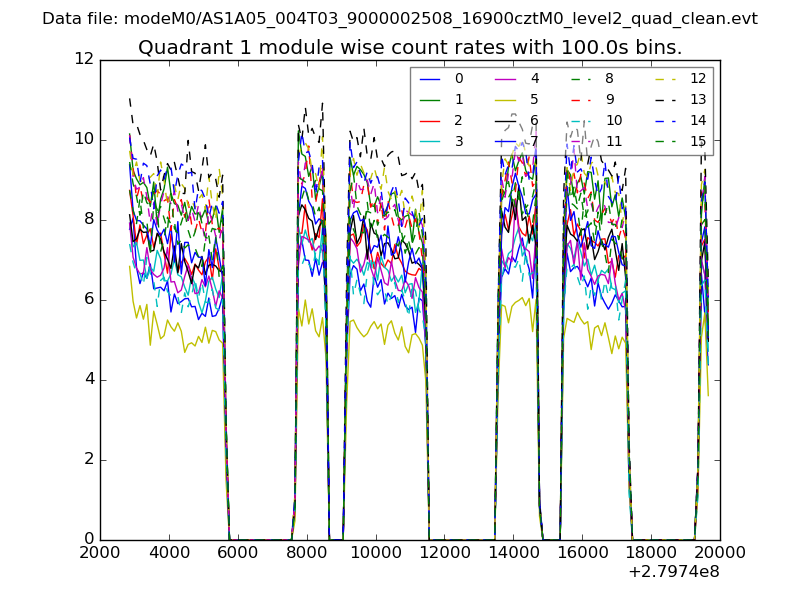
| Module-wise count rates for Quadrant A Data is divided into 100 sec bins |
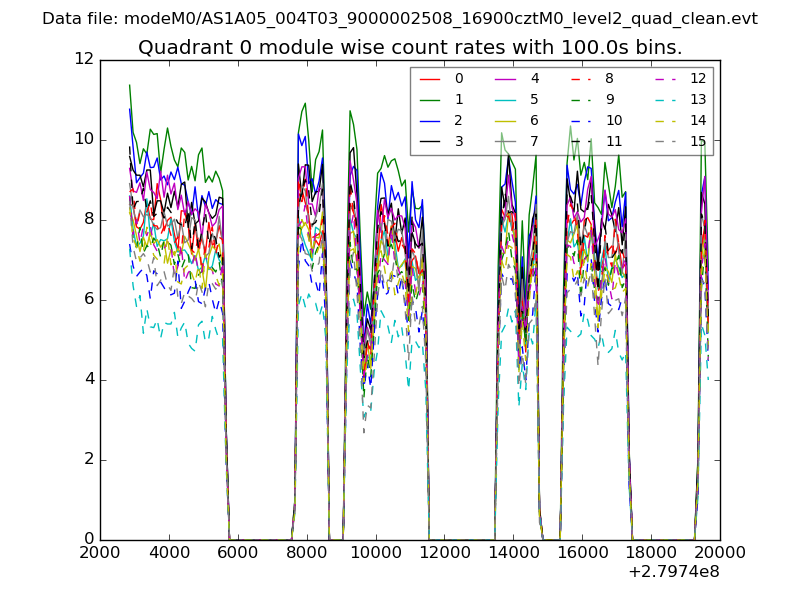 |
 |
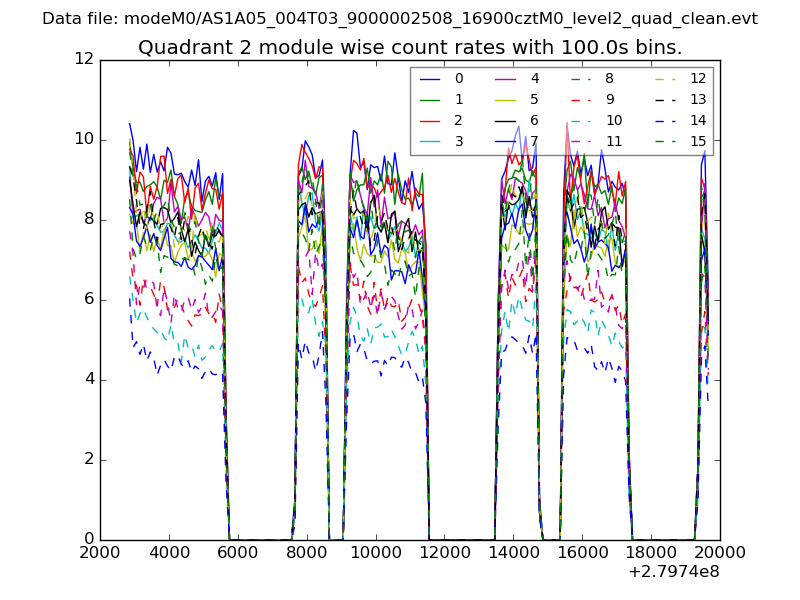
| Module-wise count rates for Quadrant B Data is divided into 100 sec bins |
 |
 |
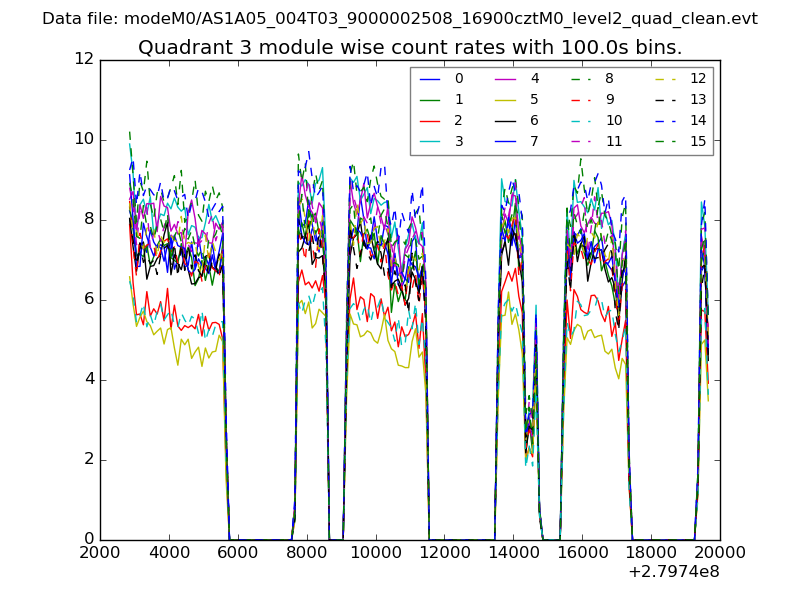
| Module-wise count rates for Quadrant C Data is divided into 100 sec bins |
 |
 |
| Module-wise count rates for Quadrant D Data is divided into 100 sec bins |
 |
 |
| Parameter | Plot |
|---|---|
| CZT HV Monitor | 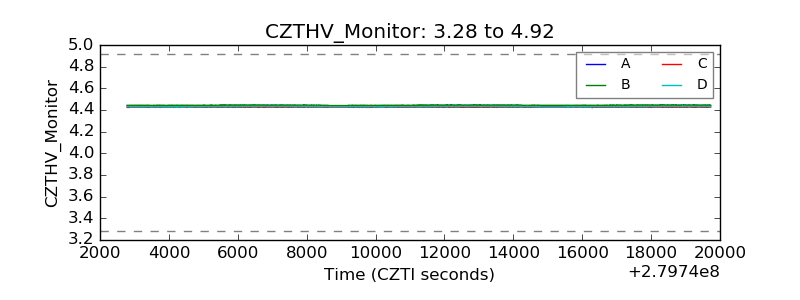 |
| D_VDD | 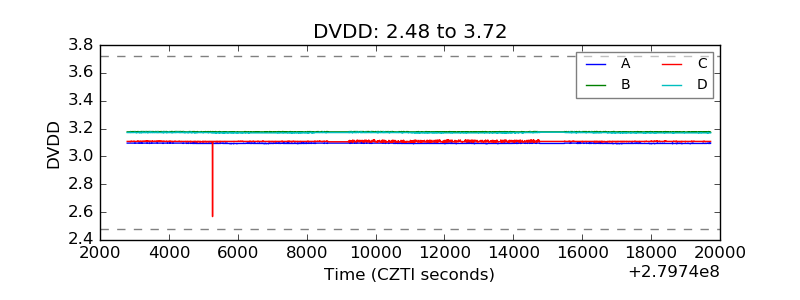 |
| Temperature 1 | 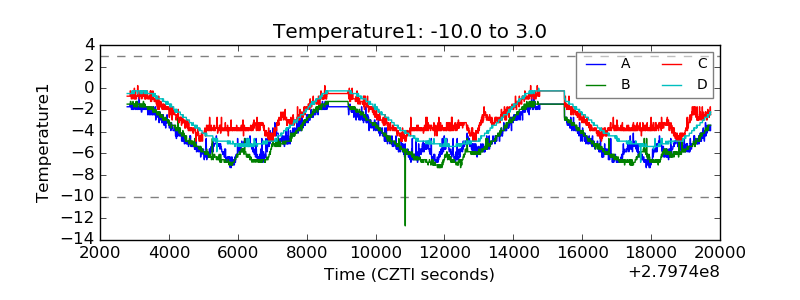 |
| Veto HV Monitor | 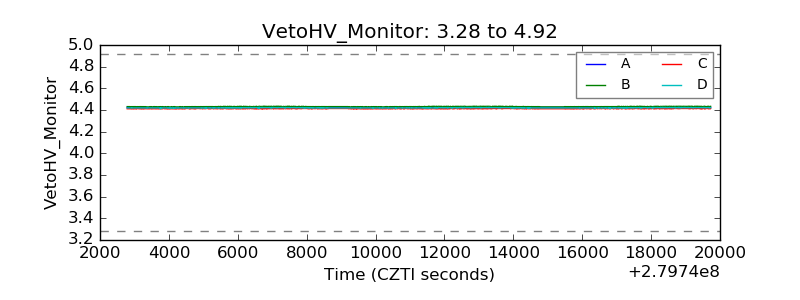 |
| Veto LLD | 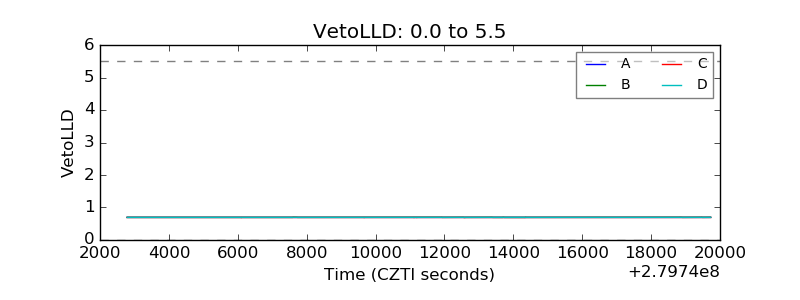 |
| Alpha Counter | 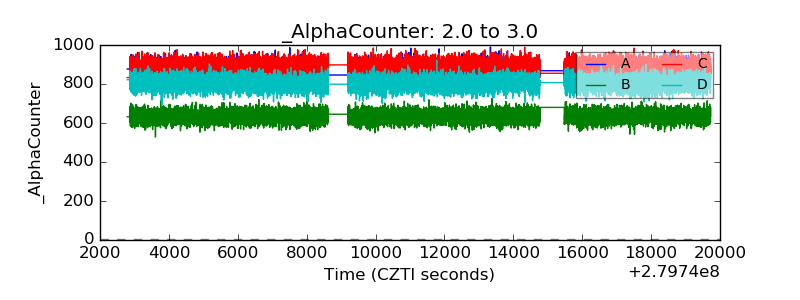 |
| _CPM_Rate | 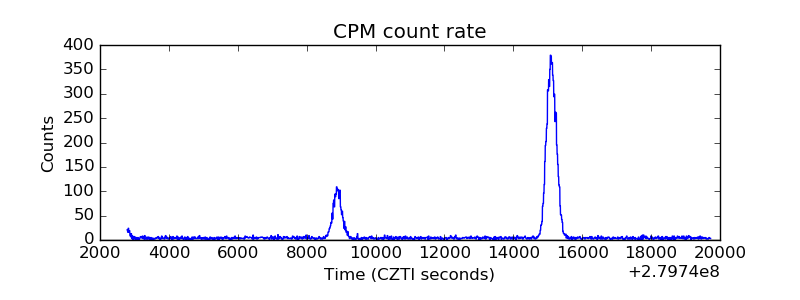 |
| CZT Counter | 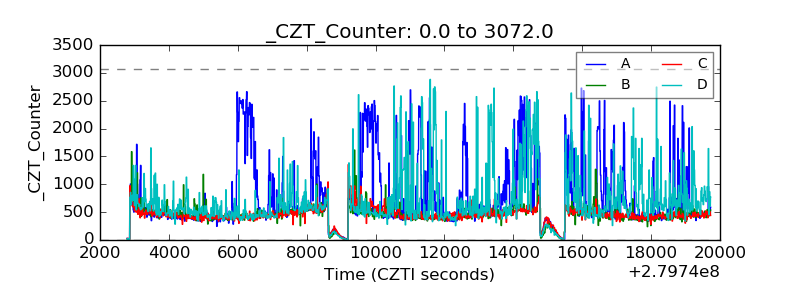 |
| +2.5 Volts monitor |  |
| +5 Volts monitor |  |
| _ROLL_ROT | 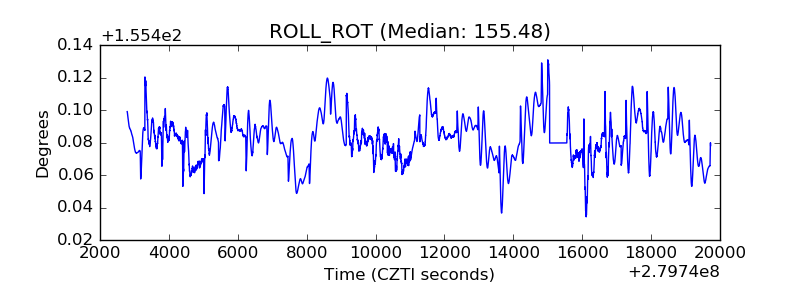 |
| _Roll_DEC | 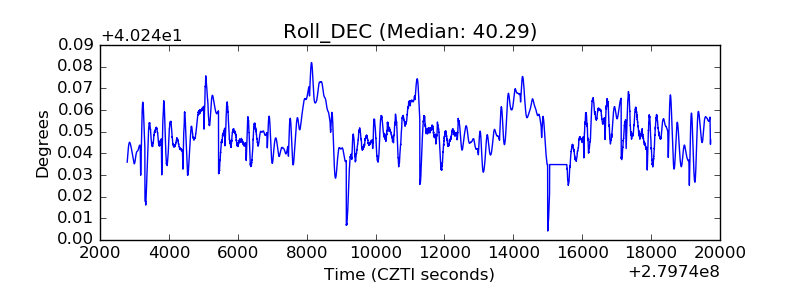 |
| _Roll_RA | 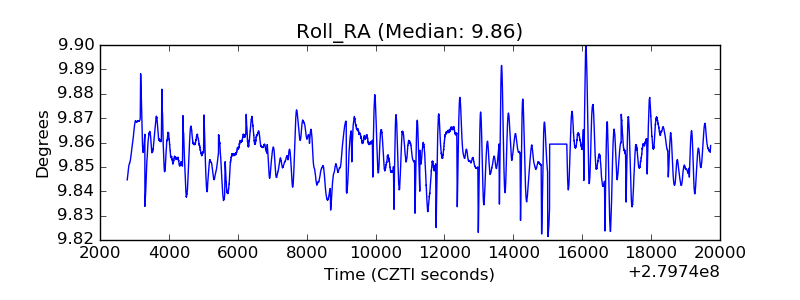 |
| Veto Counter | 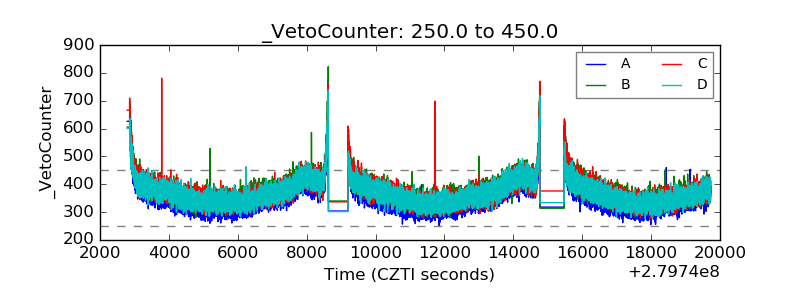 |