| Param | Original file | Final file |
|---|---|---|
| Filename | modeM0/AS1A05_004T03_9000002508_16901cztM0_level2.evt | modeM0/AS1A05_004T03_9000002508_16901cztM0_level2_quad_clean.evt |
| Size (bytes) | 609,393,600 | 47,139,840 |
| Size | 581.2 MB | 45.0 MB |
| Events in quadrant A | 7,278,900 | 223,503 |
| Events in quadrant B | 3,337,009 | 254,920 |
| Events in quadrant C | 3,142,044 | 245,443 |
| Events in quadrant D | 4,246,111 | 238,115 |
| Mode M0 | |||
|---|---|---|---|
| Quadrant | BADHDUFLAG | Total packets | Discarded packets |
| A | 0 | 26108 | 2 |
| B | 0 | 14257 | 2 |
| C | 0 | 13619 | 2 |
| D | 0 | 17196 | 2 |
| Mode SS | |||
|---|---|---|---|
| Quadrant | BADHDUFLAG | Total packets | Discarded packets |
| A | 0 | 136 | 0 |
| B | 0 | 136 | 0 |
| C | 0 | 136 | 0 |
| D | 0 | 136 | 0 |
| Mode M9 | |||
|---|---|---|---|
| Quadrant | BADHDUFLAG | Total packets | Discarded packets |
| A | 0 | 10 | 0 |
| B | 0 | 10 | 0 |
| C | 0 | 10 | 0 |
| D | 0 | 10 | 0 |
| Quadrant | Total seconds | Saturated seconds | Saturation percentage |
|---|---|---|---|
| A | 6661 | 1298 | 19.486564% |
| B | 6662 | 44 | 0.660462% |
| C | 6662 | 40 | 0.600420% |
| D | 6662 | 183 | 2.746923% |
Noise dominated data is calculated using 1-second bins in cleaned event files. If a bin has >2000 counts, and if more than 50% of those come from <1% of pixels, then it is considered to be noise-dominated and hence unusable.
| Quadrant | # 1 sec bins | Bins with >0 counts | Bins with >2000 counts | High rate bins dominated by noise | Noise dominated (total time) | Noise dominated (detector-on time) | Marked lightcurve |
|---|---|---|---|---|---|---|---|
| A | 7677 | 6662 | 917 | 917 | 11.94% | 13.76% | 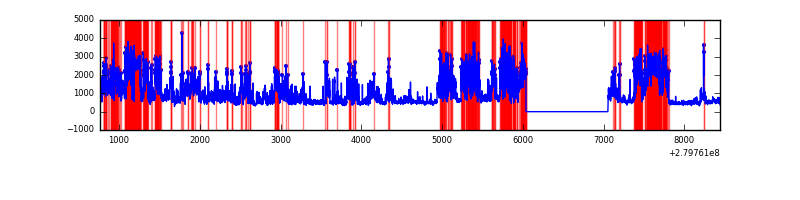 |
| B | 7678 | 6664 | 14 | 14 | 0.18% | 0.21% | 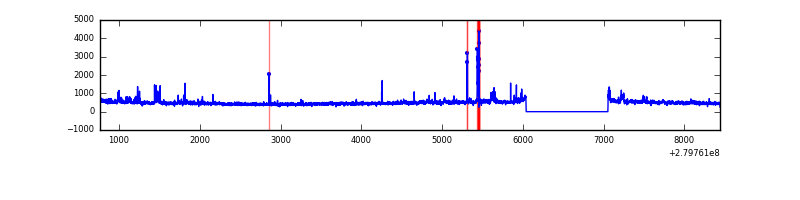 |
| C | 7678 | 6664 | 0 | 0 | 0.00% | 0.00% | 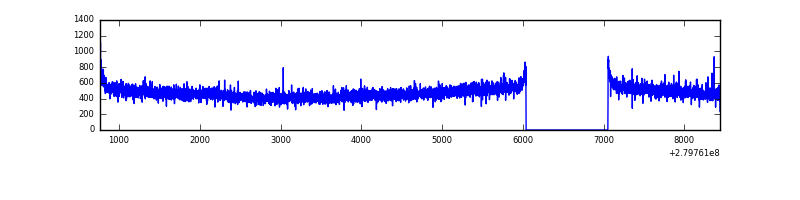 |
| D | 7678 | 6664 | 97 | 97 | 1.26% | 1.46% | 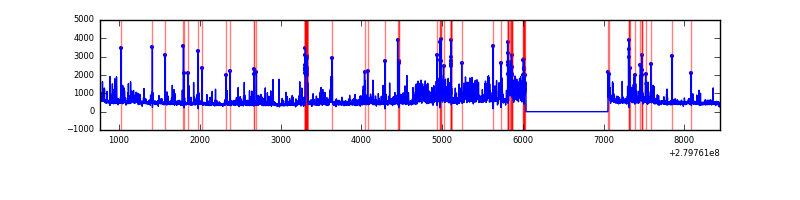 |
Top three noisy pixels from each quadrant. If the there are fewer than three noisy pixels in the level2.evt file, extra rows are filled as -1
| Pixel properties | Quadrant properties | ||||||
|---|---|---|---|---|---|---|---|
| Quadrant | DetID | PixID | Counts | Sigma | Mean | Median | Sigma |
| A | 15 | 174 | 4403453 | 30379.32 | 720 | 706 | 144.9 |
| A | 12 | 189 | 92778 | 635.3 | 720 | 706 | 144.9 |
| A | 4 | 2 | 9668 | 61.84 | 720 | 706 | 144.9 |
| B | 15 | 35 | 132951 | 882.61 | 787 | 766 | 149.8 |
| B | 0 | 219 | 43949 | 288.34 | 787 | 766 | 149.8 |
| B | 4 | 216 | 23791 | 153.74 | 787 | 766 | 149.8 |
| C | 14 | 238 | 116456 | 651.4 | 759 | 765 | 177.6 |
| C | 3 | 233 | 59797 | 332.38 | 759 | 765 | 177.6 |
| C | 13 | 61 | 5298 | 25.52 | 759 | 765 | 177.6 |
| D | 1 | 52 | 1159297 | 6298.83 | 754 | 731 | 183.9 |
| D | 12 | 235 | 88973 | 479.75 | 754 | 731 | 183.9 |
| D | 2 | 33 | 85566 | 461.23 | 754 | 731 | 183.9 |
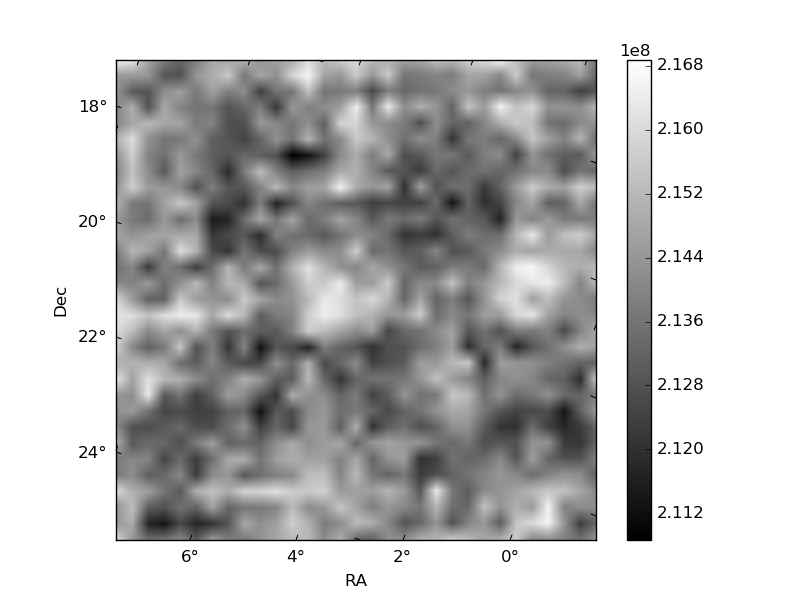
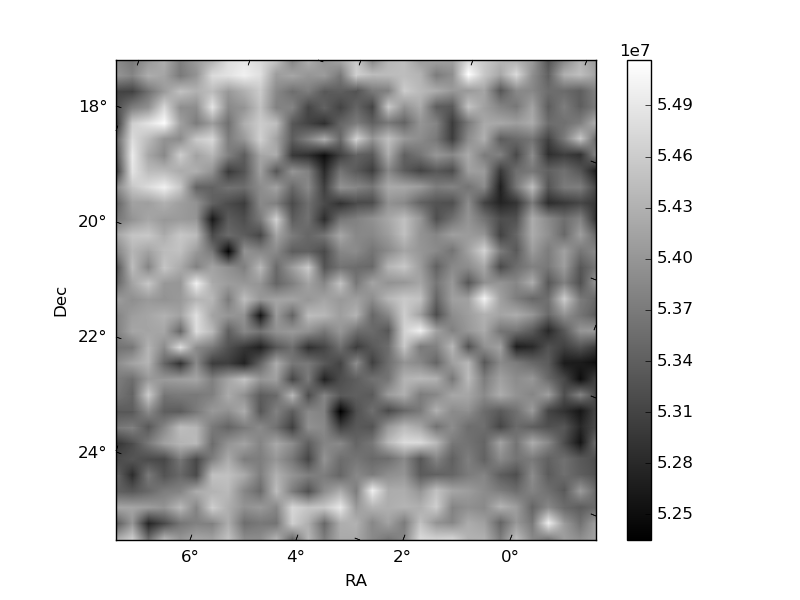
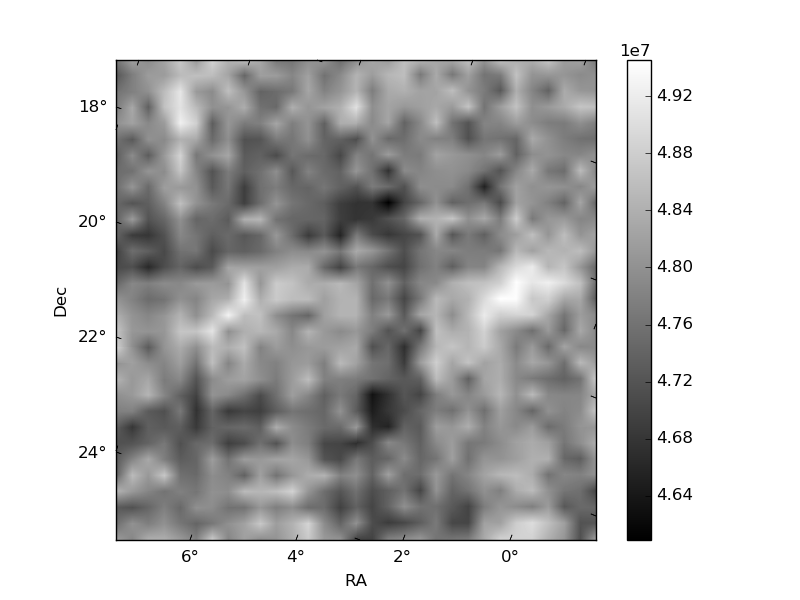
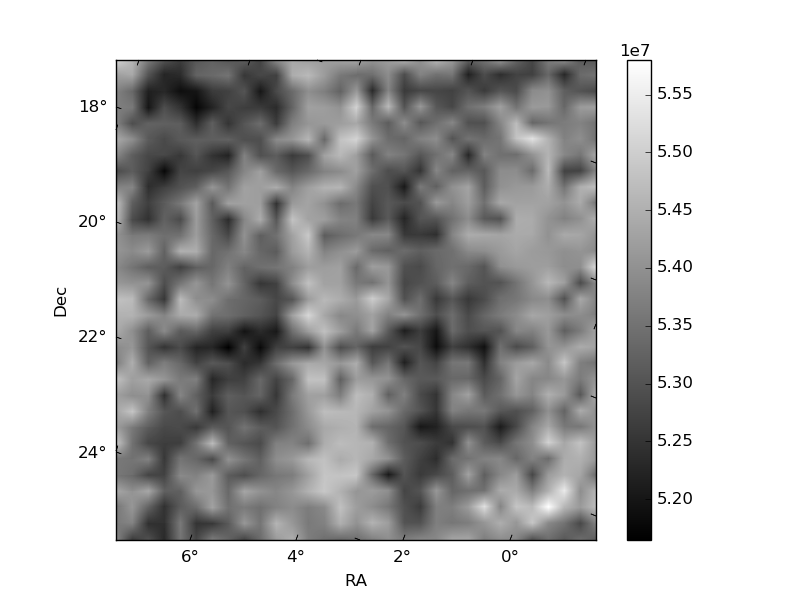
Histogram calculated using DETX and DETY for each event in the final _common_clean file
| Quadrant A | 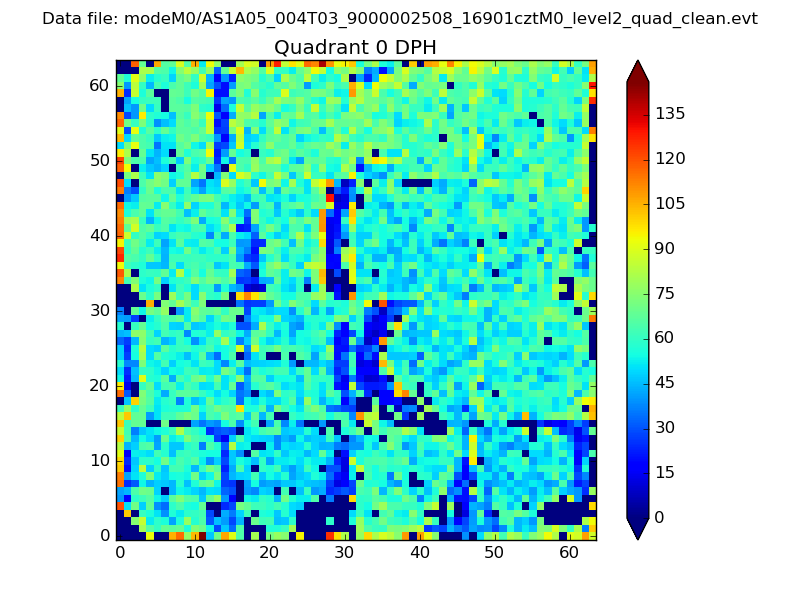 |
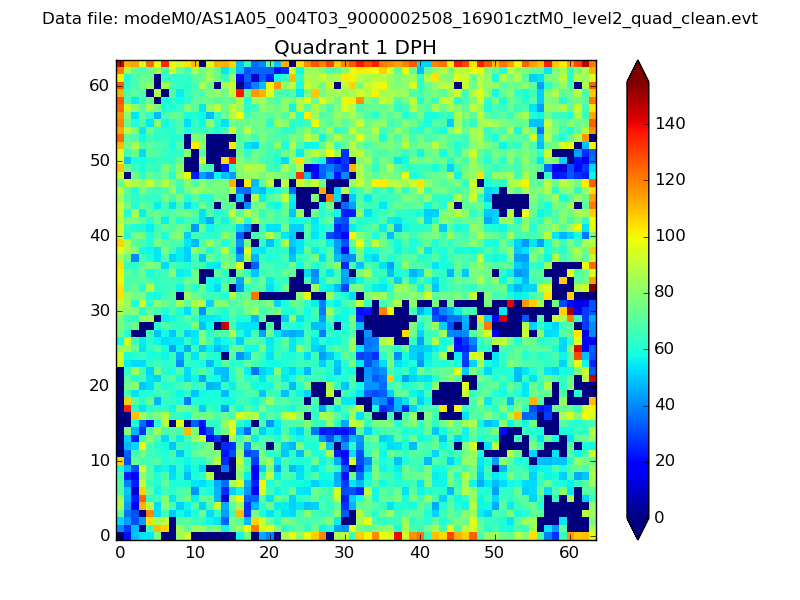 |
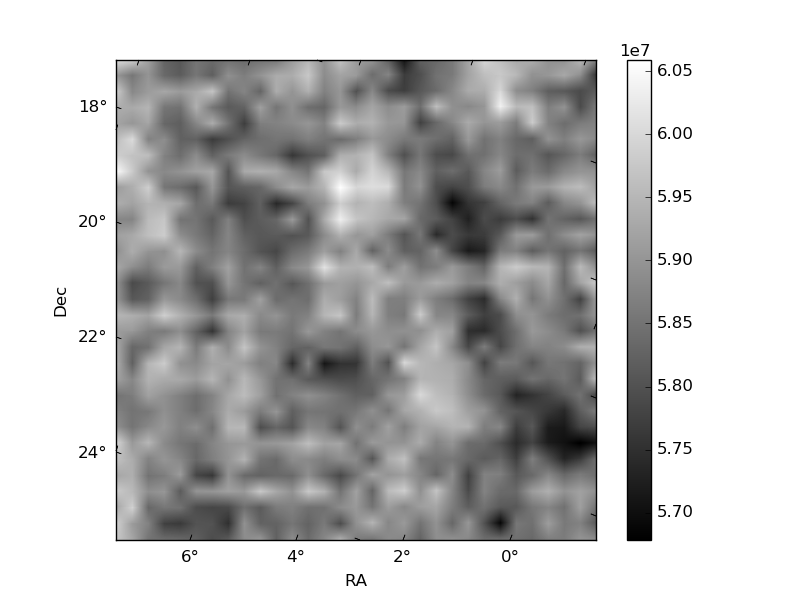
Quadrant B |
|---|---|---|---|
| Quadrant D | 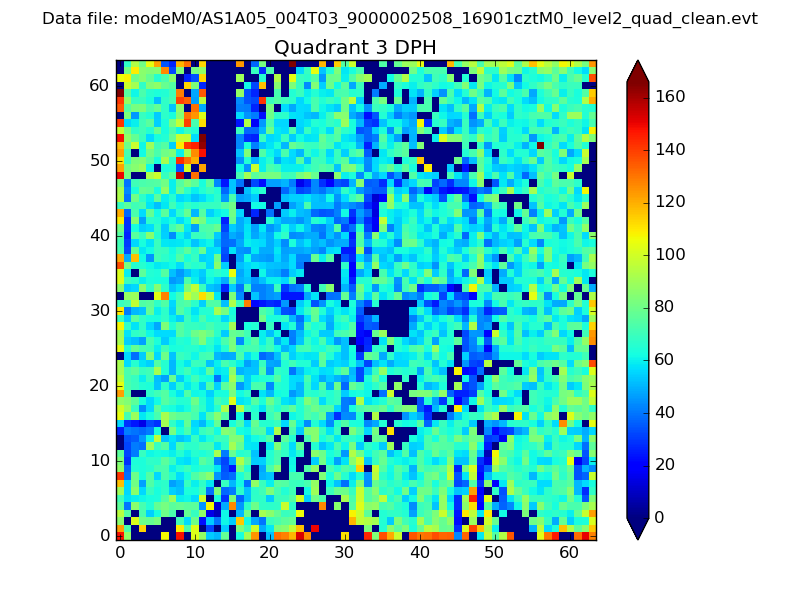 |
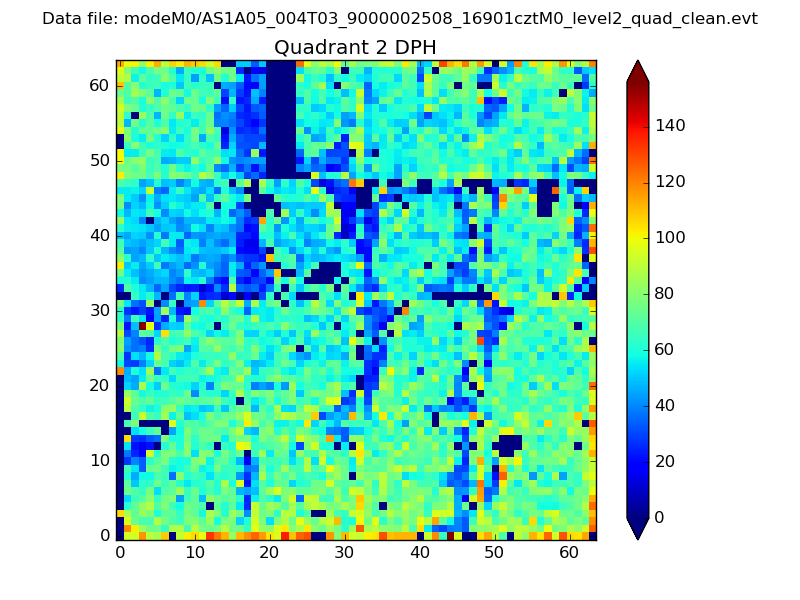 |
Quadrant C |
| Plot type | Count rate plots | Images |
|---|---|---|
| Comparison with Poisson distribution Blue bars denote a histogram of data divided into 1 sec bins. Red curve is a Poisson curve with rate = median count rate of data. |
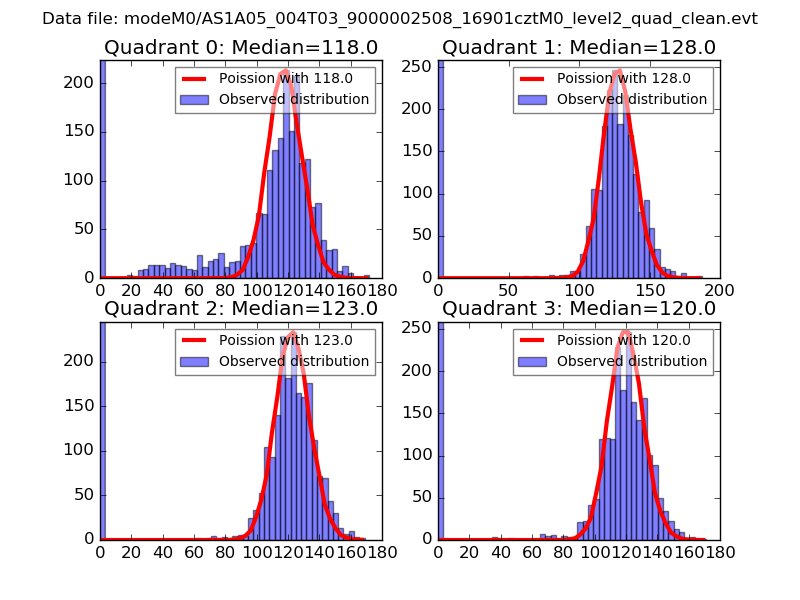 |
 |
| Quadrant-wise count rates Data is divided into 100 sec bins |
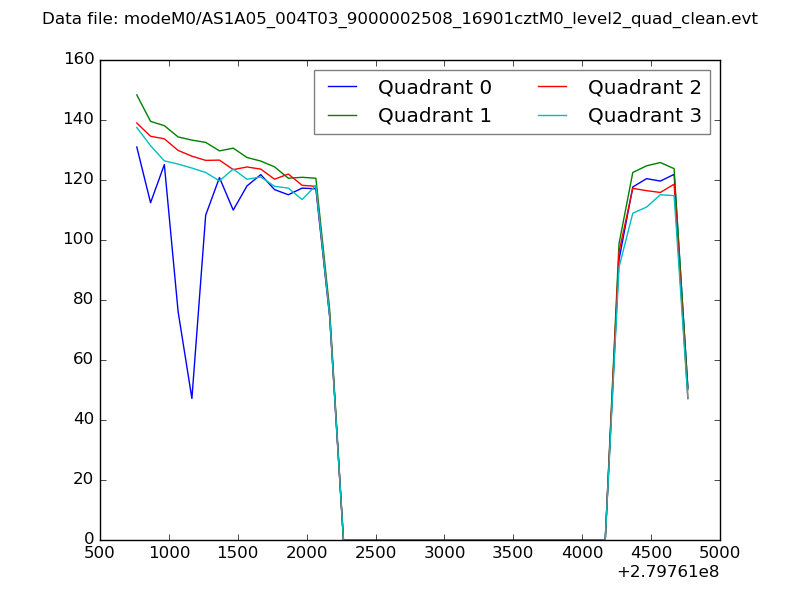 |
|
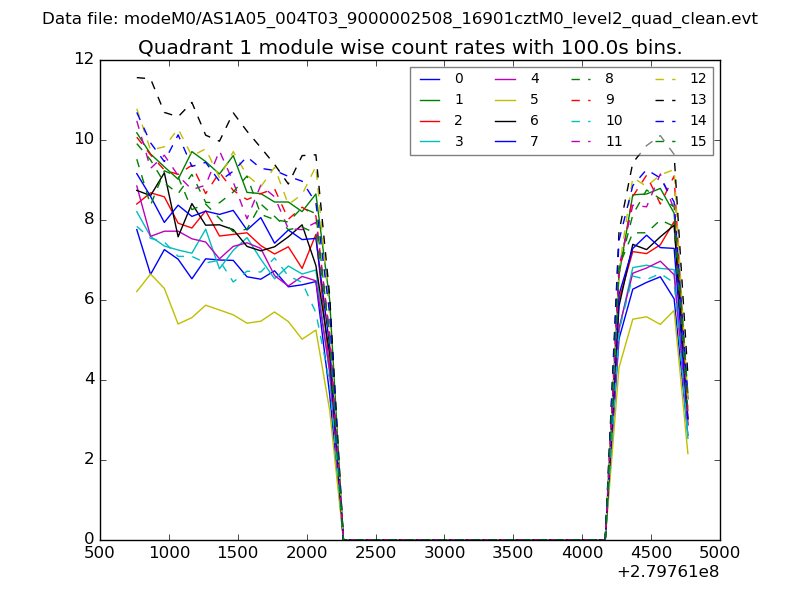
| Module-wise count rates for Quadrant A Data is divided into 100 sec bins |
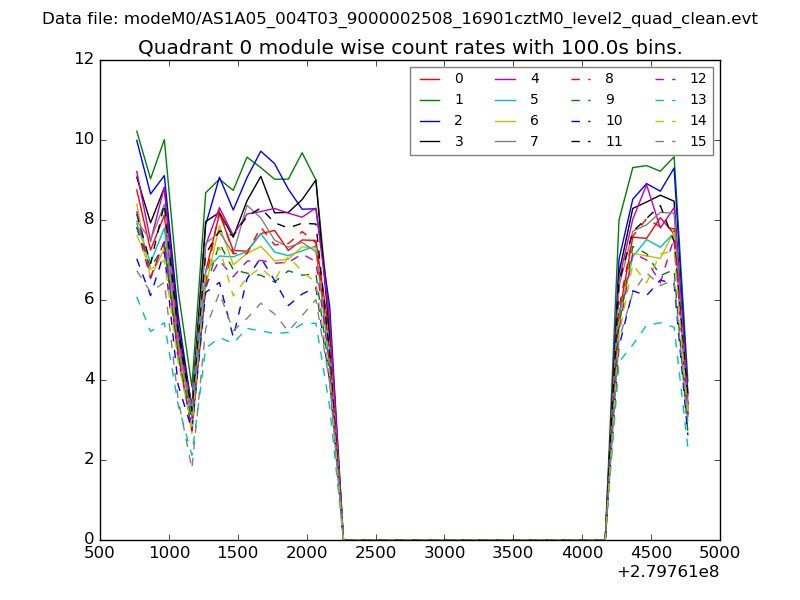 |
 |
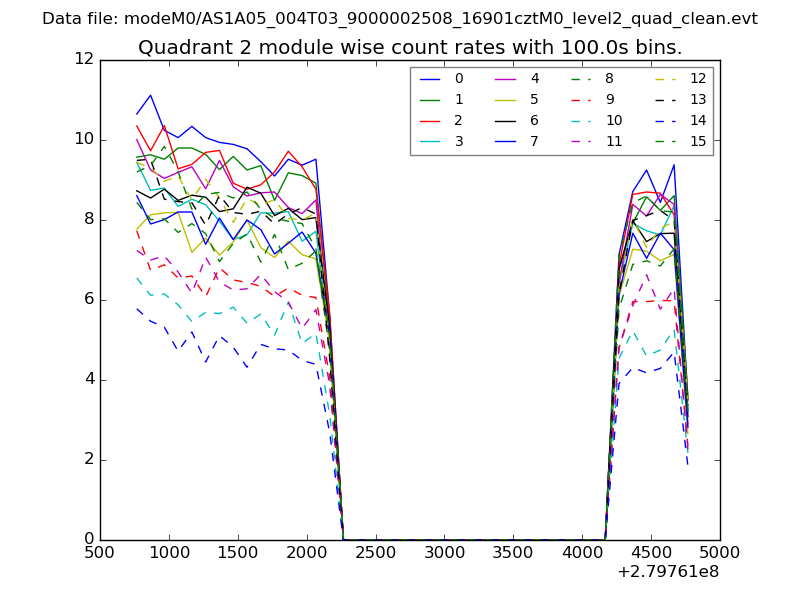
| Module-wise count rates for Quadrant B Data is divided into 100 sec bins |
 |
 |
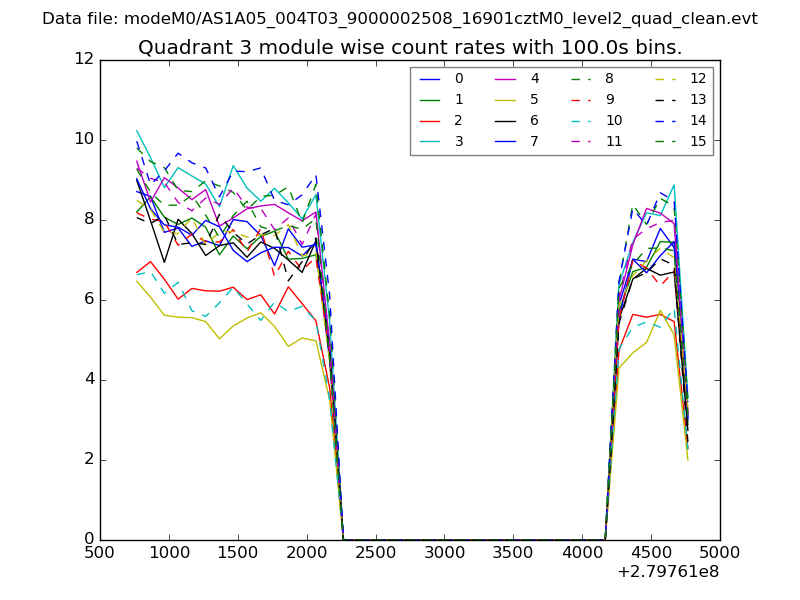
| Module-wise count rates for Quadrant C Data is divided into 100 sec bins |
 |
 |
| Module-wise count rates for Quadrant D Data is divided into 100 sec bins |
 |
 |
| Parameter | Plot |
|---|---|
| CZT HV Monitor | 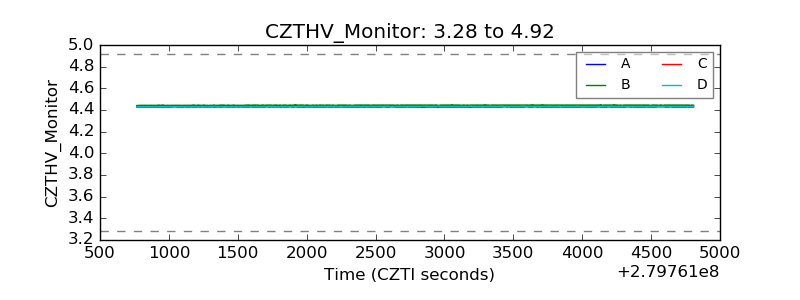 |
| D_VDD | 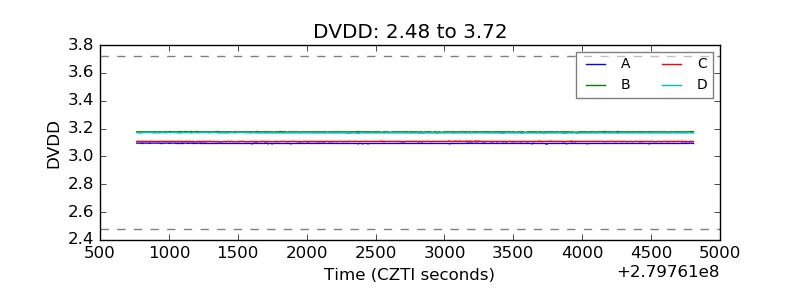 |
| Temperature 1 | 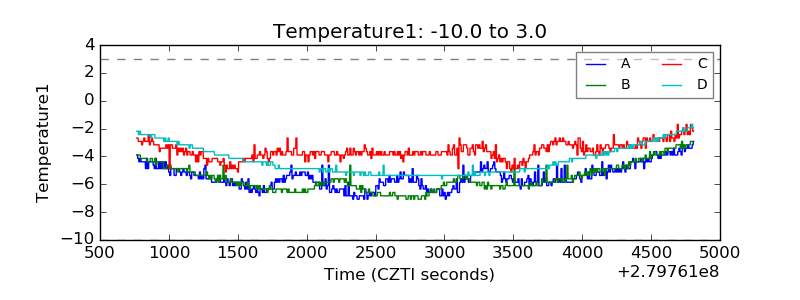 |
| Veto HV Monitor | 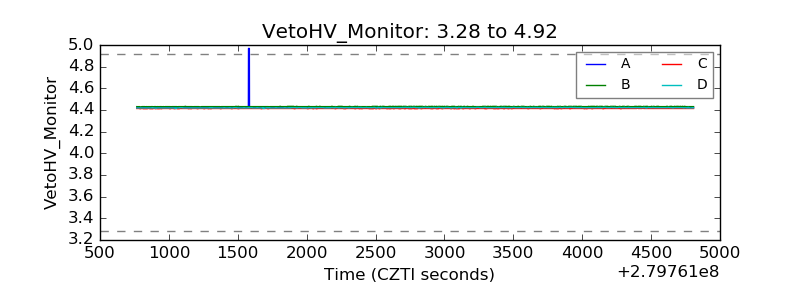 |
| Veto LLD | 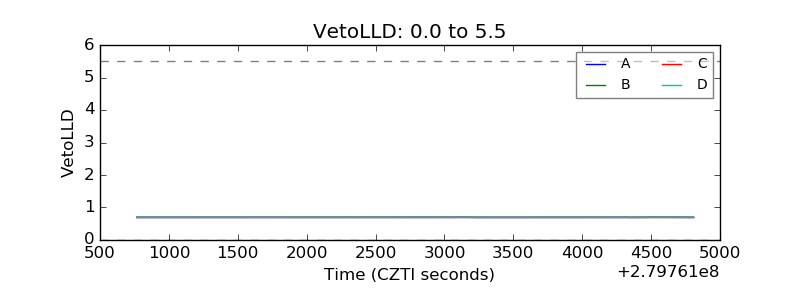 |
| Alpha Counter | 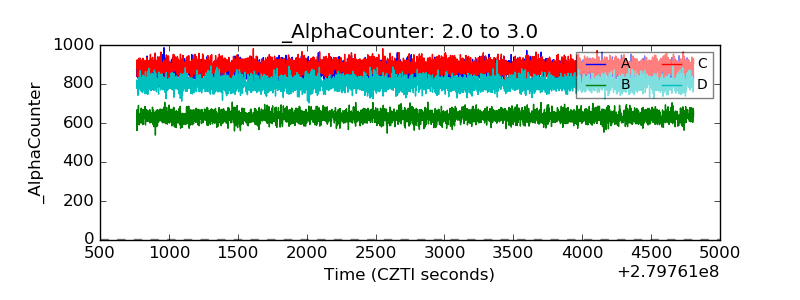 |
| _CPM_Rate | 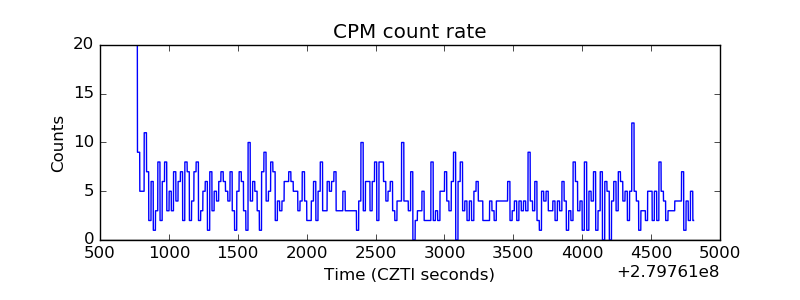 |
| CZT Counter | 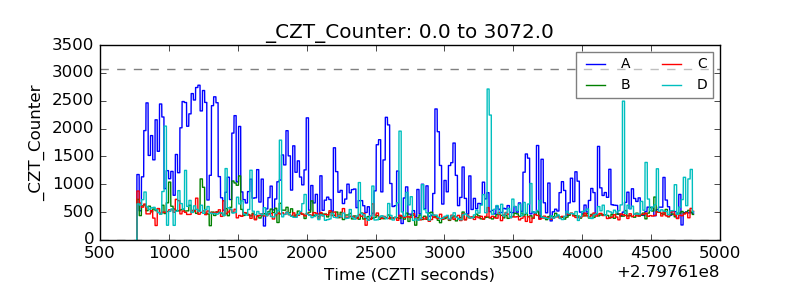 |
| +2.5 Volts monitor | 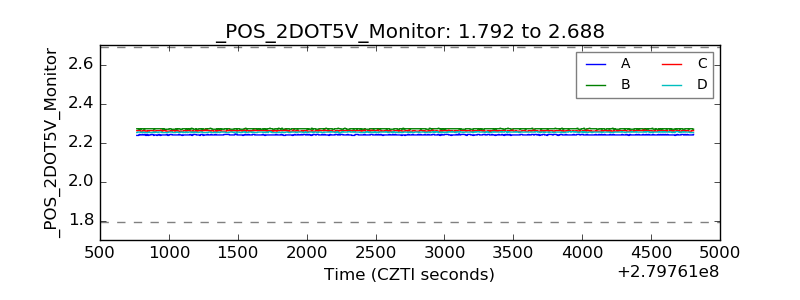 |
| +5 Volts monitor | 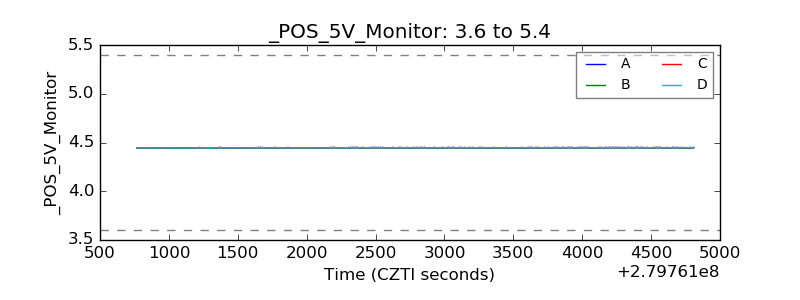 |
| _ROLL_ROT | 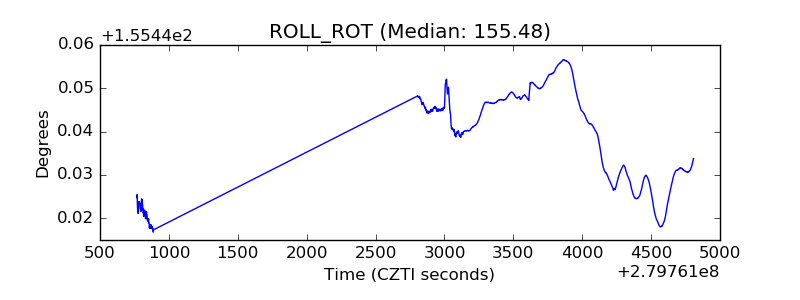 |
| _Roll_DEC | 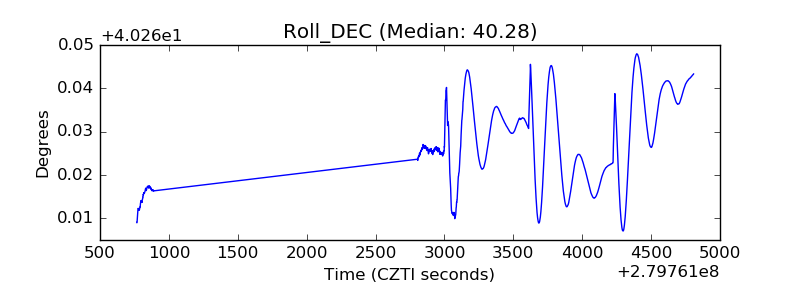 |
| _Roll_RA | 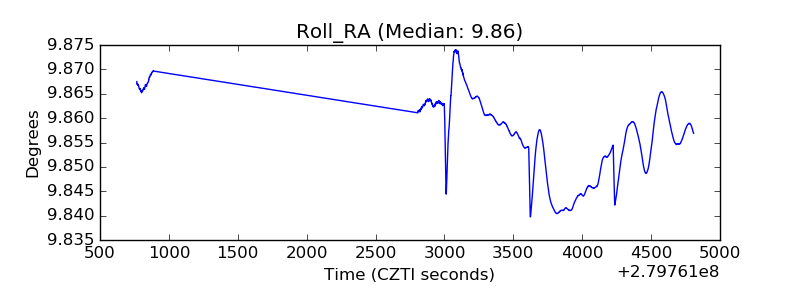 |
| Veto Counter | 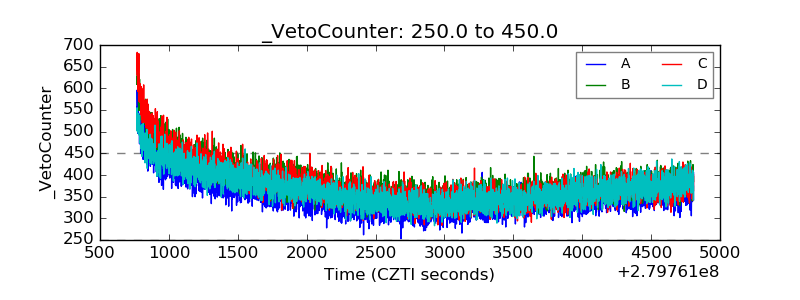 |