| Param | Original file | Final file |
|---|---|---|
| Filename | modeM0/AS1A05_004T03_9000002508_16903cztM0_level2.evt | modeM0/AS1A05_004T03_9000002508_16903cztM0_level2_quad_clean.evt |
| Size (bytes) | 597,752,640 | 44,153,280 |
| Size | 570.1 MB | 42.1 MB |
| Events in quadrant A | 6,799,131 | 206,993 |
| Events in quadrant B | 3,205,492 | 241,250 |
| Events in quadrant C | 3,075,060 | 228,768 |
| Events in quadrant D | 4,594,033 | 216,541 |
| Mode M0 | |||
|---|---|---|---|
| Quadrant | BADHDUFLAG | Total packets | Discarded packets |
| A | 0 | 24552 | 2 |
| B | 0 | 13505 | 2 |
| C | 0 | 13047 | 2 |
| D | 0 | 17937 | 2 |
| Mode SS | |||
|---|---|---|---|
| Quadrant | BADHDUFLAG | Total packets | Discarded packets |
| A | 0 | 130 | 0 |
| B | 0 | 130 | 0 |
| C | 0 | 130 | 0 |
| D | 0 | 130 | 0 |
| Mode M9 | |||
|---|---|---|---|
| Quadrant | BADHDUFLAG | Total packets | Discarded packets |
| A | 0 | 13 | 0 |
| B | 0 | 14 | 0 |
| C | 0 | 14 | 0 |
| D | 0 | 14 | 0 |
| Quadrant | Total seconds | Saturated seconds | Saturation percentage |
|---|---|---|---|
| A | 6336 | 1065 | 16.808712% |
| B | 6336 | 31 | 0.489268% |
| C | 6336 | 48 | 0.757576% |
| D | 6336 | 279 | 4.403409% |
Noise dominated data is calculated using 1-second bins in cleaned event files. If a bin has >2000 counts, and if more than 50% of those come from <1% of pixels, then it is considered to be noise-dominated and hence unusable.
| Quadrant | # 1 sec bins | Bins with >0 counts | Bins with >2000 counts | High rate bins dominated by noise | Noise dominated (total time) | Noise dominated (detector-on time) | Marked lightcurve |
|---|---|---|---|---|---|---|---|
| A | 7487 | 6337 | 752 | 752 | 10.04% | 11.87% | 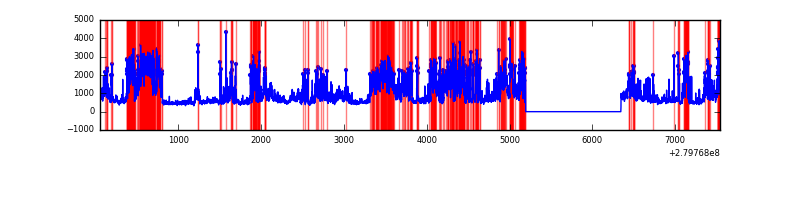 |
| B | 7487 | 6338 | 2 | 2 | 0.03% | 0.03% | 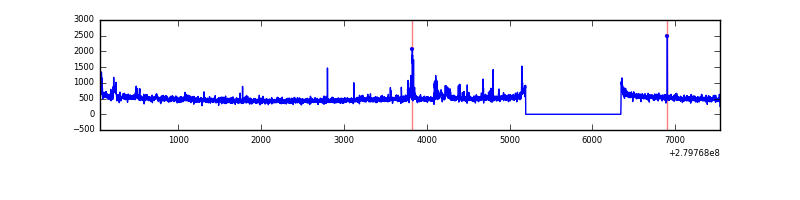 |
| C | 7487 | 6338 | 0 | 0 | 0.00% | 0.00% |  |
| D | 7487 | 6338 | 185 | 185 | 2.47% | 2.92% | 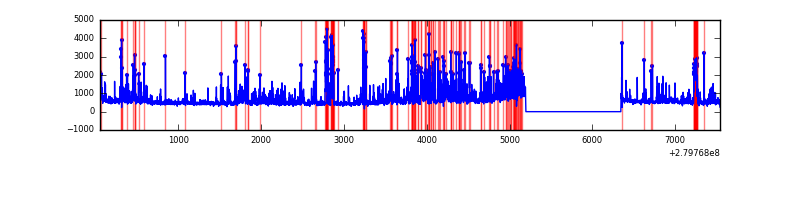 |
Top three noisy pixels from each quadrant. If the there are fewer than three noisy pixels in the level2.evt file, extra rows are filled as -1
| Pixel properties | Quadrant properties | ||||||
|---|---|---|---|---|---|---|---|
| Quadrant | DetID | PixID | Counts | Sigma | Mean | Median | Sigma |
| A | 15 | 174 | 3925027 | 27092.27 | 724 | 709 | 144.9 |
| A | 12 | 189 | 78452 | 536.71 | 724 | 709 | 144.9 |
| A | 0 | 226 | 6373 | 39.1 | 724 | 709 | 144.9 |
| B | 15 | 35 | 80898 | 545.29 | 773 | 754 | 147.0 |
| B | 0 | 219 | 51356 | 344.29 | 773 | 754 | 147.0 |
| B | 12 | 111 | 17004 | 110.56 | 773 | 754 | 147.0 |
| C | 14 | 238 | 115280 | 665.35 | 742 | 749 | 172.1 |
| C | 3 | 233 | 59481 | 341.19 | 742 | 749 | 172.1 |
| C | 13 | 61 | 5195 | 25.83 | 742 | 749 | 172.1 |
| D | 1 | 52 | 1570506 | 8782.94 | 734 | 713 | 178.7 |
| D | 12 | 235 | 123437 | 686.64 | 734 | 713 | 178.7 |
| D | 2 | 33 | 71921 | 398.41 | 734 | 713 | 178.7 |
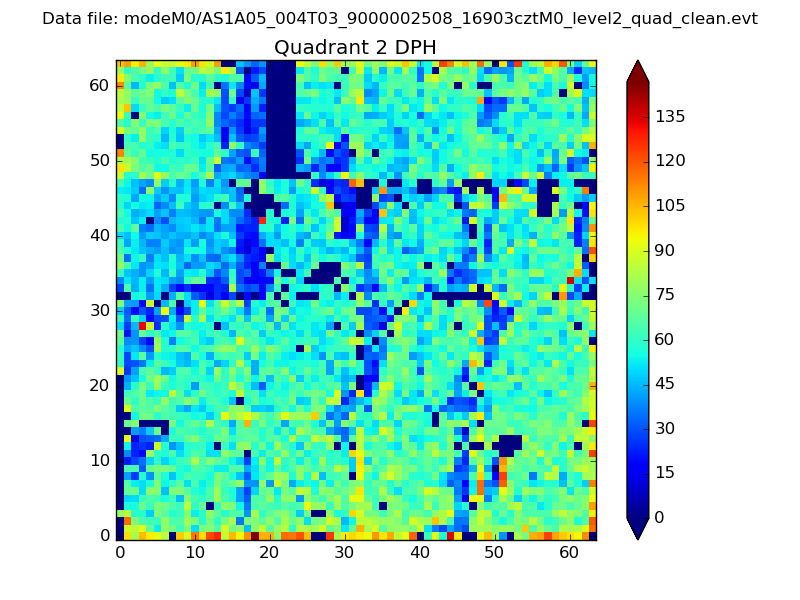
Histogram calculated using DETX and DETY for each event in the final _common_clean file
| Quadrant A | 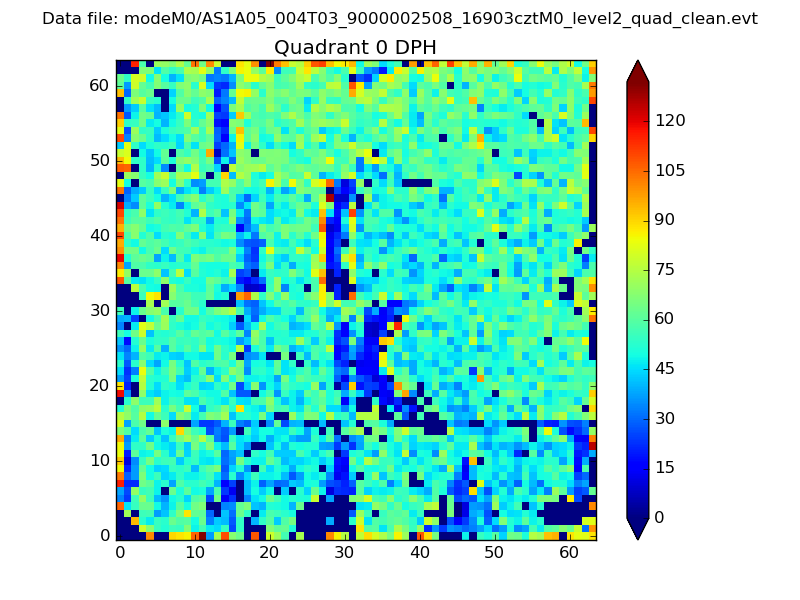 |
 |
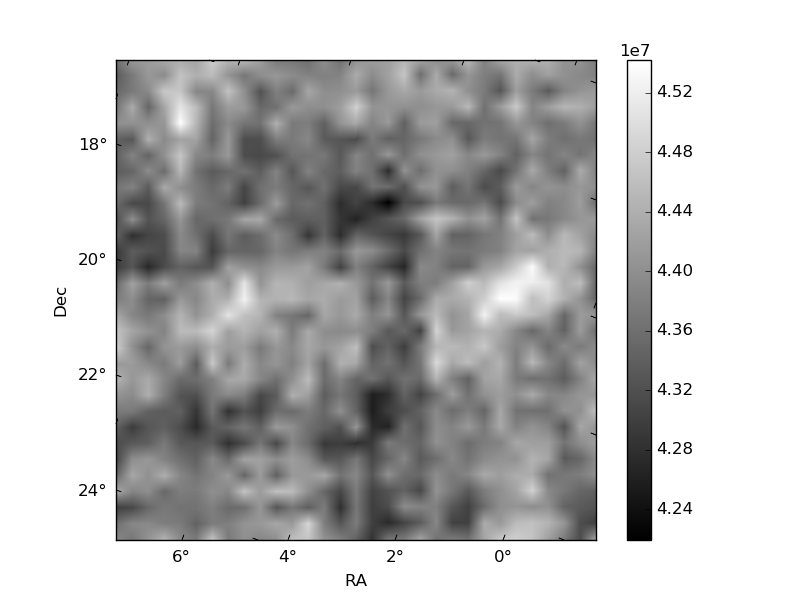
Quadrant B |
|---|---|---|---|
| Quadrant D | 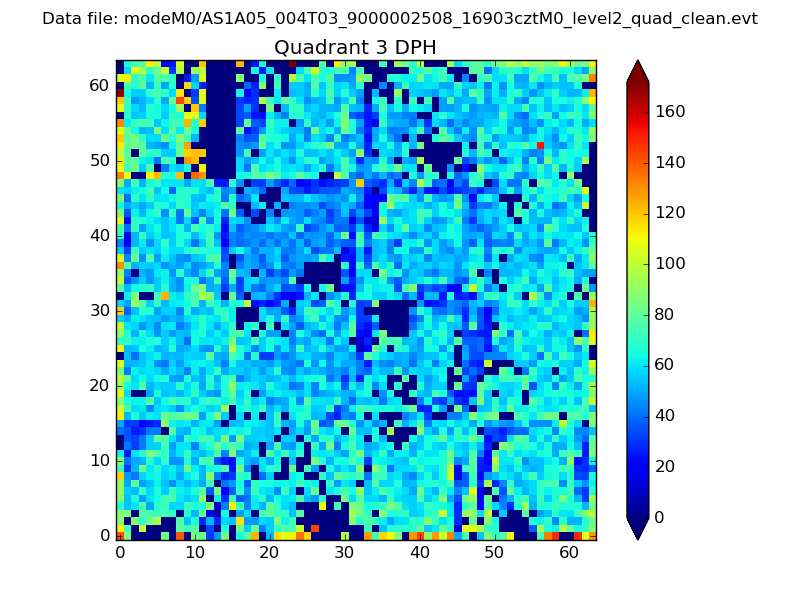 |
 |
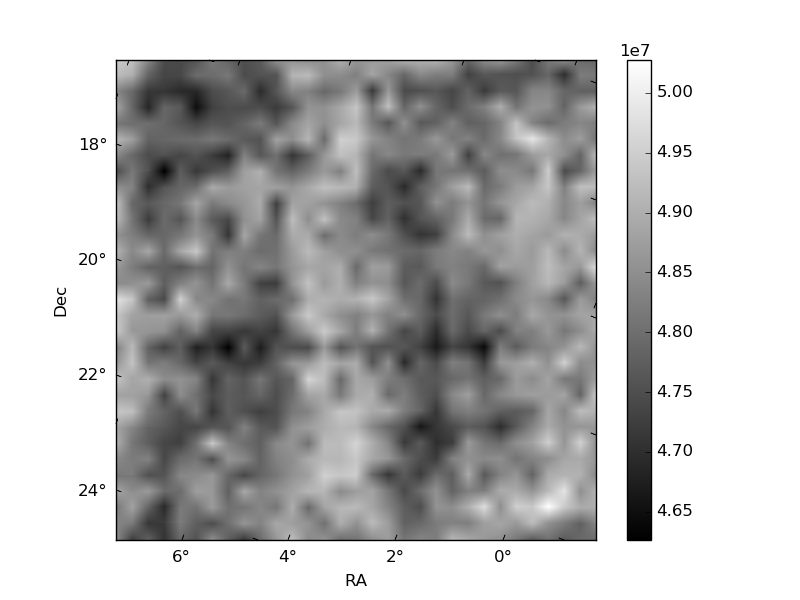
Quadrant C |
| Plot type | Count rate plots | Images |
|---|---|---|
| Comparison with Poisson distribution Blue bars denote a histogram of data divided into 1 sec bins. Red curve is a Poisson curve with rate = median count rate of data. |
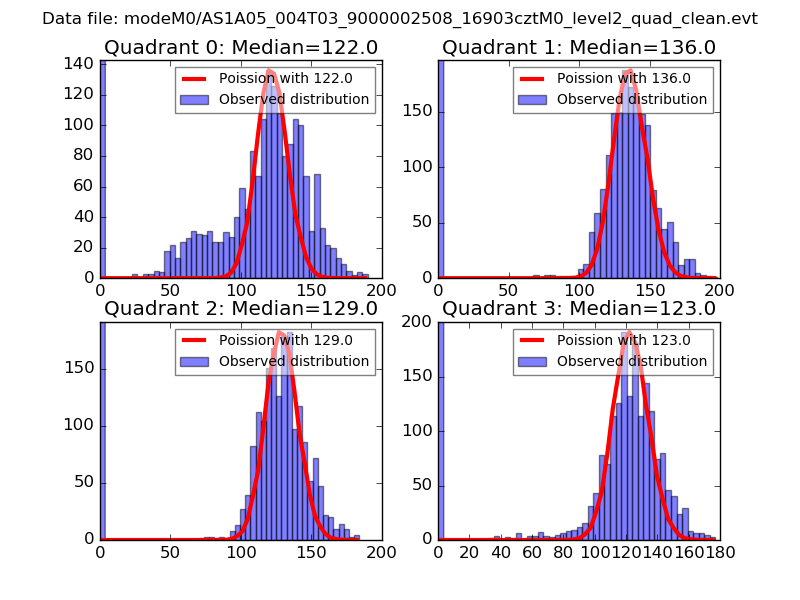 |
 |
| Quadrant-wise count rates Data is divided into 100 sec bins |
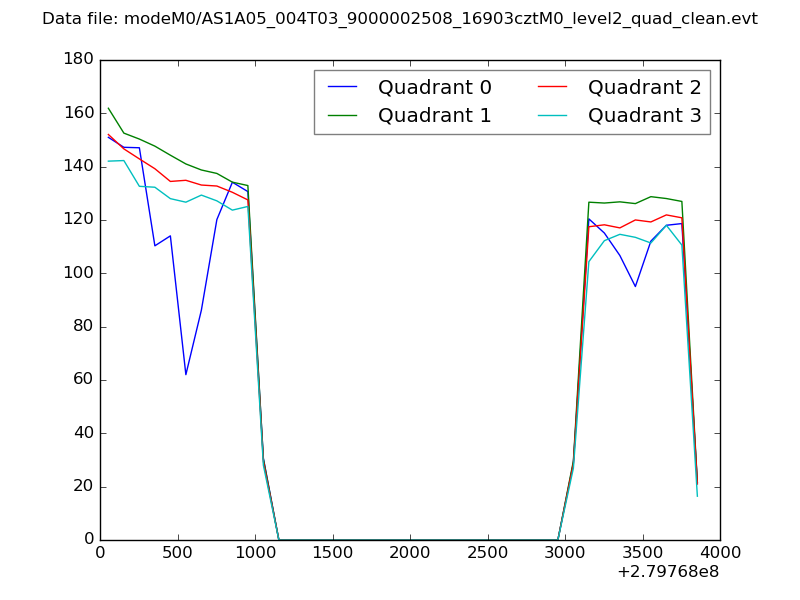 |
|
| Module-wise count rates for Quadrant A Data is divided into 100 sec bins |
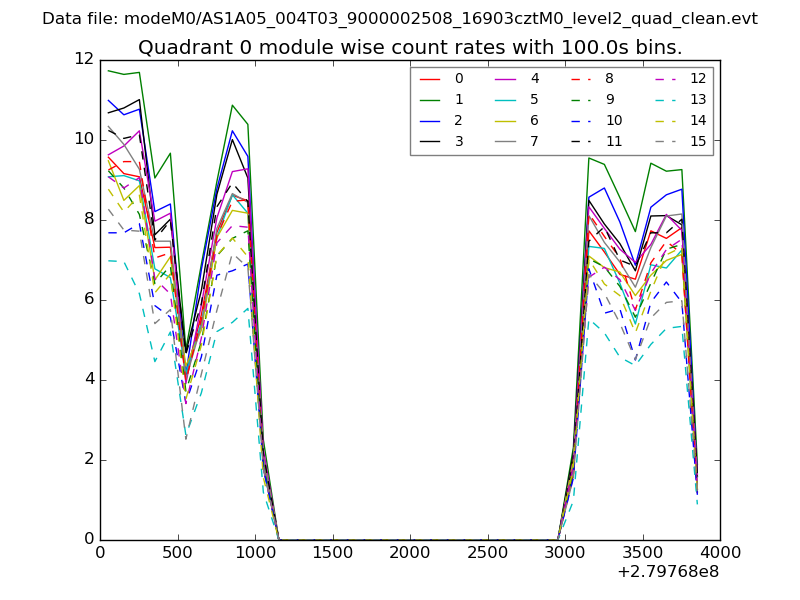 |
 |
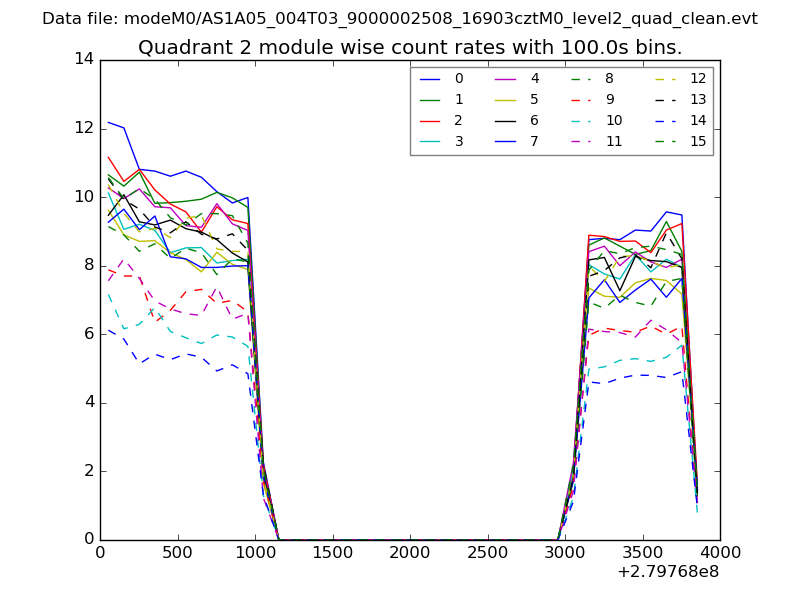
| Module-wise count rates for Quadrant B Data is divided into 100 sec bins |
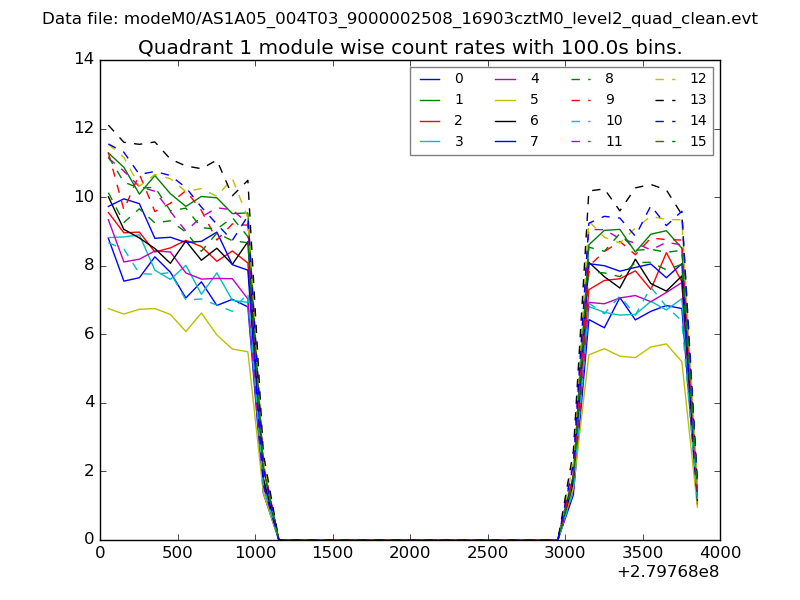 |
 |
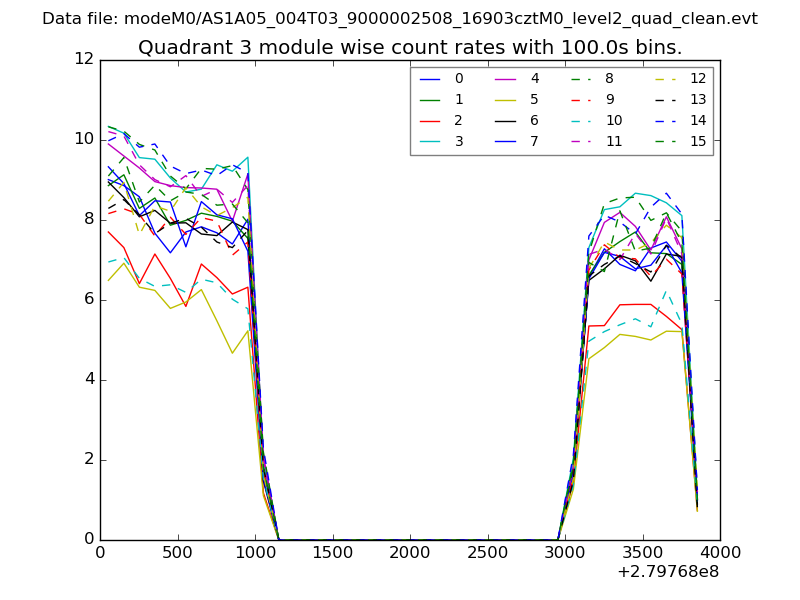
| Module-wise count rates for Quadrant C Data is divided into 100 sec bins |
 |
 |
| Module-wise count rates for Quadrant D Data is divided into 100 sec bins |
 |
 |
| Parameter | Plot |
|---|---|
| CZT HV Monitor | 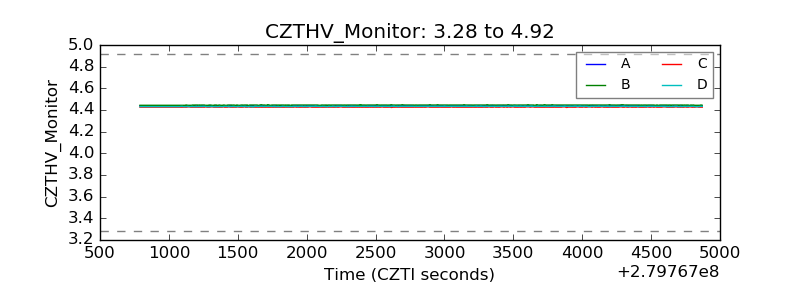 |
| D_VDD | 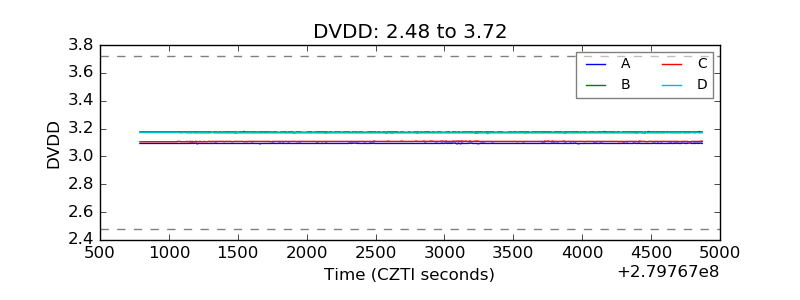 |
| Temperature 1 | 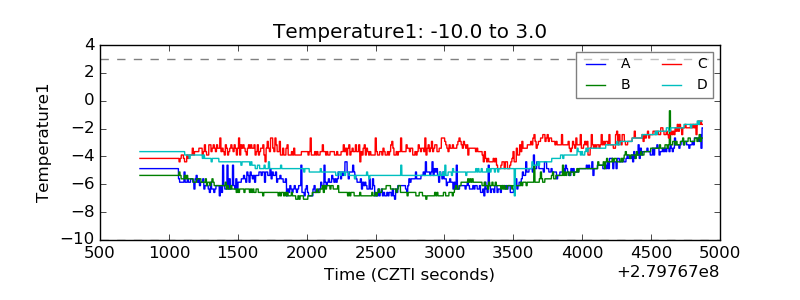 |
| Veto HV Monitor | 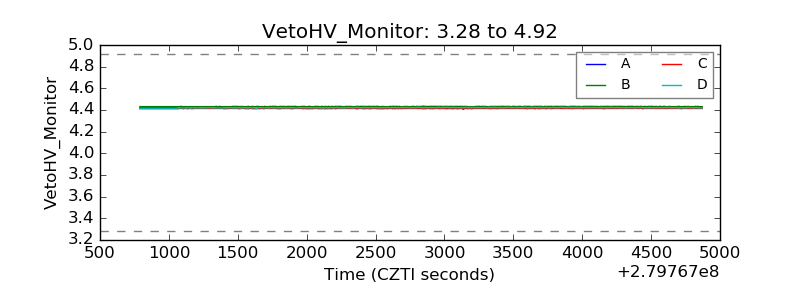 |
| Veto LLD | 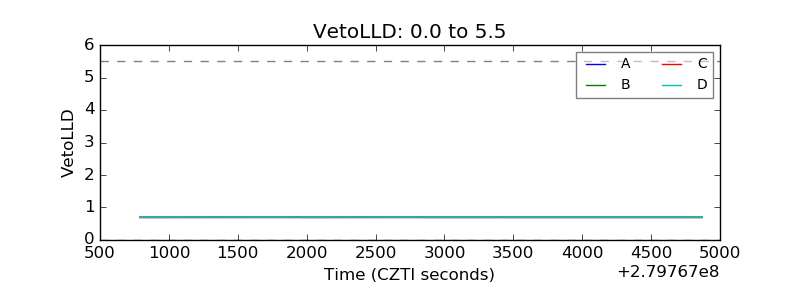 |
| Alpha Counter | 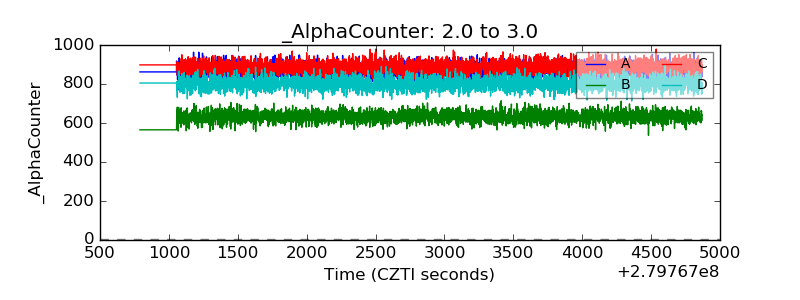 |
| _CPM_Rate | 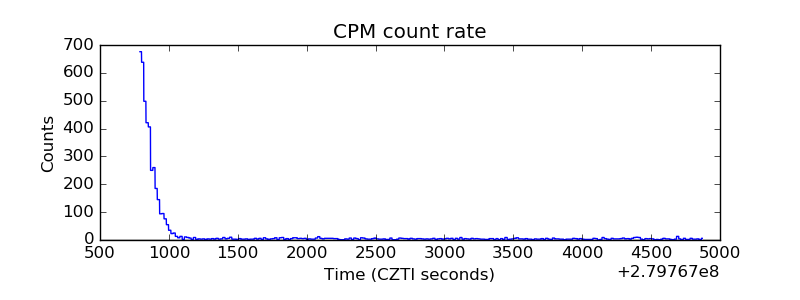 |
| CZT Counter | 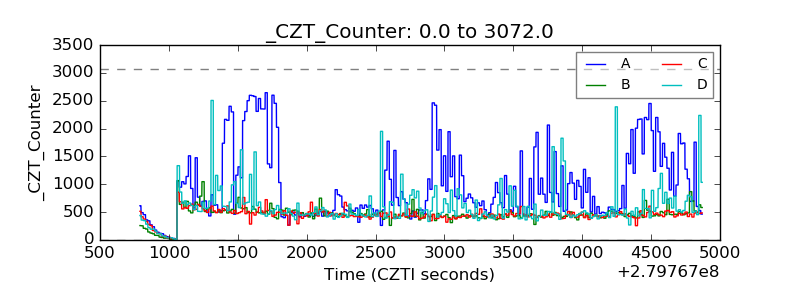 |
| +2.5 Volts monitor |  |
| +5 Volts monitor |  |
| _ROLL_ROT |  |
| _Roll_DEC | 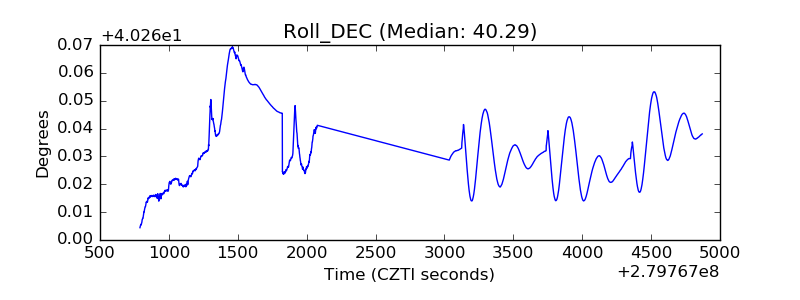 |
| _Roll_RA | 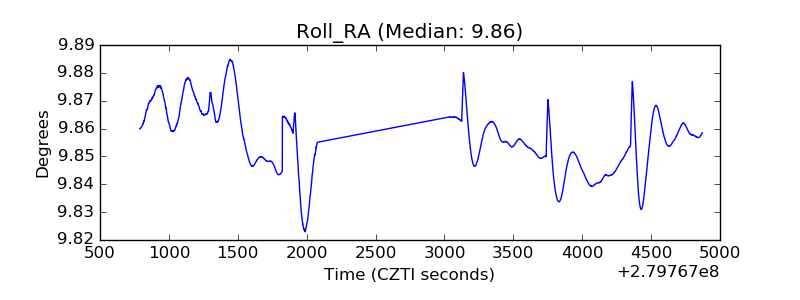 |
| Veto Counter | 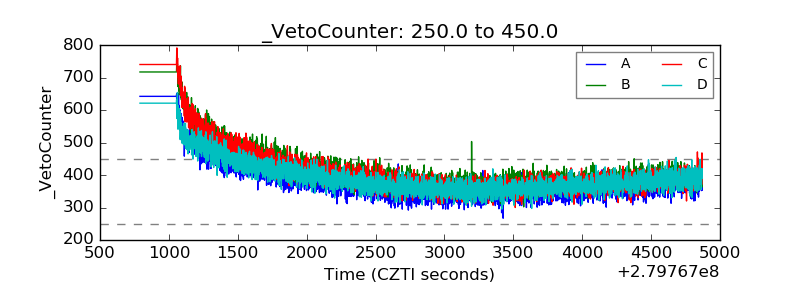 |